- Hypothesis Testing: Definition, Uses, Limitations + Examples

Hypothesis testing is as old as the scientific method and is at the heart of the research process.
Research exists to validate or disprove assumptions about various phenomena. The process of validation involves testing and it is in this context that we will explore hypothesis testing.

What is a Hypothesis?
A hypothesis is a calculated prediction or assumption about a population parameter based on limited evidence. The whole idea behind hypothesis formulation is testing—this means the researcher subjects his or her calculated assumption to a series of evaluations to know whether they are true or false.
Typically, every research starts with a hypothesis—the investigator makes a claim and experiments to prove that this claim is true or false . For instance, if you predict that students who drink milk before class perform better than those who don’t, then this becomes a hypothesis that can be confirmed or refuted using an experiment.
Read: What is Empirical Research Study? [Examples & Method]
What are the Types of Hypotheses?
1. simple hypothesis.
Also known as a basic hypothesis, a simple hypothesis suggests that an independent variable is responsible for a corresponding dependent variable. In other words, an occurrence of the independent variable inevitably leads to an occurrence of the dependent variable.
Typically, simple hypotheses are considered as generally true, and they establish a causal relationship between two variables.
Examples of Simple Hypothesis
- Drinking soda and other sugary drinks can cause obesity.
- Smoking cigarettes daily leads to lung cancer.
2. Complex Hypothesis
A complex hypothesis is also known as a modal. It accounts for the causal relationship between two independent variables and the resulting dependent variables. This means that the combination of the independent variables leads to the occurrence of the dependent variables .
Examples of Complex Hypotheses
- Adults who do not smoke and drink are less likely to develop liver-related conditions.
- Global warming causes icebergs to melt which in turn causes major changes in weather patterns.
3. Null Hypothesis
As the name suggests, a null hypothesis is formed when a researcher suspects that there’s no relationship between the variables in an observation. In this case, the purpose of the research is to approve or disapprove this assumption.
Examples of Null Hypothesis
- This is no significant change in a student’s performance if they drink coffee or tea before classes.
- There’s no significant change in the growth of a plant if one uses distilled water only or vitamin-rich water.
Read: Research Report: Definition, Types + [Writing Guide]
4. Alternative Hypothesis
To disapprove a null hypothesis, the researcher has to come up with an opposite assumption—this assumption is known as the alternative hypothesis. This means if the null hypothesis says that A is false, the alternative hypothesis assumes that A is true.
An alternative hypothesis can be directional or non-directional depending on the direction of the difference. A directional alternative hypothesis specifies the direction of the tested relationship, stating that one variable is predicted to be larger or smaller than the null value while a non-directional hypothesis only validates the existence of a difference without stating its direction.
Examples of Alternative Hypotheses
- Starting your day with a cup of tea instead of a cup of coffee can make you more alert in the morning.
- The growth of a plant improves significantly when it receives distilled water instead of vitamin-rich water.
5. Logical Hypothesis
Logical hypotheses are some of the most common types of calculated assumptions in systematic investigations. It is an attempt to use your reasoning to connect different pieces in research and build a theory using little evidence. In this case, the researcher uses any data available to him, to form a plausible assumption that can be tested.
Examples of Logical Hypothesis
- Waking up early helps you to have a more productive day.
- Beings from Mars would not be able to breathe the air in the atmosphere of the Earth.
6. Empirical Hypothesis
After forming a logical hypothesis, the next step is to create an empirical or working hypothesis. At this stage, your logical hypothesis undergoes systematic testing to prove or disprove the assumption. An empirical hypothesis is subject to several variables that can trigger changes and lead to specific outcomes.
Examples of Empirical Testing
- People who eat more fish run faster than people who eat meat.
- Women taking vitamin E grow hair faster than those taking vitamin K.
7. Statistical Hypothesis
When forming a statistical hypothesis, the researcher examines the portion of a population of interest and makes a calculated assumption based on the data from this sample. A statistical hypothesis is most common with systematic investigations involving a large target audience. Here, it’s impossible to collect responses from every member of the population so you have to depend on data from your sample and extrapolate the results to the wider population.
Examples of Statistical Hypothesis
- 45% of students in Louisiana have middle-income parents.
- 80% of the UK’s population gets a divorce because of irreconcilable differences.
What is Hypothesis Testing?
Hypothesis testing is an assessment method that allows researchers to determine the plausibility of a hypothesis. It involves testing an assumption about a specific population parameter to know whether it’s true or false. These population parameters include variance, standard deviation, and median.
Typically, hypothesis testing starts with developing a null hypothesis and then performing several tests that support or reject the null hypothesis. The researcher uses test statistics to compare the association or relationship between two or more variables.
Explore: Research Bias: Definition, Types + Examples
Researchers also use hypothesis testing to calculate the coefficient of variation and determine if the regression relationship and the correlation coefficient are statistically significant.
How Hypothesis Testing Works
The basis of hypothesis testing is to examine and analyze the null hypothesis and alternative hypothesis to know which one is the most plausible assumption. Since both assumptions are mutually exclusive, only one can be true. In other words, the occurrence of a null hypothesis destroys the chances of the alternative coming to life, and vice-versa.
Interesting: 21 Chrome Extensions for Academic Researchers in 2021
What Are The Stages of Hypothesis Testing?
To successfully confirm or refute an assumption, the researcher goes through five (5) stages of hypothesis testing;
- Determine the null hypothesis
- Specify the alternative hypothesis
- Set the significance level
- Calculate the test statistics and corresponding P-value
- Draw your conclusion
- Determine the Null Hypothesis
Like we mentioned earlier, hypothesis testing starts with creating a null hypothesis which stands as an assumption that a certain statement is false or implausible. For example, the null hypothesis (H0) could suggest that different subgroups in the research population react to a variable in the same way.
- Specify the Alternative Hypothesis
Once you know the variables for the null hypothesis, the next step is to determine the alternative hypothesis. The alternative hypothesis counters the null assumption by suggesting the statement or assertion is true. Depending on the purpose of your research, the alternative hypothesis can be one-sided or two-sided.
Using the example we established earlier, the alternative hypothesis may argue that the different sub-groups react differently to the same variable based on several internal and external factors.
- Set the Significance Level
Many researchers create a 5% allowance for accepting the value of an alternative hypothesis, even if the value is untrue. This means that there is a 0.05 chance that one would go with the value of the alternative hypothesis, despite the truth of the null hypothesis.
Something to note here is that the smaller the significance level, the greater the burden of proof needed to reject the null hypothesis and support the alternative hypothesis.
Explore: What is Data Interpretation? + [Types, Method & Tools]
- Calculate the Test Statistics and Corresponding P-Value
Test statistics in hypothesis testing allow you to compare different groups between variables while the p-value accounts for the probability of obtaining sample statistics if your null hypothesis is true. In this case, your test statistics can be the mean, median and similar parameters.
If your p-value is 0.65, for example, then it means that the variable in your hypothesis will happen 65 in100 times by pure chance. Use this formula to determine the p-value for your data:

- Draw Your Conclusions
After conducting a series of tests, you should be able to agree or refute the hypothesis based on feedback and insights from your sample data.
Applications of Hypothesis Testing in Research
Hypothesis testing isn’t only confined to numbers and calculations; it also has several real-life applications in business, manufacturing, advertising, and medicine.
In a factory or other manufacturing plants, hypothesis testing is an important part of quality and production control before the final products are approved and sent out to the consumer.
During ideation and strategy development, C-level executives use hypothesis testing to evaluate their theories and assumptions before any form of implementation. For example, they could leverage hypothesis testing to determine whether or not some new advertising campaign, marketing technique, etc. causes increased sales.
In addition, hypothesis testing is used during clinical trials to prove the efficacy of a drug or new medical method before its approval for widespread human usage.
What is an Example of Hypothesis Testing?
An employer claims that her workers are of above-average intelligence. She takes a random sample of 20 of them and gets the following results:
Mean IQ Scores: 110
Standard Deviation: 15
Mean Population IQ: 100
Step 1: Using the value of the mean population IQ, we establish the null hypothesis as 100.
Step 2: State that the alternative hypothesis is greater than 100.
Step 3: State the alpha level as 0.05 or 5%
Step 4: Find the rejection region area (given by your alpha level above) from the z-table. An area of .05 is equal to a z-score of 1.645.
Step 5: Calculate the test statistics using this formula

Z = (110–100) ÷ (15÷√20)
10 ÷ 3.35 = 2.99
If the value of the test statistics is higher than the value of the rejection region, then you should reject the null hypothesis. If it is less, then you cannot reject the null.
In this case, 2.99 > 1.645 so we reject the null.
Importance/Benefits of Hypothesis Testing
The most significant benefit of hypothesis testing is it allows you to evaluate the strength of your claim or assumption before implementing it in your data set. Also, hypothesis testing is the only valid method to prove that something “is or is not”. Other benefits include:
- Hypothesis testing provides a reliable framework for making any data decisions for your population of interest.
- It helps the researcher to successfully extrapolate data from the sample to the larger population.
- Hypothesis testing allows the researcher to determine whether the data from the sample is statistically significant.
- Hypothesis testing is one of the most important processes for measuring the validity and reliability of outcomes in any systematic investigation.
- It helps to provide links to the underlying theory and specific research questions.
Criticism and Limitations of Hypothesis Testing
Several limitations of hypothesis testing can affect the quality of data you get from this process. Some of these limitations include:
- The interpretation of a p-value for observation depends on the stopping rule and definition of multiple comparisons. This makes it difficult to calculate since the stopping rule is subject to numerous interpretations, plus “multiple comparisons” are unavoidably ambiguous.
- Conceptual issues often arise in hypothesis testing, especially if the researcher merges Fisher and Neyman-Pearson’s methods which are conceptually distinct.
- In an attempt to focus on the statistical significance of the data, the researcher might ignore the estimation and confirmation by repeated experiments.
- Hypothesis testing can trigger publication bias, especially when it requires statistical significance as a criterion for publication.
- When used to detect whether a difference exists between groups, hypothesis testing can trigger absurd assumptions that affect the reliability of your observation.
Connect to Formplus, Get Started Now - It's Free!
- alternative hypothesis
- alternative vs null hypothesis
- complex hypothesis
- empirical hypothesis
- hypothesis testing
- logical hypothesis
- simple hypothesis
- statistical hypothesis
- busayo.longe
You may also like:
Type I vs Type II Errors: Causes, Examples & Prevention
This article will discuss the two different types of errors in hypothesis testing and how you can prevent them from occurring in your research
What is Pure or Basic Research? + [Examples & Method]
Simple guide on pure or basic research, its methods, characteristics, advantages, and examples in science, medicine, education and psychology
Alternative vs Null Hypothesis: Pros, Cons, Uses & Examples
We are going to discuss alternative hypotheses and null hypotheses in this post and how they work in research.
Internal Validity in Research: Definition, Threats, Examples
In this article, we will discuss the concept of internal validity, some clear examples, its importance, and how to test it.
Formplus - For Seamless Data Collection
Collect data the right way with a versatile data collection tool. try formplus and transform your work productivity today..
- How it works
Hypothesis Testing – A Complete Guide with Examples
Published by Alvin Nicolas at August 14th, 2021 , Revised On October 26, 2023
In statistics, hypothesis testing is a critical tool. It allows us to make informed decisions about populations based on sample data. Whether you are a researcher trying to prove a scientific point, a marketer analysing A/B test results, or a manufacturer ensuring quality control, hypothesis testing plays a pivotal role. This guide aims to introduce you to the concept and walk you through real-world examples.
What is a Hypothesis and a Hypothesis Testing?
A hypothesis is considered a belief or assumption that has to be accepted, rejected, proved or disproved. In contrast, a research hypothesis is a research question for a researcher that has to be proven correct or incorrect through investigation.
What is Hypothesis Testing?
Hypothesis testing is a scientific method used for making a decision and drawing conclusions by using a statistical approach. It is used to suggest new ideas by testing theories to know whether or not the sample data supports research. A research hypothesis is a predictive statement that has to be tested using scientific methods that join an independent variable to a dependent variable.
Example: The academic performance of student A is better than student B
Characteristics of the Hypothesis to be Tested
A hypothesis should be:
- Clear and precise
- Capable of being tested
- Able to relate to a variable
- Stated in simple terms
- Consistent with known facts
- Limited in scope and specific
- Tested in a limited timeframe
- Explain the facts in detail
What is a Null Hypothesis and Alternative Hypothesis?
A null hypothesis is a hypothesis when there is no significant relationship between the dependent and the participants’ independent variables .
In simple words, it’s a hypothesis that has been put forth but hasn’t been proved as yet. A researcher aims to disprove the theory. The abbreviation “Ho” is used to denote a null hypothesis.
If you want to compare two methods and assume that both methods are equally good, this assumption is considered the null hypothesis.
Example: In an automobile trial, you feel that the new vehicle’s mileage is similar to the previous model of the car, on average. You can write it as: Ho: there is no difference between the mileage of both vehicles. If your findings don’t support your hypothesis and you get opposite results, this outcome will be considered an alternative hypothesis.
If you assume that one method is better than another method, then it’s considered an alternative hypothesis. The alternative hypothesis is the theory that a researcher seeks to prove and is typically denoted by H1 or HA.
If you support a null hypothesis, it means you’re not supporting the alternative hypothesis. Similarly, if you reject a null hypothesis, it means you are recommending the alternative hypothesis.
Example: In an automobile trial, you feel that the new vehicle’s mileage is better than the previous model of the vehicle. You can write it as; Ha: the two vehicles have different mileage. On average/ the fuel consumption of the new vehicle model is better than the previous model.
If a null hypothesis is rejected during the hypothesis test, even if it’s true, then it is considered as a type-I error. On the other hand, if you don’t dismiss a hypothesis, even if it’s false because you could not identify its falseness, it’s considered a type-II error.
Hire an Expert Researcher
Orders completed by our expert writers are
- Formally drafted in academic style
- 100% Plagiarism free & 100% Confidential
- Never resold
- Include unlimited free revisions
- Completed to match exact client requirements

How to Conduct Hypothesis Testing?
Here is a step-by-step guide on how to conduct hypothesis testing.
Step 1: State the Null and Alternative Hypothesis
Once you develop a research hypothesis, it’s important to state it is as a Null hypothesis (Ho) and an Alternative hypothesis (Ha) to test it statistically.
A null hypothesis is a preferred choice as it provides the opportunity to test the theory. In contrast, you can accept the alternative hypothesis when the null hypothesis has been rejected.
Example: You want to identify a relationship between obesity of men and women and the modern living style. You develop a hypothesis that women, on average, gain weight quickly compared to men. Then you write it as: Ho: Women, on average, don’t gain weight quickly compared to men. Ha: Women, on average, gain weight quickly compared to men.
Step 2: Data Collection
Hypothesis testing follows the statistical method, and statistics are all about data. It’s challenging to gather complete information about a specific population you want to study. You need to gather the data obtained through a large number of samples from a specific population.
Example: Suppose you want to test the difference in the rate of obesity between men and women. You should include an equal number of men and women in your sample. Then investigate various aspects such as their lifestyle, eating patterns and profession, and any other variables that may influence average weight. You should also determine your study’s scope, whether it applies to a specific group of population or worldwide population. You can use available information from various places, countries, and regions.
Step 3: Select Appropriate Statistical Test
There are many types of statistical tests , but we discuss the most two common types below, such as One-sided and two-sided tests.
Note: Your choice of the type of test depends on the purpose of your study
One-sided Test
In the one-sided test, the values of rejecting a null hypothesis are located in one tail of the probability distribution. The set of values is less or higher than the critical value of the test. It is also called a one-tailed test of significance.
Example: If you want to test that all mangoes in a basket are ripe. You can write it as: Ho: All mangoes in the basket, on average, are ripe. If you find all ripe mangoes in the basket, the null hypothesis you developed will be true.
Two-sided Test
In the two-sided test, the values of rejecting a null hypothesis are located on both tails of the probability distribution. The set of values is less or higher than the first critical value of the test and higher than the second critical value test. It is also called a two-tailed test of significance.
Example: Nothing can be explicitly said whether all mangoes are ripe in the basket. If you reject the null hypothesis (Ho: All mangoes in the basket, on average, are ripe), then it means all mangoes in the basket are not likely to be ripe. A few mangoes could be raw as well.
Get statistical analysis help at an affordable price
- An expert statistician will complete your work
- Rigorous quality checks
- Confidentiality and reliability
- Any statistical software of your choice
- Free Plagiarism Report

Step 4: Select the Level of Significance
When you reject a null hypothesis, even if it’s true during a statistical hypothesis, it is considered the significance level . It is the probability of a type one error. The significance should be as minimum as possible to avoid the type-I error, which is considered severe and should be avoided.
If the significance level is minimum, then it prevents the researchers from false claims.
The significance level is denoted by P, and it has given the value of 0.05 (P=0.05)
If the P-Value is less than 0.05, then the difference will be significant. If the P-value is higher than 0.05, then the difference is non-significant.
Example: Suppose you apply a one-sided test to test whether women gain weight quickly compared to men. You get to know about the average weight between men and women and the factors promoting weight gain.
Step 5: Find out Whether the Null Hypothesis is Rejected or Supported
After conducting a statistical test, you should identify whether your null hypothesis is rejected or accepted based on the test results. It would help if you observed the P-value for this.
Example: If you find the P-value of your test is less than 0.5/5%, then you need to reject your null hypothesis (Ho: Women, on average, don’t gain weight quickly compared to men). On the other hand, if a null hypothesis is rejected, then it means the alternative hypothesis might be true (Ha: Women, on average, gain weight quickly compared to men. If you find your test’s P-value is above 0.5/5%, then it means your null hypothesis is true.
Step 6: Present the Outcomes of your Study
The final step is to present the outcomes of your study . You need to ensure whether you have met the objectives of your research or not.
In the discussion section and conclusion , you can present your findings by using supporting evidence and conclude whether your null hypothesis was rejected or supported.
In the result section, you can summarise your study’s outcomes, including the average difference and P-value of the two groups.
If we talk about the findings, our study your results will be as follows:
Example: In the study of identifying whether women gain weight quickly compared to men, we found the P-value is less than 0.5. Hence, we can reject the null hypothesis (Ho: Women, on average, don’t gain weight quickly than men) and conclude that women may likely gain weight quickly than men.
Did you know in your academic paper you should not mention whether you have accepted or rejected the null hypothesis?
Always remember that you either conclude to reject Ho in favor of Haor do not reject Ho . It would help if you never rejected Ha or even accept Ha .
Suppose your null hypothesis is rejected in the hypothesis testing. If you conclude reject Ho in favor of Haor do not reject Ho, then it doesn’t mean that the null hypothesis is true. It only means that there is a lack of evidence against Ho in favour of Ha. If your null hypothesis is not true, then the alternative hypothesis is likely to be true.
Example: We found that the P-value is less than 0.5. Hence, we can conclude reject Ho in favour of Ha (Ho: Women, on average, don’t gain weight quickly than men) reject Ho in favour of Ha. However, rejected in favour of Ha means (Ha: women may likely to gain weight quickly than men)
Frequently Asked Questions
What are the 3 types of hypothesis test.
The 3 types of hypothesis tests are:
- One-Sample Test : Compare sample data to a known population value.
- Two-Sample Test : Compare means between two sample groups.
- ANOVA : Analyze variance among multiple groups to determine significant differences.
What is a hypothesis?
A hypothesis is a proposed explanation or prediction about a phenomenon, often based on observations. It serves as a starting point for research or experimentation, providing a testable statement that can either be supported or refuted through data and analysis. In essence, it’s an educated guess that drives scientific inquiry.
What are null hypothesis?
A null hypothesis (often denoted as H0) suggests that there is no effect or difference in a study or experiment. It represents a default position or status quo. Statistical tests evaluate data to determine if there’s enough evidence to reject this null hypothesis.
What is the probability value?
The probability value, or p-value, is a measure used in statistics to determine the significance of an observed effect. It indicates the probability of obtaining the observed results, or more extreme, if the null hypothesis were true. A small p-value (typically <0.05) suggests evidence against the null hypothesis, warranting its rejection.
What is p value?
The p-value is a fundamental concept in statistical hypothesis testing. It represents the probability of observing a test statistic as extreme, or more so, than the one calculated from sample data, assuming the null hypothesis is true. A low p-value suggests evidence against the null, possibly justifying its rejection.
What is a t test?
A t-test is a statistical test used to compare the means of two groups. It determines if observed differences between the groups are statistically significant or if they likely occurred by chance. Commonly applied in research, there are different t-tests, including independent, paired, and one-sample, tailored to various data scenarios.
When to reject null hypothesis?
Reject the null hypothesis when the test statistic falls into a predefined rejection region or when the p-value is less than the chosen significance level (commonly 0.05). This suggests that the observed data is unlikely under the null hypothesis, indicating evidence for the alternative hypothesis. Always consider the study’s context.
You May Also Like
Thematic analysis is commonly used for qualitative data. Researchers give preference to thematic analysis when analysing audio or video transcripts.
Ethnography is a type of research where a researcher observes the people in their natural environment. Here is all you need to know about ethnography.
In historical research, a researcher collects and analyse the data, and explain the events that occurred in the past to test the truthfulness of observations.
USEFUL LINKS
LEARNING RESOURCES

COMPANY DETAILS

- How It Works

User Preferences
Content preview.
Arcu felis bibendum ut tristique et egestas quis:
- Ut enim ad minim veniam, quis nostrud exercitation ullamco laboris
- Duis aute irure dolor in reprehenderit in voluptate
- Excepteur sint occaecat cupidatat non proident
Keyboard Shortcuts
S.3 hypothesis testing.
In reviewing hypothesis tests, we start first with the general idea. Then, we keep returning to the basic procedures of hypothesis testing, each time adding a little more detail.
The general idea of hypothesis testing involves:
- Making an initial assumption.
- Collecting evidence (data).
- Based on the available evidence (data), deciding whether to reject or not reject the initial assumption.
Every hypothesis test — regardless of the population parameter involved — requires the above three steps.
Example S.3.1
Is normal body temperature really 98.6 degrees f section .
Consider the population of many, many adults. A researcher hypothesized that the average adult body temperature is lower than the often-advertised 98.6 degrees F. That is, the researcher wants an answer to the question: "Is the average adult body temperature 98.6 degrees? Or is it lower?" To answer his research question, the researcher starts by assuming that the average adult body temperature was 98.6 degrees F.
Then, the researcher went out and tried to find evidence that refutes his initial assumption. In doing so, he selects a random sample of 130 adults. The average body temperature of the 130 sampled adults is 98.25 degrees.
Then, the researcher uses the data he collected to make a decision about his initial assumption. It is either likely or unlikely that the researcher would collect the evidence he did given his initial assumption that the average adult body temperature is 98.6 degrees:
- If it is likely , then the researcher does not reject his initial assumption that the average adult body temperature is 98.6 degrees. There is not enough evidence to do otherwise.
- either the researcher's initial assumption is correct and he experienced a very unusual event;
- or the researcher's initial assumption is incorrect.
In statistics, we generally don't make claims that require us to believe that a very unusual event happened. That is, in the practice of statistics, if the evidence (data) we collected is unlikely in light of the initial assumption, then we reject our initial assumption.
Example S.3.2
Criminal trial analogy section .
One place where you can consistently see the general idea of hypothesis testing in action is in criminal trials held in the United States. Our criminal justice system assumes "the defendant is innocent until proven guilty." That is, our initial assumption is that the defendant is innocent.
In the practice of statistics, we make our initial assumption when we state our two competing hypotheses -- the null hypothesis ( H 0 ) and the alternative hypothesis ( H A ). Here, our hypotheses are:
- H 0 : Defendant is not guilty (innocent)
- H A : Defendant is guilty
In statistics, we always assume the null hypothesis is true . That is, the null hypothesis is always our initial assumption.
The prosecution team then collects evidence — such as finger prints, blood spots, hair samples, carpet fibers, shoe prints, ransom notes, and handwriting samples — with the hopes of finding "sufficient evidence" to make the assumption of innocence refutable.
In statistics, the data are the evidence.
The jury then makes a decision based on the available evidence:
- If the jury finds sufficient evidence — beyond a reasonable doubt — to make the assumption of innocence refutable, the jury rejects the null hypothesis and deems the defendant guilty. We behave as if the defendant is guilty.
- If there is insufficient evidence, then the jury does not reject the null hypothesis . We behave as if the defendant is innocent.
In statistics, we always make one of two decisions. We either "reject the null hypothesis" or we "fail to reject the null hypothesis."
Errors in Hypothesis Testing Section
Did you notice the use of the phrase "behave as if" in the previous discussion? We "behave as if" the defendant is guilty; we do not "prove" that the defendant is guilty. And, we "behave as if" the defendant is innocent; we do not "prove" that the defendant is innocent.
This is a very important distinction! We make our decision based on evidence not on 100% guaranteed proof. Again:
- If we reject the null hypothesis, we do not prove that the alternative hypothesis is true.
- If we do not reject the null hypothesis, we do not prove that the null hypothesis is true.
We merely state that there is enough evidence to behave one way or the other. This is always true in statistics! Because of this, whatever the decision, there is always a chance that we made an error .
Let's review the two types of errors that can be made in criminal trials:
Table S.3.2 shows how this corresponds to the two types of errors in hypothesis testing.
Note that, in statistics, we call the two types of errors by two different names -- one is called a "Type I error," and the other is called a "Type II error." Here are the formal definitions of the two types of errors:
There is always a chance of making one of these errors. But, a good scientific study will minimize the chance of doing so!
Making the Decision Section
Recall that it is either likely or unlikely that we would observe the evidence we did given our initial assumption. If it is likely , we do not reject the null hypothesis. If it is unlikely , then we reject the null hypothesis in favor of the alternative hypothesis. Effectively, then, making the decision reduces to determining "likely" or "unlikely."
In statistics, there are two ways to determine whether the evidence is likely or unlikely given the initial assumption:
- We could take the " critical value approach " (favored in many of the older textbooks).
- Or, we could take the " P -value approach " (what is used most often in research, journal articles, and statistical software).
In the next two sections, we review the procedures behind each of these two approaches. To make our review concrete, let's imagine that μ is the average grade point average of all American students who major in mathematics. We first review the critical value approach for conducting each of the following three hypothesis tests about the population mean $\mu$:
In Practice
- We would want to conduct the first hypothesis test if we were interested in concluding that the average grade point average of the group is more than 3.
- We would want to conduct the second hypothesis test if we were interested in concluding that the average grade point average of the group is less than 3.
- And, we would want to conduct the third hypothesis test if we were only interested in concluding that the average grade point average of the group differs from 3 (without caring whether it is more or less than 3).
Upon completing the review of the critical value approach, we review the P -value approach for conducting each of the above three hypothesis tests about the population mean \(\mu\). The procedures that we review here for both approaches easily extend to hypothesis tests about any other population parameter.
- Search Search Please fill out this field.
- Fundamental Analysis
Hypothesis to Be Tested: Definition and 4 Steps for Testing with Example
:max_bytes(150000):strip_icc():format(webp)/ChristinaMajaski-5c9433ea46e0fb0001d880b1.jpeg "hypothesis testing for research")
What Is Hypothesis Testing?
Hypothesis testing, sometimes called significance testing, is an act in statistics whereby an analyst tests an assumption regarding a population parameter. The methodology employed by the analyst depends on the nature of the data used and the reason for the analysis.
Hypothesis testing is used to assess the plausibility of a hypothesis by using sample data. Such data may come from a larger population, or from a data-generating process. The word "population" will be used for both of these cases in the following descriptions.
Key Takeaways
- Hypothesis testing is used to assess the plausibility of a hypothesis by using sample data.
- The test provides evidence concerning the plausibility of the hypothesis, given the data.
- Statistical analysts test a hypothesis by measuring and examining a random sample of the population being analyzed.
- The four steps of hypothesis testing include stating the hypotheses, formulating an analysis plan, analyzing the sample data, and analyzing the result.
How Hypothesis Testing Works
In hypothesis testing, an analyst tests a statistical sample, with the goal of providing evidence on the plausibility of the null hypothesis.
Statistical analysts test a hypothesis by measuring and examining a random sample of the population being analyzed. All analysts use a random population sample to test two different hypotheses: the null hypothesis and the alternative hypothesis.
The null hypothesis is usually a hypothesis of equality between population parameters; e.g., a null hypothesis may state that the population mean return is equal to zero. The alternative hypothesis is effectively the opposite of a null hypothesis (e.g., the population mean return is not equal to zero). Thus, they are mutually exclusive , and only one can be true. However, one of the two hypotheses will always be true.
The null hypothesis is a statement about a population parameter, such as the population mean, that is assumed to be true.
4 Steps of Hypothesis Testing
All hypotheses are tested using a four-step process:
- The first step is for the analyst to state the hypotheses.
- The second step is to formulate an analysis plan, which outlines how the data will be evaluated.
- The third step is to carry out the plan and analyze the sample data.
- The final step is to analyze the results and either reject the null hypothesis, or state that the null hypothesis is plausible, given the data.
Real-World Example of Hypothesis Testing
If, for example, a person wants to test that a penny has exactly a 50% chance of landing on heads, the null hypothesis would be that 50% is correct, and the alternative hypothesis would be that 50% is not correct.
Mathematically, the null hypothesis would be represented as Ho: P = 0.5. The alternative hypothesis would be denoted as "Ha" and be identical to the null hypothesis, except with the equal sign struck-through, meaning that it does not equal 50%.
A random sample of 100 coin flips is taken, and the null hypothesis is then tested. If it is found that the 100 coin flips were distributed as 40 heads and 60 tails, the analyst would assume that a penny does not have a 50% chance of landing on heads and would reject the null hypothesis and accept the alternative hypothesis.
If, on the other hand, there were 48 heads and 52 tails, then it is plausible that the coin could be fair and still produce such a result. In cases such as this where the null hypothesis is "accepted," the analyst states that the difference between the expected results (50 heads and 50 tails) and the observed results (48 heads and 52 tails) is "explainable by chance alone."
Some staticians attribute the first hypothesis tests to satirical writer John Arbuthnot in 1710, who studied male and female births in England after observing that in nearly every year, male births exceeded female births by a slight proportion. Arbuthnot calculated that the probability of this happening by chance was small, and therefore it was due to “divine providence.”
What is Hypothesis Testing?
Hypothesis testing refers to a process used by analysts to assess the plausibility of a hypothesis by using sample data. In hypothesis testing, statisticians formulate two hypotheses: the null hypothesis and the alternative hypothesis. A null hypothesis determines there is no difference between two groups or conditions, while the alternative hypothesis determines that there is a difference. Researchers evaluate the statistical significance of the test based on the probability that the null hypothesis is true.
What are the Four Key Steps Involved in Hypothesis Testing?
Hypothesis testing begins with an analyst stating two hypotheses, with only one that can be right. The analyst then formulates an analysis plan, which outlines how the data will be evaluated. Next, they move to the testing phase and analyze the sample data. Finally, the analyst analyzes the results and either rejects the null hypothesis or states that the null hypothesis is plausible, given the data.
What are the Benefits of Hypothesis Testing?
Hypothesis testing helps assess the accuracy of new ideas or theories by testing them against data. This allows researchers to determine whether the evidence supports their hypothesis, helping to avoid false claims and conclusions. Hypothesis testing also provides a framework for decision-making based on data rather than personal opinions or biases. By relying on statistical analysis, hypothesis testing helps to reduce the effects of chance and confounding variables, providing a robust framework for making informed conclusions.
What are the Limitations of Hypothesis Testing?
Hypothesis testing relies exclusively on data and doesn’t provide a comprehensive understanding of the subject being studied. Additionally, the accuracy of the results depends on the quality of the available data and the statistical methods used. Inaccurate data or inappropriate hypothesis formulation may lead to incorrect conclusions or failed tests. Hypothesis testing can also lead to errors, such as analysts either accepting or rejecting a null hypothesis when they shouldn’t have. These errors may result in false conclusions or missed opportunities to identify significant patterns or relationships in the data.
The Bottom Line
Hypothesis testing refers to a statistical process that helps researchers and/or analysts determine the reliability of a study. By using a well-formulated hypothesis and set of statistical tests, individuals or businesses can make inferences about the population that they are studying and draw conclusions based on the data presented. There are different types of hypothesis testing, each with their own set of rules and procedures. However, all hypothesis testing methods have the same four step process, which includes stating the hypotheses, formulating an analysis plan, analyzing the sample data, and analyzing the result. Hypothesis testing plays a vital part of the scientific process, helping to test assumptions and make better data-based decisions.
Sage. " Introduction to Hypothesis Testing. " Page 4.
Elder Research. " Who Invented the Null Hypothesis? "
Formplus. " Hypothesis Testing: Definition, Uses, Limitations and Examples. "
:max_bytes(150000):strip_icc():format(webp)/z-test.asp-final-81378e9e20704163ba30aad511c16e5d.jpg "hypothesis testing for research")
- Terms of Service
- Editorial Policy
- Privacy Policy
- Your Privacy Choices

Statistics Made Easy
Introduction to Hypothesis Testing
A statistical hypothesis is an assumption about a population parameter .
For example, we may assume that the mean height of a male in the U.S. is 70 inches.
The assumption about the height is the statistical hypothesis and the true mean height of a male in the U.S. is the population parameter .
A hypothesis test is a formal statistical test we use to reject or fail to reject a statistical hypothesis.
The Two Types of Statistical Hypotheses
To test whether a statistical hypothesis about a population parameter is true, we obtain a random sample from the population and perform a hypothesis test on the sample data.
There are two types of statistical hypotheses:
The null hypothesis , denoted as H 0 , is the hypothesis that the sample data occurs purely from chance.
The alternative hypothesis , denoted as H 1 or H a , is the hypothesis that the sample data is influenced by some non-random cause.
Hypothesis Tests
A hypothesis test consists of five steps:
1. State the hypotheses.
State the null and alternative hypotheses. These two hypotheses need to be mutually exclusive, so if one is true then the other must be false.
2. Determine a significance level to use for the hypothesis.
Decide on a significance level. Common choices are .01, .05, and .1.
3. Find the test statistic.
Find the test statistic and the corresponding p-value. Often we are analyzing a population mean or proportion and the general formula to find the test statistic is: (sample statistic – population parameter) / (standard deviation of statistic)
4. Reject or fail to reject the null hypothesis.
Using the test statistic or the p-value, determine if you can reject or fail to reject the null hypothesis based on the significance level.
The p-value tells us the strength of evidence in support of a null hypothesis. If the p-value is less than the significance level, we reject the null hypothesis.
5. Interpret the results.
Interpret the results of the hypothesis test in the context of the question being asked.
The Two Types of Decision Errors
There are two types of decision errors that one can make when doing a hypothesis test:
Type I error: You reject the null hypothesis when it is actually true. The probability of committing a Type I error is equal to the significance level, often called alpha , and denoted as α.
Type II error: You fail to reject the null hypothesis when it is actually false. The probability of committing a Type II error is called the Power of the test or Beta , denoted as β.
One-Tailed and Two-Tailed Tests
A statistical hypothesis can be one-tailed or two-tailed.
A one-tailed hypothesis involves making a “greater than” or “less than ” statement.
For example, suppose we assume the mean height of a male in the U.S. is greater than or equal to 70 inches. The null hypothesis would be H0: µ ≥ 70 inches and the alternative hypothesis would be Ha: µ < 70 inches.
A two-tailed hypothesis involves making an “equal to” or “not equal to” statement.
For example, suppose we assume the mean height of a male in the U.S. is equal to 70 inches. The null hypothesis would be H0: µ = 70 inches and the alternative hypothesis would be Ha: µ ≠ 70 inches.
Note: The “equal” sign is always included in the null hypothesis, whether it is =, ≥, or ≤.
Related: What is a Directional Hypothesis?
Types of Hypothesis Tests
There are many different types of hypothesis tests you can perform depending on the type of data you’re working with and the goal of your analysis.
The following tutorials provide an explanation of the most common types of hypothesis tests:
Introduction to the One Sample t-test Introduction to the Two Sample t-test Introduction to the Paired Samples t-test Introduction to the One Proportion Z-Test Introduction to the Two Proportion Z-Test

Published by Zach
Leave a reply cancel reply.
Your email address will not be published. Required fields are marked *
- Resources Home 🏠
- Try SciSpace Copilot
- Search research papers
- Add Copilot Extension
- Try AI Detector
- Try Paraphraser
- Try Citation Generator
- April Papers
- June Papers
- July Papers

The Craft of Writing a Strong Hypothesis

Table of Contents
Writing a hypothesis is one of the essential elements of a scientific research paper. It needs to be to the point, clearly communicating what your research is trying to accomplish. A blurry, drawn-out, or complexly-structured hypothesis can confuse your readers. Or worse, the editor and peer reviewers.
A captivating hypothesis is not too intricate. This blog will take you through the process so that, by the end of it, you have a better idea of how to convey your research paper's intent in just one sentence.
What is a Hypothesis?
The first step in your scientific endeavor, a hypothesis, is a strong, concise statement that forms the basis of your research. It is not the same as a thesis statement , which is a brief summary of your research paper .
The sole purpose of a hypothesis is to predict your paper's findings, data, and conclusion. It comes from a place of curiosity and intuition . When you write a hypothesis, you're essentially making an educated guess based on scientific prejudices and evidence, which is further proven or disproven through the scientific method.
The reason for undertaking research is to observe a specific phenomenon. A hypothesis, therefore, lays out what the said phenomenon is. And it does so through two variables, an independent and dependent variable.
The independent variable is the cause behind the observation, while the dependent variable is the effect of the cause. A good example of this is “mixing red and blue forms purple.” In this hypothesis, mixing red and blue is the independent variable as you're combining the two colors at your own will. The formation of purple is the dependent variable as, in this case, it is conditional to the independent variable.
Different Types of Hypotheses

Types of hypotheses
Some would stand by the notion that there are only two types of hypotheses: a Null hypothesis and an Alternative hypothesis. While that may have some truth to it, it would be better to fully distinguish the most common forms as these terms come up so often, which might leave you out of context.
Apart from Null and Alternative, there are Complex, Simple, Directional, Non-Directional, Statistical, and Associative and casual hypotheses. They don't necessarily have to be exclusive, as one hypothesis can tick many boxes, but knowing the distinctions between them will make it easier for you to construct your own.
1. Null hypothesis
A null hypothesis proposes no relationship between two variables. Denoted by H 0 , it is a negative statement like “Attending physiotherapy sessions does not affect athletes' on-field performance.” Here, the author claims physiotherapy sessions have no effect on on-field performances. Even if there is, it's only a coincidence.
2. Alternative hypothesis
Considered to be the opposite of a null hypothesis, an alternative hypothesis is donated as H1 or Ha. It explicitly states that the dependent variable affects the independent variable. A good alternative hypothesis example is “Attending physiotherapy sessions improves athletes' on-field performance.” or “Water evaporates at 100 °C. ” The alternative hypothesis further branches into directional and non-directional.
- Directional hypothesis: A hypothesis that states the result would be either positive or negative is called directional hypothesis. It accompanies H1 with either the ‘<' or ‘>' sign.
- Non-directional hypothesis: A non-directional hypothesis only claims an effect on the dependent variable. It does not clarify whether the result would be positive or negative. The sign for a non-directional hypothesis is ‘≠.'
3. Simple hypothesis
A simple hypothesis is a statement made to reflect the relation between exactly two variables. One independent and one dependent. Consider the example, “Smoking is a prominent cause of lung cancer." The dependent variable, lung cancer, is dependent on the independent variable, smoking.
4. Complex hypothesis
In contrast to a simple hypothesis, a complex hypothesis implies the relationship between multiple independent and dependent variables. For instance, “Individuals who eat more fruits tend to have higher immunity, lesser cholesterol, and high metabolism.” The independent variable is eating more fruits, while the dependent variables are higher immunity, lesser cholesterol, and high metabolism.
5. Associative and casual hypothesis
Associative and casual hypotheses don't exhibit how many variables there will be. They define the relationship between the variables. In an associative hypothesis, changing any one variable, dependent or independent, affects others. In a casual hypothesis, the independent variable directly affects the dependent.
6. Empirical hypothesis
Also referred to as the working hypothesis, an empirical hypothesis claims a theory's validation via experiments and observation. This way, the statement appears justifiable and different from a wild guess.
Say, the hypothesis is “Women who take iron tablets face a lesser risk of anemia than those who take vitamin B12.” This is an example of an empirical hypothesis where the researcher the statement after assessing a group of women who take iron tablets and charting the findings.
7. Statistical hypothesis
The point of a statistical hypothesis is to test an already existing hypothesis by studying a population sample. Hypothesis like “44% of the Indian population belong in the age group of 22-27.” leverage evidence to prove or disprove a particular statement.
Characteristics of a Good Hypothesis
Writing a hypothesis is essential as it can make or break your research for you. That includes your chances of getting published in a journal. So when you're designing one, keep an eye out for these pointers:
- A research hypothesis has to be simple yet clear to look justifiable enough.
- It has to be testable — your research would be rendered pointless if too far-fetched into reality or limited by technology.
- It has to be precise about the results —what you are trying to do and achieve through it should come out in your hypothesis.
- A research hypothesis should be self-explanatory, leaving no doubt in the reader's mind.
- If you are developing a relational hypothesis, you need to include the variables and establish an appropriate relationship among them.
- A hypothesis must keep and reflect the scope for further investigations and experiments.
Separating a Hypothesis from a Prediction
Outside of academia, hypothesis and prediction are often used interchangeably. In research writing, this is not only confusing but also incorrect. And although a hypothesis and prediction are guesses at their core, there are many differences between them.
A hypothesis is an educated guess or even a testable prediction validated through research. It aims to analyze the gathered evidence and facts to define a relationship between variables and put forth a logical explanation behind the nature of events.
Predictions are assumptions or expected outcomes made without any backing evidence. They are more fictionally inclined regardless of where they originate from.
For this reason, a hypothesis holds much more weight than a prediction. It sticks to the scientific method rather than pure guesswork. "Planets revolve around the Sun." is an example of a hypothesis as it is previous knowledge and observed trends. Additionally, we can test it through the scientific method.
Whereas "COVID-19 will be eradicated by 2030." is a prediction. Even though it results from past trends, we can't prove or disprove it. So, the only way this gets validated is to wait and watch if COVID-19 cases end by 2030.
Finally, How to Write a Hypothesis

Quick tips on writing a hypothesis
1. Be clear about your research question
A hypothesis should instantly address the research question or the problem statement. To do so, you need to ask a question. Understand the constraints of your undertaken research topic and then formulate a simple and topic-centric problem. Only after that can you develop a hypothesis and further test for evidence.
2. Carry out a recce
Once you have your research's foundation laid out, it would be best to conduct preliminary research. Go through previous theories, academic papers, data, and experiments before you start curating your research hypothesis. It will give you an idea of your hypothesis's viability or originality.
Making use of references from relevant research papers helps draft a good research hypothesis. SciSpace Discover offers a repository of over 270 million research papers to browse through and gain a deeper understanding of related studies on a particular topic. Additionally, you can use SciSpace Copilot , your AI research assistant, for reading any lengthy research paper and getting a more summarized context of it. A hypothesis can be formed after evaluating many such summarized research papers. Copilot also offers explanations for theories and equations, explains paper in simplified version, allows you to highlight any text in the paper or clip math equations and tables and provides a deeper, clear understanding of what is being said. This can improve the hypothesis by helping you identify potential research gaps.
3. Create a 3-dimensional hypothesis
Variables are an essential part of any reasonable hypothesis. So, identify your independent and dependent variable(s) and form a correlation between them. The ideal way to do this is to write the hypothetical assumption in the ‘if-then' form. If you use this form, make sure that you state the predefined relationship between the variables.
In another way, you can choose to present your hypothesis as a comparison between two variables. Here, you must specify the difference you expect to observe in the results.
4. Write the first draft
Now that everything is in place, it's time to write your hypothesis. For starters, create the first draft. In this version, write what you expect to find from your research.
Clearly separate your independent and dependent variables and the link between them. Don't fixate on syntax at this stage. The goal is to ensure your hypothesis addresses the issue.
5. Proof your hypothesis
After preparing the first draft of your hypothesis, you need to inspect it thoroughly. It should tick all the boxes, like being concise, straightforward, relevant, and accurate. Your final hypothesis has to be well-structured as well.
Research projects are an exciting and crucial part of being a scholar. And once you have your research question, you need a great hypothesis to begin conducting research. Thus, knowing how to write a hypothesis is very important.
Now that you have a firmer grasp on what a good hypothesis constitutes, the different kinds there are, and what process to follow, you will find it much easier to write your hypothesis, which ultimately helps your research.
Now it's easier than ever to streamline your research workflow with SciSpace Discover . Its integrated, comprehensive end-to-end platform for research allows scholars to easily discover, write and publish their research and fosters collaboration.
It includes everything you need, including a repository of over 270 million research papers across disciplines, SEO-optimized summaries and public profiles to show your expertise and experience.
If you found these tips on writing a research hypothesis useful, head over to our blog on Statistical Hypothesis Testing to learn about the top researchers, papers, and institutions in this domain.
Frequently Asked Questions (FAQs)
1. what is the definition of hypothesis.
According to the Oxford dictionary, a hypothesis is defined as “An idea or explanation of something that is based on a few known facts, but that has not yet been proved to be true or correct”.
2. What is an example of hypothesis?
The hypothesis is a statement that proposes a relationship between two or more variables. An example: "If we increase the number of new users who join our platform by 25%, then we will see an increase in revenue."
3. What is an example of null hypothesis?
A null hypothesis is a statement that there is no relationship between two variables. The null hypothesis is written as H0. The null hypothesis states that there is no effect. For example, if you're studying whether or not a particular type of exercise increases strength, your null hypothesis will be "there is no difference in strength between people who exercise and people who don't."
4. What are the types of research?
• Fundamental research
• Applied research
• Qualitative research
• Quantitative research
• Mixed research
• Exploratory research
• Longitudinal research
• Cross-sectional research
• Field research
• Laboratory research
• Fixed research
• Flexible research
• Action research
• Policy research
• Classification research
• Comparative research
• Causal research
• Inductive research
• Deductive research
5. How to write a hypothesis?
• Your hypothesis should be able to predict the relationship and outcome.
• Avoid wordiness by keeping it simple and brief.
• Your hypothesis should contain observable and testable outcomes.
• Your hypothesis should be relevant to the research question.
6. What are the 2 types of hypothesis?
• Null hypotheses are used to test the claim that "there is no difference between two groups of data".
• Alternative hypotheses test the claim that "there is a difference between two data groups".
7. Difference between research question and research hypothesis?
A research question is a broad, open-ended question you will try to answer through your research. A hypothesis is a statement based on prior research or theory that you expect to be true due to your study. Example - Research question: What are the factors that influence the adoption of the new technology? Research hypothesis: There is a positive relationship between age, education and income level with the adoption of the new technology.
8. What is plural for hypothesis?
The plural of hypothesis is hypotheses. Here's an example of how it would be used in a statement, "Numerous well-considered hypotheses are presented in this part, and they are supported by tables and figures that are well-illustrated."
9. What is the red queen hypothesis?
The red queen hypothesis in evolutionary biology states that species must constantly evolve to avoid extinction because if they don't, they will be outcompeted by other species that are evolving. Leigh Van Valen first proposed it in 1973; since then, it has been tested and substantiated many times.
10. Who is known as the father of null hypothesis?
The father of the null hypothesis is Sir Ronald Fisher. He published a paper in 1925 that introduced the concept of null hypothesis testing, and he was also the first to use the term itself.
11. When to reject null hypothesis?
You need to find a significant difference between your two populations to reject the null hypothesis. You can determine that by running statistical tests such as an independent sample t-test or a dependent sample t-test. You should reject the null hypothesis if the p-value is less than 0.05.
You might also like

Consensus GPT vs. SciSpace GPT: Choose the Best GPT for Research

Literature Review and Theoretical Framework: Understanding the Differences

Types of Essays in Academic Writing - Quick Guide (2024)
Hypothesis testing
When interpreting research findings, researchers need to assess whether these findings may have occurred by chance. Hypothesis testing is a systematic procedure for deciding whether the results of a research study support a particular theory which applies to a population.
Hypothesis testing uses sample data to evaluate a hypothesis about a population . A hypothesis test assesses how unusual the result is, whether it is reasonable chance variation or whether the result is too extreme to be considered chance variation.
Basic concepts
- Null and research hypothesis
Probability value and types of errors
Effect size and statistical significance.
- Directional and non-directional hypotheses
Null and research hypotheses
To carry out statistical hypothesis testing, research and null hypothesis are employed:
- Research hypothesis : this is the hypothesis that you propose, also known as the alternative hypothesis HA. For example:
H A: There is a relationship between intelligence and academic results.
H A: First year university students obtain higher grades after an intensive Statistics course.
H A; Males and females differ in their levels of stress.
- The null hypothesis (H o ) is the opposite of the research hypothesis and expresses that there is no relationship between variables, or no differences between groups; for example:
H o : There is no relationship between intelligence and academic results.
H o: First year university students do not obtain higher grades after an intensive Statistics course.
H o : Males and females will not differ in their levels of stress.
The purpose of hypothesis testing is to test whether the null hypothesis (there is no difference, no effect) can be rejected or approved. If the null hypothesis is rejected, then the research hypothesis can be accepted. If the null hypothesis is accepted, then the research hypothesis is rejected.
In hypothesis testing, a value is set to assess whether the null hypothesis is accepted or rejected and whether the result is statistically significant:
- A critical value is the score the sample would need to decide against the null hypothesis.
- A probability value is used to assess the significance of the statistical test. If the null hypothesis is rejected, then the alternative to the null hypothesis is accepted.
The probability value, or p value , is the probability of an outcome or research result given the hypothesis. Usually, the probability value is set at 0.05: the null hypothesis will be rejected if the probability value of the statistical test is less than 0.05. There are two types of errors associated to hypothesis testing:
- What if we observe a difference – but none exists in the population?
- What if we do not find a difference – but it does exist in the population?
These situations are known as Type I and Type II errors:
- Type I Error: is the type of error that involves the rejection of a null hypothesis that is actually true (i.e. a false positive).
- Type II Error: is the type of error that occurs when we do not reject a null hypothesis that is false (i.e. a false negative).

These errors cannot be eliminated; they can be minimised, but minimising one type of error will increase the probability of committing the other type.
The probability of making a Type I error depends on the criterion that is used to accept or reject the null hypothesis: the p value or alpha level . The alpha is set by the researcher, usually at .05, and is the chance the researcher is willing to take and still claim the significance of the statistical test.). Choosing a smaller alpha level will decrease the likelihood of committing Type I error.
For example, p<0.05 indicates that there are 5 chances in 100 that the difference observed was really due to sampling error – that 5% of the time a Type I error will occur or that there is a 5% chance that the opposite of the null hypothesis is actually true.
With a p<0.01, there will be 1 chance in 100 that the difference observed was really due to sampling error – 1% of the time a Type I error will occur.
The p level is specified before analysing the data. If the data analysis results in a probability value below the α (alpha) level, then the null hypothesis is rejected; if it is not, then the null hypothesis is not rejected.
When the null hypothesis is rejected, the effect is said to be statistically significant. However, statistical significance does not mean that the effect is important.
A result can be statistically significant, but the effect size may be small. Finding that an effect is significant does not provide information about how large or important the effect is. In fact, a small effect can be statistically significant if the sample size is large enough.
Information about the effect size, or magnitude of the result, is given by the statistical test. For example, the strength of the correlation between two variables is given by the coefficient of correlation, which varies from 0 to 1.
- A hypothesis that states that students who attend an intensive Statistics course will obtain higher grades than students who do not attend would be directional.
- A non-directional hypothesis states that there will be differences between students who attend do or don’t attend an intensive Statistics course, but we don’t know what group will get higher grades than the other. The hypothesis only states that they will obtain different grades.
The hypothesis testing process
The hypothesis testing process can be divided into five steps:
- Restate the research question as research hypothesis and a null hypothesis about the populations.
- Determine the characteristics of the comparison distribution.
- Determine the cut off sample score on the comparison distribution at which the null hypothesis should be rejected.
- Determine your sample’s score on the comparison distribution.
- Decide whether to reject the null hypothesis.
This example illustrates how these five steps can be applied to text a hypothesis:
- Let’s say that you conduct an experiment to investigate whether students’ ability to memorise words improves after they have consumed caffeine.
- The experiment involves two groups of students: the first group consumes caffeine; the second group drinks water.
- Both groups complete a memory test.
- A randomly selected individual in the experimental condition (i.e. the group that consumes caffeine) has a score of 27 on the memory test. The scores of people in general on this memory measure are normally distributed with a mean of 19 and a standard deviation of 4.
- The researcher predicts an effect (differences in memory for these groups) but does not predict a particular direction of effect (i.e. which group will have higher scores on the memory test). Using the 5% significance level, what should you conclude?
Step 1 : There are two populations of interest.
Population 1: People who go through the experimental procedure (drink coffee).
Population 2: People who do not go through the experimental procedure (drink water).
- Research hypothesis: Population 1 will score differently from Population 2.
- Null hypothesis: There will be no difference between the two populations.
Step 2 : We know that the characteristics of the comparison distribution (student population) are:
Population M = 19, Population SD= 4, normally distributed. These are the mean and standard deviation of the distribution of scores on the memory test for the general student population.
Step 3 : For a two-tailed test (the direction of the effect is not specified) at the 5% level (25% at each tail), the cut off sample scores are +1.96 and -1.99.
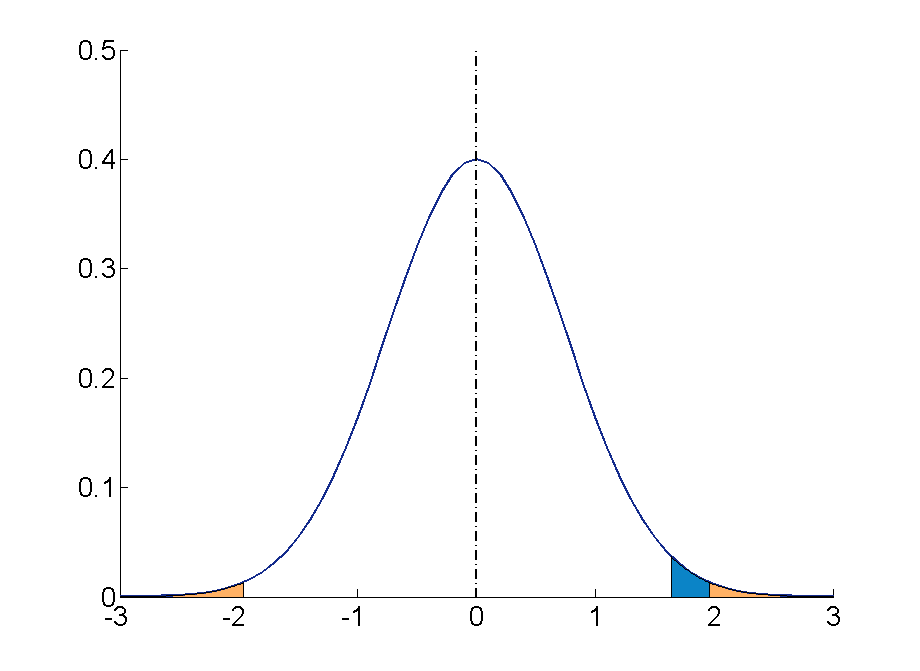
Step 4 : Your sample score of 27 needs to be converted into a Z value. To calculate Z = (27-19)/4= 2 ( check the Converting into Z scores section if you need to review how to do this process)
Step 5 : A ‘Z’ score of 2 is more extreme than the cut off Z of +1.96 (see figure above). The result is significant and, thus, the null hypothesis is rejected.
You can find more examples here:
- Statistics (RMIT Learning Lab)
Some commonly used statistical techniques
Correlation analysis, multiple regression.
- Analysis of variance
Chi-square test for independence
Correlation analysis explores the association between variables . The purpose of correlational analysis is to discover whether there is a relationship between variables, which is unlikely to occur by sampling error. The null hypothesis is that there is no relationship between the two variables. Correlation analysis provides information about:
- The direction of the relationship: positive or negative- given by the sign of the correlation coefficient.
- The strength or magnitude of the relationship between the two variables- given by the correlation coefficient, which varies from 0 (no relationship between the variables) to 1 (perfect relationship between the variables).
- Direction of the relationship.
A positive correlation indicates that high scores on one variable are associated with high scores on the other variable; low scores on one variable are associated with low scores on the second variable . For instance, in the figure below, higher scores on negative affect are associated with higher scores on perceived stress

A negative correlation indicates that high scores on one variable are associated with low scores on the other variable. The graph shows that a person who scores high on perceived stress will probably score low on mastery. The slope of the graph is downwards- as it moves to the right. In the figure below, higher scores on mastery are associated with lower scores on perceived stress.

Fig 2. Negative correlation between two variables. Adapted from Pallant, J. (2013). SPSS survival manual: A step by step guide to data analysis using IBM SPSS (5th ed.). Sydney, Melbourne, Auckland, London: Allen & Unwin
2. The strength or magnitude of the relationship
The strength of a linear relationship between two variables is measured by a statistic known as the correlation coefficient , which varies from 0 to -1, and from 0 to +1. There are several correlation coefficients; the most widely used are Pearson’s r and Spearman’s rho. The strength of the relationship is interpreted as follows:
- Small/weak: r= .10 to .29
- Medium/moderate: r= .30 to .49
- Large/strong: r= .50 to 1
It is important to note that correlation analysis does not imply causality. Correlation is used to explore the association between variables, however, it does not indicate that one variable causes the other. The correlation between two variables could be due to the fact that a third variable is affecting the two variables.
Multiple regression is an extension of correlation analysis. Multiple regression is used to explore the relationship between one dependent variable and a number of independent variables or predictors . The purpose of a multiple regression model is to predict values of a dependent variable based on the values of the independent variables or predictors. For example, a researcher may be interested in predicting students’ academic success (e.g. grades) based on a number of predictors, for example, hours spent studying, satisfaction with studies, relationships with peers and lecturers.
A multiple regression model can be conducted using statistical software (e.g. SPSS). The software will test the significance of the model (i.e. does the model significantly predicts scores on the dependent variable using the independent variables introduced in the model?), how much of the variance in the dependent variable is explained by the model, and the individual contribution of each independent variable.
Example of multiple regression model

From Dunn et al. (2014). Influence of academic self-regulation, critical thinking, and age on online graduate students' academic help-seeking.
In this model, help-seeking is the dependent variable; there are three independent variables or predictors. The coefficients show the direction (positive or negative) and magnitude of the relationship between each predictor and the dependent variable. The model was statistically significant and predicted 13.5% of the variance in help-seeking.
t-Tests are employed to compare the mean score on some continuous variable for two groups . The null hypothesis to be tested is there are no differences between the two groups (e.g. anxiety scores for males and females are not different).
If the significance value of the t-test is equal or less than .05, there is a significant difference in the mean scores on the variable of interest for each of the two groups. If the value is above .05, there is no significant difference between the groups.
t-Tests can be employed to compare the mean scores of two different groups (independent-samples t-test ) or to compare the same group of people on two different occasions ( paired-samples t-test) .
In addition to assessing whether the difference between the two groups is statistically significant, it is important to consider the effect size or magnitude of the difference between the groups. The effect size is given by partial eta squared (proportion of variance of the dependent variable that is explained by the independent variable) and Cohen’s d (difference between groups in terms of standard deviation units).
In this example, an independent samples t-test was conducted to assess whether males and females differ in their perceived anxiety levels. The significance of the test is .004. Since this value is less than .05, we can conclude that there is a statistically significant difference between males and females in their perceived anxiety levels.

Whilst t-tests compare the mean score on one variable for two groups, analysis of variance is used to test more than two groups . Following the previous example, analysis of variance would be employed to test whether there are differences in anxiety scores for students from different disciplines.
Analysis of variance compare the variance (variability in scores) between the different groups (believed to be due to the independent variable) with the variability within each group (believed to be due to chance). An F ratio is calculated; a large F ratio indicates that there is more variability between the groups (caused by the independent variable) than there is within each group (error term). A significant F test indicates that we can reject the null hypothesis; i.e. that there is no difference between the groups.
Again, effect size statistics such as Cohen’s d and eta squared are employed to assess the magnitude of the differences between groups.
In this example, we examined differences in perceived anxiety between students from different disciplines. The results of the Anova Test show that the significance level is .005. Since this value is below .05, we can conclude that there are statistically significant differences between students from different disciplines in their perceived anxiety levels.

Chi-square test for independence is used to explore the relationship between two categorical variables. Each variable can have two or more categories.
For example, a researcher can use a Chi-square test for independence to assess the relationship between study disciplines (e.g. Psychology, Business, Education,…) and help-seeking behaviour (Yes/No). The test compares the observed frequencies of cases with the values that would be expected if there was no association between the two variables of interest. A statistically significant Chi-square test indicates that the two variables are associated (e.g. Psychology students are more likely to seek help than Business students). The effect size is assessed using effect size statistics: Phi and Cramer’s V .
In this example, a Chi-square test was conducted to assess whether males and females differ in their help-seeking behaviour (Yes/No). The crosstabulation table shows the percentage of males of females who sought/didn't seek help. The table 'Chi square tests' shows the significance of the test (Pearson Chi square asymp sig: .482). Since this value is above .05, we conclude that there is no statistically significant difference between males and females in their help-seeking behaviour.

- << Previous: Probability and the normal distribution
- Next: Statistical techniques >>
Hypothesis Testing (cont...)
Hypothesis testing, the null and alternative hypothesis.
In order to undertake hypothesis testing you need to express your research hypothesis as a null and alternative hypothesis. The null hypothesis and alternative hypothesis are statements regarding the differences or effects that occur in the population. You will use your sample to test which statement (i.e., the null hypothesis or alternative hypothesis) is most likely (although technically, you test the evidence against the null hypothesis). So, with respect to our teaching example, the null and alternative hypothesis will reflect statements about all statistics students on graduate management courses.
The null hypothesis is essentially the "devil's advocate" position. That is, it assumes that whatever you are trying to prove did not happen ( hint: it usually states that something equals zero). For example, the two different teaching methods did not result in different exam performances (i.e., zero difference). Another example might be that there is no relationship between anxiety and athletic performance (i.e., the slope is zero). The alternative hypothesis states the opposite and is usually the hypothesis you are trying to prove (e.g., the two different teaching methods did result in different exam performances). Initially, you can state these hypotheses in more general terms (e.g., using terms like "effect", "relationship", etc.), as shown below for the teaching methods example:
Depending on how you want to "summarize" the exam performances will determine how you might want to write a more specific null and alternative hypothesis. For example, you could compare the mean exam performance of each group (i.e., the "seminar" group and the "lectures-only" group). This is what we will demonstrate here, but other options include comparing the distributions , medians , amongst other things. As such, we can state:
Now that you have identified the null and alternative hypotheses, you need to find evidence and develop a strategy for declaring your "support" for either the null or alternative hypothesis. We can do this using some statistical theory and some arbitrary cut-off points. Both these issues are dealt with next.
Significance levels
The level of statistical significance is often expressed as the so-called p -value . Depending on the statistical test you have chosen, you will calculate a probability (i.e., the p -value) of observing your sample results (or more extreme) given that the null hypothesis is true . Another way of phrasing this is to consider the probability that a difference in a mean score (or other statistic) could have arisen based on the assumption that there really is no difference. Let us consider this statement with respect to our example where we are interested in the difference in mean exam performance between two different teaching methods. If there really is no difference between the two teaching methods in the population (i.e., given that the null hypothesis is true), how likely would it be to see a difference in the mean exam performance between the two teaching methods as large as (or larger than) that which has been observed in your sample?
So, you might get a p -value such as 0.03 (i.e., p = .03). This means that there is a 3% chance of finding a difference as large as (or larger than) the one in your study given that the null hypothesis is true. However, you want to know whether this is "statistically significant". Typically, if there was a 5% or less chance (5 times in 100 or less) that the difference in the mean exam performance between the two teaching methods (or whatever statistic you are using) is as different as observed given the null hypothesis is true, you would reject the null hypothesis and accept the alternative hypothesis. Alternately, if the chance was greater than 5% (5 times in 100 or more), you would fail to reject the null hypothesis and would not accept the alternative hypothesis. As such, in this example where p = .03, we would reject the null hypothesis and accept the alternative hypothesis. We reject it because at a significance level of 0.03 (i.e., less than a 5% chance), the result we obtained could happen too frequently for us to be confident that it was the two teaching methods that had an effect on exam performance.
Whilst there is relatively little justification why a significance level of 0.05 is used rather than 0.01 or 0.10, for example, it is widely used in academic research. However, if you want to be particularly confident in your results, you can set a more stringent level of 0.01 (a 1% chance or less; 1 in 100 chance or less).

One- and two-tailed predictions
When considering whether we reject the null hypothesis and accept the alternative hypothesis, we need to consider the direction of the alternative hypothesis statement. For example, the alternative hypothesis that was stated earlier is:
The alternative hypothesis tells us two things. First, what predictions did we make about the effect of the independent variable(s) on the dependent variable(s)? Second, what was the predicted direction of this effect? Let's use our example to highlight these two points.
Sarah predicted that her teaching method (independent variable: teaching method), whereby she not only required her students to attend lectures, but also seminars, would have a positive effect (that is, increased) students' performance (dependent variable: exam marks). If an alternative hypothesis has a direction (and this is how you want to test it), the hypothesis is one-tailed. That is, it predicts direction of the effect. If the alternative hypothesis has stated that the effect was expected to be negative, this is also a one-tailed hypothesis.
Alternatively, a two-tailed prediction means that we do not make a choice over the direction that the effect of the experiment takes. Rather, it simply implies that the effect could be negative or positive. If Sarah had made a two-tailed prediction, the alternative hypothesis might have been:
In other words, we simply take out the word "positive", which implies the direction of our effect. In our example, making a two-tailed prediction may seem strange. After all, it would be logical to expect that "extra" tuition (going to seminar classes as well as lectures) would either have a positive effect on students' performance or no effect at all, but certainly not a negative effect. However, this is just our opinion (and hope) and certainly does not mean that we will get the effect we expect. Generally speaking, making a one-tail prediction (i.e., and testing for it this way) is frowned upon as it usually reflects the hope of a researcher rather than any certainty that it will happen. Notable exceptions to this rule are when there is only one possible way in which a change could occur. This can happen, for example, when biological activity/presence in measured. That is, a protein might be "dormant" and the stimulus you are using can only possibly "wake it up" (i.e., it cannot possibly reduce the activity of a "dormant" protein). In addition, for some statistical tests, one-tailed tests are not possible.
Rejecting or failing to reject the null hypothesis
Let's return finally to the question of whether we reject or fail to reject the null hypothesis.
If our statistical analysis shows that the significance level is below the cut-off value we have set (e.g., either 0.05 or 0.01), we reject the null hypothesis and accept the alternative hypothesis. Alternatively, if the significance level is above the cut-off value, we fail to reject the null hypothesis and cannot accept the alternative hypothesis. You should note that you cannot accept the null hypothesis, but only find evidence against it.
Research Hypothesis In Psychology: Types, & Examples
Saul Mcleod, PhD
Editor-in-Chief for Simply Psychology
BSc (Hons) Psychology, MRes, PhD, University of Manchester
Saul Mcleod, PhD., is a qualified psychology teacher with over 18 years of experience in further and higher education. He has been published in peer-reviewed journals, including the Journal of Clinical Psychology.
Learn about our Editorial Process
Olivia Guy-Evans, MSc
Associate Editor for Simply Psychology
BSc (Hons) Psychology, MSc Psychology of Education
Olivia Guy-Evans is a writer and associate editor for Simply Psychology. She has previously worked in healthcare and educational sectors.
On This Page:
A research hypothesis, in its plural form “hypotheses,” is a specific, testable prediction about the anticipated results of a study, established at its outset. It is a key component of the scientific method .
Hypotheses connect theory to data and guide the research process towards expanding scientific understanding
Some key points about hypotheses:
- A hypothesis expresses an expected pattern or relationship. It connects the variables under investigation.
- It is stated in clear, precise terms before any data collection or analysis occurs. This makes the hypothesis testable.
- A hypothesis must be falsifiable. It should be possible, even if unlikely in practice, to collect data that disconfirms rather than supports the hypothesis.
- Hypotheses guide research. Scientists design studies to explicitly evaluate hypotheses about how nature works.
- For a hypothesis to be valid, it must be testable against empirical evidence. The evidence can then confirm or disprove the testable predictions.
- Hypotheses are informed by background knowledge and observation, but go beyond what is already known to propose an explanation of how or why something occurs.
Predictions typically arise from a thorough knowledge of the research literature, curiosity about real-world problems or implications, and integrating this to advance theory. They build on existing literature while providing new insight.
Types of Research Hypotheses
Alternative hypothesis.
The research hypothesis is often called the alternative or experimental hypothesis in experimental research.
It typically suggests a potential relationship between two key variables: the independent variable, which the researcher manipulates, and the dependent variable, which is measured based on those changes.
The alternative hypothesis states a relationship exists between the two variables being studied (one variable affects the other).
A hypothesis is a testable statement or prediction about the relationship between two or more variables. It is a key component of the scientific method. Some key points about hypotheses:
- Important hypotheses lead to predictions that can be tested empirically. The evidence can then confirm or disprove the testable predictions.
In summary, a hypothesis is a precise, testable statement of what researchers expect to happen in a study and why. Hypotheses connect theory to data and guide the research process towards expanding scientific understanding.
An experimental hypothesis predicts what change(s) will occur in the dependent variable when the independent variable is manipulated.
It states that the results are not due to chance and are significant in supporting the theory being investigated.
The alternative hypothesis can be directional, indicating a specific direction of the effect, or non-directional, suggesting a difference without specifying its nature. It’s what researchers aim to support or demonstrate through their study.
Null Hypothesis
The null hypothesis states no relationship exists between the two variables being studied (one variable does not affect the other). There will be no changes in the dependent variable due to manipulating the independent variable.
It states results are due to chance and are not significant in supporting the idea being investigated.
The null hypothesis, positing no effect or relationship, is a foundational contrast to the research hypothesis in scientific inquiry. It establishes a baseline for statistical testing, promoting objectivity by initiating research from a neutral stance.
Many statistical methods are tailored to test the null hypothesis, determining the likelihood of observed results if no true effect exists.
This dual-hypothesis approach provides clarity, ensuring that research intentions are explicit, and fosters consistency across scientific studies, enhancing the standardization and interpretability of research outcomes.
Nondirectional Hypothesis
A non-directional hypothesis, also known as a two-tailed hypothesis, predicts that there is a difference or relationship between two variables but does not specify the direction of this relationship.
It merely indicates that a change or effect will occur without predicting which group will have higher or lower values.
For example, “There is a difference in performance between Group A and Group B” is a non-directional hypothesis.
Directional Hypothesis
A directional (one-tailed) hypothesis predicts the nature of the effect of the independent variable on the dependent variable. It predicts in which direction the change will take place. (i.e., greater, smaller, less, more)
It specifies whether one variable is greater, lesser, or different from another, rather than just indicating that there’s a difference without specifying its nature.
For example, “Exercise increases weight loss” is a directional hypothesis.

Falsifiability
The Falsification Principle, proposed by Karl Popper , is a way of demarcating science from non-science. It suggests that for a theory or hypothesis to be considered scientific, it must be testable and irrefutable.
Falsifiability emphasizes that scientific claims shouldn’t just be confirmable but should also have the potential to be proven wrong.
It means that there should exist some potential evidence or experiment that could prove the proposition false.
However many confirming instances exist for a theory, it only takes one counter observation to falsify it. For example, the hypothesis that “all swans are white,” can be falsified by observing a black swan.
For Popper, science should attempt to disprove a theory rather than attempt to continually provide evidence to support a research hypothesis.
Can a Hypothesis be Proven?
Hypotheses make probabilistic predictions. They state the expected outcome if a particular relationship exists. However, a study result supporting a hypothesis does not definitively prove it is true.
All studies have limitations. There may be unknown confounding factors or issues that limit the certainty of conclusions. Additional studies may yield different results.
In science, hypotheses can realistically only be supported with some degree of confidence, not proven. The process of science is to incrementally accumulate evidence for and against hypothesized relationships in an ongoing pursuit of better models and explanations that best fit the empirical data. But hypotheses remain open to revision and rejection if that is where the evidence leads.
- Disproving a hypothesis is definitive. Solid disconfirmatory evidence will falsify a hypothesis and require altering or discarding it based on the evidence.
- However, confirming evidence is always open to revision. Other explanations may account for the same results, and additional or contradictory evidence may emerge over time.
We can never 100% prove the alternative hypothesis. Instead, we see if we can disprove, or reject the null hypothesis.
If we reject the null hypothesis, this doesn’t mean that our alternative hypothesis is correct but does support the alternative/experimental hypothesis.
Upon analysis of the results, an alternative hypothesis can be rejected or supported, but it can never be proven to be correct. We must avoid any reference to results proving a theory as this implies 100% certainty, and there is always a chance that evidence may exist which could refute a theory.
How to Write a Hypothesis
- Identify variables . The researcher manipulates the independent variable and the dependent variable is the measured outcome.
- Operationalized the variables being investigated . Operationalization of a hypothesis refers to the process of making the variables physically measurable or testable, e.g. if you are about to study aggression, you might count the number of punches given by participants.
- Decide on a direction for your prediction . If there is evidence in the literature to support a specific effect of the independent variable on the dependent variable, write a directional (one-tailed) hypothesis. If there are limited or ambiguous findings in the literature regarding the effect of the independent variable on the dependent variable, write a non-directional (two-tailed) hypothesis.
- Make it Testable : Ensure your hypothesis can be tested through experimentation or observation. It should be possible to prove it false (principle of falsifiability).
- Clear & concise language . A strong hypothesis is concise (typically one to two sentences long), and formulated using clear and straightforward language, ensuring it’s easily understood and testable.
Consider a hypothesis many teachers might subscribe to: students work better on Monday morning than on Friday afternoon (IV=Day, DV= Standard of work).
Now, if we decide to study this by giving the same group of students a lesson on a Monday morning and a Friday afternoon and then measuring their immediate recall of the material covered in each session, we would end up with the following:
- The alternative hypothesis states that students will recall significantly more information on a Monday morning than on a Friday afternoon.
- The null hypothesis states that there will be no significant difference in the amount recalled on a Monday morning compared to a Friday afternoon. Any difference will be due to chance or confounding factors.
More Examples
- Memory : Participants exposed to classical music during study sessions will recall more items from a list than those who studied in silence.
- Social Psychology : Individuals who frequently engage in social media use will report higher levels of perceived social isolation compared to those who use it infrequently.
- Developmental Psychology : Children who engage in regular imaginative play have better problem-solving skills than those who don’t.
- Clinical Psychology : Cognitive-behavioral therapy will be more effective in reducing symptoms of anxiety over a 6-month period compared to traditional talk therapy.
- Cognitive Psychology : Individuals who multitask between various electronic devices will have shorter attention spans on focused tasks than those who single-task.
- Health Psychology : Patients who practice mindfulness meditation will experience lower levels of chronic pain compared to those who don’t meditate.
- Organizational Psychology : Employees in open-plan offices will report higher levels of stress than those in private offices.
- Behavioral Psychology : Rats rewarded with food after pressing a lever will press it more frequently than rats who receive no reward.
- Machine Learning Tutorial
- Data Analysis Tutorial
- Python - Data visualization tutorial
- Machine Learning Projects
- Machine Learning Interview Questions
- Machine Learning Mathematics
- Deep Learning Tutorial
- Deep Learning Project
- Deep Learning Interview Questions
- Computer Vision Tutorial
- Computer Vision Projects
- NLP Project
- NLP Interview Questions
- Statistics with Python
- 100 Days of Machine Learning
- Data Analysis with Python
Introduction to Data Analysis
- What is Data Analysis?
- Data Analytics and its type
- How to Install Numpy on Windows?
- How to Install Pandas in Python?
- How to Install Matplotlib on python?
- How to Install Python Tensorflow in Windows?
Data Analysis Libraries
- Pandas Tutorial
- NumPy Tutorial - Python Library
- Data Analysis with SciPy
- Introduction to TensorFlow
Data Visulization Libraries
- Matplotlib Tutorial
- Python Seaborn Tutorial
- Plotly tutorial
- Introduction to Bokeh in Python
Exploratory Data Analysis (EDA)
- Univariate, Bivariate and Multivariate data and its analysis
- Measures of Central Tendency in Statistics
- Measures of spread - Range, Variance, and Standard Deviation
- Interquartile Range and Quartile Deviation using NumPy and SciPy
- Anova Formula
- Skewness of Statistical Data
- How to Calculate Skewness and Kurtosis in Python?
- Difference Between Skewness and Kurtosis
- Histogram | Meaning, Example, Types and Steps to Draw
- Interpretations of Histogram
- Quantile Quantile plots
- What is Univariate, Bivariate & Multivariate Analysis in Data Visualisation?
- Using pandas crosstab to create a bar plot
- Exploring Correlation in Python
- Mathematics | Covariance and Correlation
- Factor Analysis | Data Analysis
- Data Mining - Cluster Analysis
- MANOVA Test in R Programming
- Python - Central Limit Theorem
- Probability Distribution Function
- Probability Density Estimation & Maximum Likelihood Estimation
- Exponential Distribution in R Programming - dexp(), pexp(), qexp(), and rexp() Functions
- Mathematics | Probability Distributions Set 4 (Binomial Distribution)
- Poisson Distribution - Definition, Formula, Table and Examples
- P-Value: Comprehensive Guide to Understand, Apply, and Interpret
- Z-Score in Statistics
- How to Calculate Point Estimates in R?
- Confidence Interval
- Chi-square test in Machine Learning
Understanding Hypothesis Testing
Data preprocessing.
- ML | Data Preprocessing in Python
- ML | Overview of Data Cleaning
- ML | Handling Missing Values
- Detect and Remove the Outliers using Python
Data Transformation
- Data Normalization Machine Learning
- Sampling distribution Using Python
Time Series Data Analysis
- Data Mining - Time-Series, Symbolic and Biological Sequences Data
- Basic DateTime Operations in Python
- Time Series Analysis & Visualization in Python
- How to deal with missing values in a Timeseries in Python?
- How to calculate MOVING AVERAGE in a Pandas DataFrame?
- What is a trend in time series?
- How to Perform an Augmented Dickey-Fuller Test in R
- AutoCorrelation
Case Studies and Projects
- Top 8 Free Dataset Sources to Use for Data Science Projects
- Step by Step Predictive Analysis - Machine Learning
- 6 Tips for Creating Effective Data Visualizations
Hypothesis testing involves formulating assumptions about population parameters based on sample statistics and rigorously evaluating these assumptions against empirical evidence. This article sheds light on the significance of hypothesis testing and the critical steps involved in the process.
What is Hypothesis Testing?
Hypothesis testing is a statistical method that is used to make a statistical decision using experimental data. Hypothesis testing is basically an assumption that we make about a population parameter. It evaluates two mutually exclusive statements about a population to determine which statement is best supported by the sample data.
Example: You say an average height in the class is 30 or a boy is taller than a girl. All of these is an assumption that we are assuming, and we need some statistical way to prove these. We need some mathematical conclusion whatever we are assuming is true.
Defining Hypotheses

Key Terms of Hypothesis Testing

- P-value: The P value , or calculated probability, is the probability of finding the observed/extreme results when the null hypothesis(H0) of a study-given problem is true. If your P-value is less than the chosen significance level then you reject the null hypothesis i.e. accept that your sample claims to support the alternative hypothesis.
- Test Statistic: The test statistic is a numerical value calculated from sample data during a hypothesis test, used to determine whether to reject the null hypothesis. It is compared to a critical value or p-value to make decisions about the statistical significance of the observed results.
- Critical value : The critical value in statistics is a threshold or cutoff point used to determine whether to reject the null hypothesis in a hypothesis test.
- Degrees of freedom: Degrees of freedom are associated with the variability or freedom one has in estimating a parameter. The degrees of freedom are related to the sample size and determine the shape.
Why do we use Hypothesis Testing?
Hypothesis testing is an important procedure in statistics. Hypothesis testing evaluates two mutually exclusive population statements to determine which statement is most supported by sample data. When we say that the findings are statistically significant, thanks to hypothesis testing.
One-Tailed and Two-Tailed Test
One tailed test focuses on one direction, either greater than or less than a specified value. We use a one-tailed test when there is a clear directional expectation based on prior knowledge or theory. The critical region is located on only one side of the distribution curve. If the sample falls into this critical region, the null hypothesis is rejected in favor of the alternative hypothesis.
One-Tailed Test
There are two types of one-tailed test:

Two-Tailed Test
A two-tailed test considers both directions, greater than and less than a specified value.We use a two-tailed test when there is no specific directional expectation, and want to detect any significant difference.

What are Type 1 and Type 2 errors in Hypothesis Testing?
In hypothesis testing, Type I and Type II errors are two possible errors that researchers can make when drawing conclusions about a population based on a sample of data. These errors are associated with the decisions made regarding the null hypothesis and the alternative hypothesis.

How does Hypothesis Testing work?
Step 1: define null and alternative hypothesis.

We first identify the problem about which we want to make an assumption keeping in mind that our assumption should be contradictory to one another, assuming Normally distributed data.
Step 2 – Choose significance level

Step 3 – Collect and Analyze data.
Gather relevant data through observation or experimentation. Analyze the data using appropriate statistical methods to obtain a test statistic.
Step 4-Calculate Test Statistic
The data for the tests are evaluated in this step we look for various scores based on the characteristics of data. The choice of the test statistic depends on the type of hypothesis test being conducted.
There are various hypothesis tests, each appropriate for various goal to calculate our test. This could be a Z-test , Chi-square , T-test , and so on.
- Z-test : If population means and standard deviations are known. Z-statistic is commonly used.
- t-test : If population standard deviations are unknown. and sample size is small than t-test statistic is more appropriate.
- Chi-square test : Chi-square test is used for categorical data or for testing independence in contingency tables
- F-test : F-test is often used in analysis of variance (ANOVA) to compare variances or test the equality of means across multiple groups.
We have a smaller dataset, So, T-test is more appropriate to test our hypothesis.
T-statistic is a measure of the difference between the means of two groups relative to the variability within each group. It is calculated as the difference between the sample means divided by the standard error of the difference. It is also known as the t-value or t-score.
Step 5 – Comparing Test Statistic:
In this stage, we decide where we should accept the null hypothesis or reject the null hypothesis. There are two ways to decide where we should accept or reject the null hypothesis.
Method A: Using Crtical values
Comparing the test statistic and tabulated critical value we have,
- If Test Statistic>Critical Value: Reject the null hypothesis.
- If Test Statistic≤Critical Value: Fail to reject the null hypothesis.
Note: Critical values are predetermined threshold values that are used to make a decision in hypothesis testing. To determine critical values for hypothesis testing, we typically refer to a statistical distribution table , such as the normal distribution or t-distribution tables based on.
Method B: Using P-values
We can also come to an conclusion using the p-value,

Note : The p-value is the probability of obtaining a test statistic as extreme as, or more extreme than, the one observed in the sample, assuming the null hypothesis is true. To determine p-value for hypothesis testing, we typically refer to a statistical distribution table , such as the normal distribution or t-distribution tables based on.
Step 7- Interpret the Results
At last, we can conclude our experiment using method A or B.
Calculating test statistic
To validate our hypothesis about a population parameter we use statistical functions . We use the z-score, p-value, and level of significance(alpha) to make evidence for our hypothesis for normally distributed data .
1. Z-statistics:
When population means and standard deviations are known.

- μ represents the population mean,
- σ is the standard deviation
- and n is the size of the sample.
2. T-Statistics
T test is used when n<30,
t-statistic calculation is given by:

- t = t-score,
- x̄ = sample mean
- μ = population mean,
- s = standard deviation of the sample,
- n = sample size
3. Chi-Square Test
Chi-Square Test for Independence categorical Data (Non-normally distributed) using:

- i,j are the rows and columns index respectively.

Real life Hypothesis Testing example
Let’s examine hypothesis testing using two real life situations,
Case A: D oes a New Drug Affect Blood Pressure?
Imagine a pharmaceutical company has developed a new drug that they believe can effectively lower blood pressure in patients with hypertension. Before bringing the drug to market, they need to conduct a study to assess its impact on blood pressure.
- Before Treatment: 120, 122, 118, 130, 125, 128, 115, 121, 123, 119
- After Treatment: 115, 120, 112, 128, 122, 125, 110, 117, 119, 114
Step 1 : Define the Hypothesis
- Null Hypothesis : (H 0 )The new drug has no effect on blood pressure.
- Alternate Hypothesis : (H 1 )The new drug has an effect on blood pressure.
Step 2: Define the Significance level
Let’s consider the Significance level at 0.05, indicating rejection of the null hypothesis.
If the evidence suggests less than a 5% chance of observing the results due to random variation.
Step 3 : Compute the test statistic
Using paired T-test analyze the data to obtain a test statistic and a p-value.
The test statistic (e.g., T-statistic) is calculated based on the differences between blood pressure measurements before and after treatment.
t = m/(s/√n)
- m = mean of the difference i.e X after, X before
- s = standard deviation of the difference (d) i.e d i = X after, i − X before,
- n = sample size,
then, m= -3.9, s= 1.8 and n= 10
we, calculate the , T-statistic = -9 based on the formula for paired t test
Step 4: Find the p-value
The calculated t-statistic is -9 and degrees of freedom df = 9, you can find the p-value using statistical software or a t-distribution table.
thus, p-value = 8.538051223166285e-06
Step 5: Result
- If the p-value is less than or equal to 0.05, the researchers reject the null hypothesis.
- If the p-value is greater than 0.05, they fail to reject the null hypothesis.
Conclusion: Since the p-value (8.538051223166285e-06) is less than the significance level (0.05), the researchers reject the null hypothesis. There is statistically significant evidence that the average blood pressure before and after treatment with the new drug is different.
Python Implementation of Hypothesis Testing
Let’s create hypothesis testing with python, where we are testing whether a new drug affects blood pressure. For this example, we will use a paired T-test. We’ll use the scipy.stats library for the T-test.
Scipy is a mathematical library in Python that is mostly used for mathematical equations and computations.
We will implement our first real life problem via python,
In the above example, given the T-statistic of approximately -9 and an extremely small p-value, the results indicate a strong case to reject the null hypothesis at a significance level of 0.05.
- The results suggest that the new drug, treatment, or intervention has a significant effect on lowering blood pressure.
- The negative T-statistic indicates that the mean blood pressure after treatment is significantly lower than the assumed population mean before treatment.
Case B : Cholesterol level in a population
Data: A sample of 25 individuals is taken, and their cholesterol levels are measured.
Cholesterol Levels (mg/dL): 205, 198, 210, 190, 215, 205, 200, 192, 198, 205, 198, 202, 208, 200, 205, 198, 205, 210, 192, 205, 198, 205, 210, 192, 205.
Populations Mean = 200
Population Standard Deviation (σ): 5 mg/dL(given for this problem)
Step 1: Define the Hypothesis
- Null Hypothesis (H 0 ): The average cholesterol level in a population is 200 mg/dL.
- Alternate Hypothesis (H 1 ): The average cholesterol level in a population is different from 200 mg/dL.
As the direction of deviation is not given , we assume a two-tailed test, and based on a normal distribution table, the critical values for a significance level of 0.05 (two-tailed) can be calculated through the z-table and are approximately -1.96 and 1.96.

Step 4: Result
Since the absolute value of the test statistic (2.04) is greater than the critical value (1.96), we reject the null hypothesis. And conclude that, there is statistically significant evidence that the average cholesterol level in the population is different from 200 mg/dL
Limitations of Hypothesis Testing
- Although a useful technique, hypothesis testing does not offer a comprehensive grasp of the topic being studied. Without fully reflecting the intricacy or whole context of the phenomena, it concentrates on certain hypotheses and statistical significance.
- The accuracy of hypothesis testing results is contingent on the quality of available data and the appropriateness of statistical methods used. Inaccurate data or poorly formulated hypotheses can lead to incorrect conclusions.
- Relying solely on hypothesis testing may cause analysts to overlook significant patterns or relationships in the data that are not captured by the specific hypotheses being tested. This limitation underscores the importance of complimenting hypothesis testing with other analytical approaches.
Hypothesis testing stands as a cornerstone in statistical analysis, enabling data scientists to navigate uncertainties and draw credible inferences from sample data. By systematically defining null and alternative hypotheses, choosing significance levels, and leveraging statistical tests, researchers can assess the validity of their assumptions. The article also elucidates the critical distinction between Type I and Type II errors, providing a comprehensive understanding of the nuanced decision-making process inherent in hypothesis testing. The real-life example of testing a new drug’s effect on blood pressure using a paired T-test showcases the practical application of these principles, underscoring the importance of statistical rigor in data-driven decision-making.
Frequently Asked Questions (FAQs)
1. what are the 3 types of hypothesis test.
There are three types of hypothesis tests: right-tailed, left-tailed, and two-tailed. Right-tailed tests assess if a parameter is greater, left-tailed if lesser. Two-tailed tests check for non-directional differences, greater or lesser.
2.What are the 4 components of hypothesis testing?
Null Hypothesis ( ): No effect or difference exists. Alternative Hypothesis ( ): An effect or difference exists. Significance Level ( ): Risk of rejecting null hypothesis when it’s true (Type I error). Test Statistic: Numerical value representing observed evidence against null hypothesis.
3.What is hypothesis testing in ML?
Statistical method to evaluate the performance and validity of machine learning models. Tests specific hypotheses about model behavior, like whether features influence predictions or if a model generalizes well to unseen data.
4.What is the difference between Pytest and hypothesis in Python?
Pytest purposes general testing framework for Python code while Hypothesis is a Property-based testing framework for Python, focusing on generating test cases based on specified properties of the code.
Please Login to comment...
Similar reads.
- data-science
- Data Science
- Machine Learning

Improve your Coding Skills with Practice
What kind of Experience do you want to share?
- Tech Reports
Pure Significance Tests for Multinomial and Binomial > > Distributions: the Uniform Alternative
Published 4/18/2024
A pure significance test (PST) tests a simple null hypothesis H $f$ : Y ~ $f$ without specifying an alternative hypothesis by rejecting H $f$ for small values of $f$ (Y ). When the sample space supports a proper uniform pmf $f_{\text{unif}}$, the PST can be viewed as a classical likelihood ratio test for testing H $f$ against this uniform alternative. Under this interpretation, standard test features such as power, Kullback-Leibler divergence, and expected p -value can be considered. This report focuses on PSTs for multinomial and binomial distributions, and for the related goodness-of-fit testing problems with the uniform alternative. The case of repeated observations cannot be reduced to the single observation case via su ciency. The ordered binomial distribution , apparently new, arises in the course of this study.

An official website of the United States government
The .gov means it’s official. Federal government websites often end in .gov or .mil. Before sharing sensitive information, make sure you’re on a federal government site.
The site is secure. The https:// ensures that you are connecting to the official website and that any information you provide is encrypted and transmitted securely.
- Publications
- Account settings
Preview improvements coming to the PMC website in October 2024. Learn More or Try it out now .
- Advanced Search
- Journal List
- J Korean Med Sci
- v.36(50); 2021 Dec 27
Formulating Hypotheses for Different Study Designs
Durga prasanna misra.
1 Department of Clinical Immunology and Rheumatology, Sanjay Gandhi Postgraduate Institute of Medical Sciences, Lucknow, India.
Armen Yuri Gasparyan
2 Departments of Rheumatology and Research and Development, Dudley Group NHS Foundation Trust (Teaching Trust of the University of Birmingham, UK), Russells Hall Hospital, Dudley, UK.
Olena Zimba
3 Department of Internal Medicine #2, Danylo Halytsky Lviv National Medical University, Lviv, Ukraine.
Marlen Yessirkepov
4 Department of Biology and Biochemistry, South Kazakhstan Medical Academy, Shymkent, Kazakhstan.
Vikas Agarwal
George d. kitas.
5 Centre for Epidemiology versus Arthritis, University of Manchester, Manchester, UK.
Generating a testable working hypothesis is the first step towards conducting original research. Such research may prove or disprove the proposed hypothesis. Case reports, case series, online surveys and other observational studies, clinical trials, and narrative reviews help to generate hypotheses. Observational and interventional studies help to test hypotheses. A good hypothesis is usually based on previous evidence-based reports. Hypotheses without evidence-based justification and a priori ideas are not received favourably by the scientific community. Original research to test a hypothesis should be carefully planned to ensure appropriate methodology and adequate statistical power. While hypotheses can challenge conventional thinking and may be controversial, they should not be destructive. A hypothesis should be tested by ethically sound experiments with meaningful ethical and clinical implications. The coronavirus disease 2019 pandemic has brought into sharp focus numerous hypotheses, some of which were proven (e.g. effectiveness of corticosteroids in those with hypoxia) while others were disproven (e.g. ineffectiveness of hydroxychloroquine and ivermectin).
Graphical Abstract

DEFINING WORKING AND STANDALONE SCIENTIFIC HYPOTHESES
Science is the systematized description of natural truths and facts. Routine observations of existing life phenomena lead to the creative thinking and generation of ideas about mechanisms of such phenomena and related human interventions. Such ideas presented in a structured format can be viewed as hypotheses. After generating a hypothesis, it is necessary to test it to prove its validity. Thus, hypothesis can be defined as a proposed mechanism of a naturally occurring event or a proposed outcome of an intervention. 1 , 2
Hypothesis testing requires choosing the most appropriate methodology and adequately powering statistically the study to be able to “prove” or “disprove” it within predetermined and widely accepted levels of certainty. This entails sample size calculation that often takes into account previously published observations and pilot studies. 2 , 3 In the era of digitization, hypothesis generation and testing may benefit from the availability of numerous platforms for data dissemination, social networking, and expert validation. Related expert evaluations may reveal strengths and limitations of proposed ideas at early stages of post-publication promotion, preventing the implementation of unsupported controversial points. 4
Thus, hypothesis generation is an important initial step in the research workflow, reflecting accumulating evidence and experts' stance. In this article, we overview the genesis and importance of scientific hypotheses and their relevance in the era of the coronavirus disease 2019 (COVID-19) pandemic.
DO WE NEED HYPOTHESES FOR ALL STUDY DESIGNS?
Broadly, research can be categorized as primary or secondary. In the context of medicine, primary research may include real-life observations of disease presentations and outcomes. Single case descriptions, which often lead to new ideas and hypotheses, serve as important starting points or justifications for case series and cohort studies. The importance of case descriptions is particularly evident in the context of the COVID-19 pandemic when unique, educational case reports have heralded a new era in clinical medicine. 5
Case series serve similar purpose to single case reports, but are based on a slightly larger quantum of information. Observational studies, including online surveys, describe the existing phenomena at a larger scale, often involving various control groups. Observational studies include variable-scale epidemiological investigations at different time points. Interventional studies detail the results of therapeutic interventions.
Secondary research is based on already published literature and does not directly involve human or animal subjects. Review articles are generated by secondary research. These could be systematic reviews which follow methods akin to primary research but with the unit of study being published papers rather than humans or animals. Systematic reviews have a rigid structure with a mandatory search strategy encompassing multiple databases, systematic screening of search results against pre-defined inclusion and exclusion criteria, critical appraisal of study quality and an optional component of collating results across studies quantitatively to derive summary estimates (meta-analysis). 6 Narrative reviews, on the other hand, have a more flexible structure. Systematic literature searches to minimise bias in selection of articles are highly recommended but not mandatory. 7 Narrative reviews are influenced by the authors' viewpoint who may preferentially analyse selected sets of articles. 8
In relation to primary research, case studies and case series are generally not driven by a working hypothesis. Rather, they serve as a basis to generate a hypothesis. Observational or interventional studies should have a hypothesis for choosing research design and sample size. The results of observational and interventional studies further lead to the generation of new hypotheses, testing of which forms the basis of future studies. Review articles, on the other hand, may not be hypothesis-driven, but form fertile ground to generate future hypotheses for evaluation. Fig. 1 summarizes which type of studies are hypothesis-driven and which lead on to hypothesis generation.

STANDARDS OF WORKING AND SCIENTIFIC HYPOTHESES
A review of the published literature did not enable the identification of clearly defined standards for working and scientific hypotheses. It is essential to distinguish influential versus not influential hypotheses, evidence-based hypotheses versus a priori statements and ideas, ethical versus unethical, or potentially harmful ideas. The following points are proposed for consideration while generating working and scientific hypotheses. 1 , 2 Table 1 summarizes these points.
Evidence-based data
A scientific hypothesis should have a sound basis on previously published literature as well as the scientist's observations. Randomly generated (a priori) hypotheses are unlikely to be proven. A thorough literature search should form the basis of a hypothesis based on published evidence. 7
Unless a scientific hypothesis can be tested, it can neither be proven nor be disproven. Therefore, a scientific hypothesis should be amenable to testing with the available technologies and the present understanding of science.
Supported by pilot studies
If a hypothesis is based purely on a novel observation by the scientist in question, it should be grounded on some preliminary studies to support it. For example, if a drug that targets a specific cell population is hypothesized to be useful in a particular disease setting, then there must be some preliminary evidence that the specific cell population plays a role in driving that disease process.
Testable by ethical studies
The hypothesis should be testable by experiments that are ethically acceptable. 9 For example, a hypothesis that parachutes reduce mortality from falls from an airplane cannot be tested using a randomized controlled trial. 10 This is because it is obvious that all those jumping from a flying plane without a parachute would likely die. Similarly, the hypothesis that smoking tobacco causes lung cancer cannot be tested by a clinical trial that makes people take up smoking (since there is considerable evidence for the health hazards associated with smoking). Instead, long-term observational studies comparing outcomes in those who smoke and those who do not, as was performed in the landmark epidemiological case control study by Doll and Hill, 11 are more ethical and practical.
Balance between scientific temper and controversy
Novel findings, including novel hypotheses, particularly those that challenge established norms, are bound to face resistance for their wider acceptance. Such resistance is inevitable until the time such findings are proven with appropriate scientific rigor. However, hypotheses that generate controversy are generally unwelcome. For example, at the time the pandemic of human immunodeficiency virus (HIV) and AIDS was taking foot, there were numerous deniers that refused to believe that HIV caused AIDS. 12 , 13 Similarly, at a time when climate change is causing catastrophic changes to weather patterns worldwide, denial that climate change is occurring and consequent attempts to block climate change are certainly unwelcome. 14 The denialism and misinformation during the COVID-19 pandemic, including unfortunate examples of vaccine hesitancy, are more recent examples of controversial hypotheses not backed by science. 15 , 16 An example of a controversial hypothesis that was a revolutionary scientific breakthrough was the hypothesis put forth by Warren and Marshall that Helicobacter pylori causes peptic ulcers. Initially, the hypothesis that a microorganism could cause gastritis and gastric ulcers faced immense resistance. When the scientists that proposed the hypothesis themselves ingested H. pylori to induce gastritis in themselves, only then could they convince the wider world about their hypothesis. Such was the impact of the hypothesis was that Barry Marshall and Robin Warren were awarded the Nobel Prize in Physiology or Medicine in 2005 for this discovery. 17 , 18
DISTINGUISHING THE MOST INFLUENTIAL HYPOTHESES
Influential hypotheses are those that have stood the test of time. An archetype of an influential hypothesis is that proposed by Edward Jenner in the eighteenth century that cowpox infection protects against smallpox. While this observation had been reported for nearly a century before this time, it had not been suitably tested and publicised until Jenner conducted his experiments on a young boy by demonstrating protection against smallpox after inoculation with cowpox. 19 These experiments were the basis for widespread smallpox immunization strategies worldwide in the 20th century which resulted in the elimination of smallpox as a human disease today. 20
Other influential hypotheses are those which have been read and cited widely. An example of this is the hygiene hypothesis proposing an inverse relationship between infections in early life and allergies or autoimmunity in adulthood. An analysis reported that this hypothesis had been cited more than 3,000 times on Scopus. 1
LESSONS LEARNED FROM HYPOTHESES AMIDST THE COVID-19 PANDEMIC
The COVID-19 pandemic devastated the world like no other in recent memory. During this period, various hypotheses emerged, understandably so considering the public health emergency situation with innumerable deaths and suffering for humanity. Within weeks of the first reports of COVID-19, aberrant immune system activation was identified as a key driver of organ dysfunction and mortality in this disease. 21 Consequently, numerous drugs that suppress the immune system or abrogate the activation of the immune system were hypothesized to have a role in COVID-19. 22 One of the earliest drugs hypothesized to have a benefit was hydroxychloroquine. Hydroxychloroquine was proposed to interfere with Toll-like receptor activation and consequently ameliorate the aberrant immune system activation leading to pathology in COVID-19. 22 The drug was also hypothesized to have a prophylactic role in preventing infection or disease severity in COVID-19. It was also touted as a wonder drug for the disease by many prominent international figures. However, later studies which were well-designed randomized controlled trials failed to demonstrate any benefit of hydroxychloroquine in COVID-19. 23 , 24 , 25 , 26 Subsequently, azithromycin 27 , 28 and ivermectin 29 were hypothesized as potential therapies for COVID-19, but were not supported by evidence from randomized controlled trials. The role of vitamin D in preventing disease severity was also proposed, but has not been proven definitively until now. 30 , 31 On the other hand, randomized controlled trials identified the evidence supporting dexamethasone 32 and interleukin-6 pathway blockade with tocilizumab as effective therapies for COVID-19 in specific situations such as at the onset of hypoxia. 33 , 34 Clues towards the apparent effectiveness of various drugs against severe acute respiratory syndrome coronavirus 2 in vitro but their ineffectiveness in vivo have recently been identified. Many of these drugs are weak, lipophilic bases and some others induce phospholipidosis which results in apparent in vitro effectiveness due to non-specific off-target effects that are not replicated inside living systems. 35 , 36
Another hypothesis proposed was the association of the routine policy of vaccination with Bacillus Calmette-Guerin (BCG) with lower deaths due to COVID-19. This hypothesis emerged in the middle of 2020 when COVID-19 was still taking foot in many parts of the world. 37 , 38 Subsequently, many countries which had lower deaths at that time point went on to have higher numbers of mortality, comparable to other areas of the world. Furthermore, the hypothesis that BCG vaccination reduced COVID-19 mortality was a classic example of ecological fallacy. Associations between population level events (ecological studies; in this case, BCG vaccination and COVID-19 mortality) cannot be directly extrapolated to the individual level. Furthermore, such associations cannot per se be attributed as causal in nature, and can only serve to generate hypotheses that need to be tested at the individual level. 39
IS TRADITIONAL PEER REVIEW EFFICIENT FOR EVALUATION OF WORKING AND SCIENTIFIC HYPOTHESES?
Traditionally, publication after peer review has been considered the gold standard before any new idea finds acceptability amongst the scientific community. Getting a work (including a working or scientific hypothesis) reviewed by experts in the field before experiments are conducted to prove or disprove it helps to refine the idea further as well as improve the experiments planned to test the hypothesis. 40 A route towards this has been the emergence of journals dedicated to publishing hypotheses such as the Central Asian Journal of Medical Hypotheses and Ethics. 41 Another means of publishing hypotheses is through registered research protocols detailing the background, hypothesis, and methodology of a particular study. If such protocols are published after peer review, then the journal commits to publishing the completed study irrespective of whether the study hypothesis is proven or disproven. 42 In the post-pandemic world, online research methods such as online surveys powered via social media channels such as Twitter and Instagram might serve as critical tools to generate as well as to preliminarily test the appropriateness of hypotheses for further evaluation. 43 , 44
Some radical hypotheses might be difficult to publish after traditional peer review. These hypotheses might only be acceptable by the scientific community after they are tested in research studies. Preprints might be a way to disseminate such controversial and ground-breaking hypotheses. 45 However, scientists might prefer to keep their hypotheses confidential for the fear of plagiarism of ideas, avoiding online posting and publishing until they have tested the hypotheses.
SUGGESTIONS ON GENERATING AND PUBLISHING HYPOTHESES
Publication of hypotheses is important, however, a balance is required between scientific temper and controversy. Journal editors and reviewers might keep in mind these specific points, summarized in Table 2 and detailed hereafter, while judging the merit of hypotheses for publication. Keeping in mind the ethical principle of primum non nocere, a hypothesis should be published only if it is testable in a manner that is ethically appropriate. 46 Such hypotheses should be grounded in reality and lend themselves to further testing to either prove or disprove them. It must be considered that subsequent experiments to prove or disprove a hypothesis have an equal chance of failing or succeeding, akin to tossing a coin. A pre-conceived belief that a hypothesis is unlikely to be proven correct should not form the basis of rejection of such a hypothesis for publication. In this context, hypotheses generated after a thorough literature search to identify knowledge gaps or based on concrete clinical observations on a considerable number of patients (as opposed to random observations on a few patients) are more likely to be acceptable for publication by peer-reviewed journals. Also, hypotheses should be considered for publication or rejection based on their implications for science at large rather than whether the subsequent experiments to test them end up with results in favour of or against the original hypothesis.
Hypotheses form an important part of the scientific literature. The COVID-19 pandemic has reiterated the importance and relevance of hypotheses for dealing with public health emergencies and highlighted the need for evidence-based and ethical hypotheses. A good hypothesis is testable in a relevant study design, backed by preliminary evidence, and has positive ethical and clinical implications. General medical journals might consider publishing hypotheses as a specific article type to enable more rapid advancement of science.
Disclosure: The authors have no potential conflicts of interest to disclose.
Author Contributions:
- Data curation: Gasparyan AY, Misra DP, Zimba O, Yessirkepov M, Agarwal V, Kitas GD.
IMAGES
VIDEO
COMMENTS
Step 5: Present your findings. The results of hypothesis testing will be presented in the results and discussion sections of your research paper, dissertation or thesis.. In the results section you should give a brief summary of the data and a summary of the results of your statistical test (for example, the estimated difference between group means and associated p-value).
Mean Population IQ: 100. Step 1: Using the value of the mean population IQ, we establish the null hypothesis as 100. Step 2: State that the alternative hypothesis is greater than 100. Step 3: State the alpha level as 0.05 or 5%. Step 4: Find the rejection region area (given by your alpha level above) from the z-table.
Medical providers often rely on evidence-based medicine to guide decision-making in practice. Often a research hypothesis is tested with results provided, typically with p values, confidence intervals, or both. Additionally, statistical or research significance is estimated or determined by the investigators. Unfortunately, healthcare providers may have different comfort levels in interpreting ...
Hypothesis testing is a scientific method used for making a decision and drawing conclusions by using a statistical approach. It is used to suggest new ideas by testing theories to know whether or not the sample data supports research. A research hypothesis is a predictive statement that has to be tested using scientific methods that join an ...
Abstract. Statistical hypothesis testing is common in research, but a conventional understanding sometimes leads to mistaken application and misinterpretation. The logic of hypothesis testing presented in this article provides for a clearer understanding, application, and interpretation. Key conclusions are that (a) the magnitude of an estimate ...
S.3 Hypothesis Testing. In reviewing hypothesis tests, we start first with the general idea. Then, we keep returning to the basic procedures of hypothesis testing, each time adding a little more detail. The general idea of hypothesis testing involves: Making an initial assumption. Collecting evidence (data).
8.5 Testing a Research Using the z Test 8.6 Research in Focus: Directional Versus Nondirectional Tests 8.7 Measuring the Size of an Effect: Cohen's d ... Hypothesis testing or significance testing is a method for testing a claim or hypothesis about a parameter in a population, using data measured in a sample. In this method, we test some ...
Hypothesis testing is an act in statistics whereby an analyst tests an assumption regarding a population parameter. The methodology employed by the analyst depends on the nature of the data used ...
A hypothesis test consists of five steps: 1. State the hypotheses. State the null and alternative hypotheses. These two hypotheses need to be mutually exclusive, so if one is true then the other must be false. 2. Determine a significance level to use for the hypothesis. Decide on a significance level.
A research hypothesis is an assumption or a tentative explanation for a specific process observed during research. Unlike a guess, research hypothesis is a calculated, educated guess proven or disproven through research methods. ... He published a paper in 1925 that introduced the concept of null hypothesis testing, and he was also the first to ...
Hypothesis Testing The research hypothesis. The first step in hypothesis testing is to set a research hypothesis. In Sarah and Mike's study, the aim is to examine the effect that two different teaching methods - providing both lectures and seminar classes (Sarah), and providing lectures by themselves (Mike) - had on the performance of Sarah ...
HYPOTHESIS TESTING. A clinical trial begins with an assumption or belief, and then proceeds to either prove or disprove this assumption. In statistical terms, this belief or assumption is known as a hypothesis. Counterintuitively, what the researcher believes in (or is trying to prove) is called the "alternate" hypothesis, and the opposite ...
A hypothesis test is a procedure used in statistics to assess whether a particular viewpoint is likely to be true. They follow a strict protocol, and they generate a 'p-value', on the basis of which a decision is made about the truth of the hypothesis under investigation.All of the routine statistical 'tests' used in research—t-tests, χ 2 tests, Mann-Whitney tests, etc.—are all ...
What does a statistical test do? Statistical tests work by calculating a test statistic - a number that describes how much the relationship between variables in your test differs from the null hypothesis of no relationship.. It then calculates a p value (probability value). The p-value estimates how likely it is that you would see the difference described by the test statistic if the null ...
Hypothesis testing is a systematic procedure for deciding whether the results of a research study support a particular theory which applies to a population. ... To carry out statistical hypothesis testing, research and null hypothesis are employed: Research hypothesis: this is the hypothesis that you propose, also known as the alternative ...
In order to undertake hypothesis testing you need to express your research hypothesis as a null and alternative hypothesis. The null hypothesis and alternative hypothesis are statements regarding the differences or effects that occur in the population. You will use your sample to test which statement (i.e., the null hypothesis or alternative ...
A research hypothesis, in its plural form "hypotheses," is a specific, testable prediction about the anticipated results of a study, established at its outset. The research hypothesis is often referred to as the alternative hypothesis. ... It establishes a baseline for statistical testing, promoting objectivity by initiating research from a ...
Procedure for/ Steps of Hypothesis Testing: All hypothesis tests are conducted the same way. The researcher states a hypothesis to be tested, formulates an analysis plan, analyzes sample data ...
A hypothesis testing is the pillar of true research findings. This write-up substantiates the role of a hypothesis, steps in hypothesis testing and its application in the course of a research ...
Firstly, every good hypothesis or test has clear variables which essentially refer to specific aspects of the study subject matter being measured or manipulated during research. These aspects are segregated as: Independent Variable (IV): This component relates directly to what you have control over in your study.
Hypothesis-testing (Quantitative hypothesis-testing research) - Quantitative research uses deductive reasoning. - This involves the formation of a hypothesis, collection of data in the investigation of the problem, analysis and use of the data from the investigation, and drawing of conclusions to validate or nullify the hypotheses.
There are seven steps of the scientific method such as: Make an observation. Ask a question. Background research/ Research the topic. Formulate a hypothesis. Conduct an experiment to test the hypothesis. Data record and analysis. Draw a conclusion. 1.
Step 3: Compute the test statistic. The test statistic is calculated by using the z formula Z= and we get accordingly , Z=2.039999999999992. Step 4: Result. Since the absolute value of the test statistic (2.04) is greater than the critical value (1.96), we reject the null hypothesis.
However, the nation confronts a significant digital divide, anticipating a shortfall of nine million skilled professionals in digital skills by 2030. Bridging this gap necessitates a targeted focus on aligning education with industry demands encompassing both technical expertise […] March 7, 2024. TUMx and edX team up with Infineon to deliver ...
Under this interpretation, standard test features such as power, Kullback-Leibler divergence, and expected p-value can be considered. This report focuses on PSTs for multinomial and binomial distributions, and for the related goodness-of-fit testing problems with the uniform alternative.
To test this hypothesis, we conducted a fMRI study, presenting images of a person within a multi-category scene to human male and female participants and assessed the contribution of each component to the response to the scene. Our results revealed a clutter-tolerant representation of the whole person in areas selective for both faces and ...
Formulating Hypotheses for Different Study Designs. Generating a testable working hypothesis is the first step towards conducting original research. Such research may prove or disprove the proposed hypothesis. Case reports, case series, online surveys and other observational studies, clinical trials, and narrative reviews help to generate ...
Human induced pluripotent stem cells (hiPSCs) are frequently used to study disease-associated variations. We characterized transcriptional variability from a hiPSC-derived cardiomyocyte (hiPSC-CM) study of left ventricular hypertrophy (LVH) using donor samples from the HyperGEN study. Multiple hiPSC-CM differentiations over reprogramming events (iPSC generation) across 7 donors were used to ...
The genetic load hypothesis of Hermann Muller raised the profound question of possible species extinction, even for humans, following a prolonged accumulation of recessive genes due to ionizing radiation exposure within the population. Two major mouse radiation research teams in the United States provided the most extensive tests of Muller's hypothesis. One group continued its study for more ...