

Tracking Studies
What are tracking studies.
In the broadest sense, tracking studies are longitudinal studies used in marketing research that survey a target population or audience at a specific time interval to measure changes in attitudes and behaviors. The questionnaire is rarely changed, and the time interval is kept consistent (i.e., weekly, monthly, etc.) so that results can be measured wave-to-wave.

Why Are Tracking Studies Important?
Objectives of tracking studies.
Tracking studies can have different objectives depending on the organization. Overall, their main goal is to measure changes in attitudes and behaviors and how they impact their brand. Here are just a few different things that tracking studies can be used to measure:
- Advertising Impact / Effectiveness
- Brand Awareness
- Brand Equity
- Brand Rating
- Brand Health
- Competitive Advantage
- Customer Perception
- Key Event Impact / Effectiveness
- Changes in attitudes or perceptions
- Brand, Social Issues, etc.
- Marketing Impact / Effectiveness
- New Product Launch
- Impact / Effectiveness
- Promotions Impact / Effectiveness

Types of Tracking Studies
There are many different types of tracking studies an organization might employ. The type of tracking study a brand or other organization may utilize depends on the type of information they are looking to gather and the goal of the research.
The diverse types of tracking studies include:

Online Customer Surveys
Brands and other organizations commonly use tracking studies that focus on their customers to understand how they change and evolve over time by continuously measuring buying patterns, habits, behaviors, attitudes, and demographics to identify shifts.
With each wave, you can collect feedback from customers on their habits, attitudes, perceptions, product awareness, emotions, and other key performance indicators, and compare them to previous waves to identify and understand changes in the brand’s consumersentiment
Insights gathered through these studies can help organizations make multi-million-dollar business decisions that can impact not only the brand, but the overall organization and its performance.
Receipt Tracking Surveys
Receipt tracking surveys take customer surveys to the next level. With customer surveys, brands, retailers, and other service providers are dependent on the respondents to self-identify if they are a customer. That is not the case with receipt tracking.
With receipt tracking, customers are required to upload their receipts to prove that they shopped at a specific store or bought a specific product. This allows brands to be more precise in their targeting of customers.
Non-Customer Surveys
This type of tracker study is like the customer survey, but the target audience is non-customers, neither current nor lapsed. Surveying non-customers, or even the general population on a consistent basis, can help an organization gather insights that can help measure and define items like:
Likelihood that potential buyers would switch brands/Customer loyalty
This study tracks the importance of price and/or other factors that buyers look at when comparing competing brands or products.
Awareness level of the product, brand, or organization among the general population
By conducting this type of survey, organizations can better evaluate their marketing plans or sales strategies, and adjust based on data-driven decisions, and overall win more business.
Employee Tracking Studies
While most tracking studies are focused on customers or potential customers, there are some that focus on employees. Employee tracking studies can be used to measure employee satisfaction, productivity, and engagement.
Employee tracking studies can help the human resources and executive teams understand what employees are feeling, while also helping identify any potential organizational issues so they can put plans in place to fix them.
Not only will it help identify organizational issues, but as you compare the tracking data wave-to-wave, you will be able to compare the results to benchmarks and identify areas of improvement.
Ad Effectiveness Studies
One of the more common tracker studies is an ad effectiveness tracker. In an advertising tracking study, marketers are looking to understand the effectiveness of their marketing efforts. For many marketers, campaign metrics only give one aspect of the story. It can be difficult to ascertain which components were impactful with consumers, and which may not have been. Ad effectiveness studies can help marketers and brands understand things like:
- Has brand awareness increased or declined?
- How do potential customers feel about our brand? (Both before and after a campaign, and if there was a change in brand perception.)
- Were consumers persuaded to purchase the product or service?
- Comparing data gathered from ad effectiveness studies from both customers and non-customers can be a great way to show how influential a marketing campaign was, and how much it has impacted consumer behaviors.
Best Practices for Tracking Studies
Given that tracker studies are some of the most important studies fielded in market research – with brands, consumer goods companies, and other organizations using them to base million-dollar decisions on – it is imperative that trackers provide the most accurate data possible.
To ensure that you get the best data out of your tracker, we have put together some best practices.
1. Know Your Sample Sources
Not every sample source is the same, and neither is the data they provide. It is critical to know your sample providers, how they recruit and manage their panel, their incentive structure, which devices respondents tend to take surveys on, and how suppliers invite their respondents. You should also be aware of their quality measures.
2. Use a Strategic Blend of Sources
Using a single source in your tracker study can cause a lot of problems, ranging from data bias, running out of sample, and over-representation of a single group, to data inconsistencies over time.
To avoid these problems, you should use a strategic blend of sample sources for your tracker studies. This means you take a systematic and deliberate approach in selecting and blending your sample suppliers. Doing so will allow you to avoid all the problems that a single source can cause, as well as ensure long-term success of your tracking study.
3. Adjust Over Time
While you want to keep as many variables as consistent as possible wave-to-wave, sample panels change over time. This is due to changes in their recruitment methods, incentive structure, panelist turnover, and more. As panel companies change, the data their respondents provide can also change. Every year you should evaluate your sample providers and look to see if you need to replace any to ensure that your overall sample plan remains stable, and your data remains reliable.
4. Overlay the Results with Current Market
Tracking studies can provide a wealth of data about your product or brand, as well as insights into purchasing behaviors. However, you should always look at what is going on in the marketplace and overlay the results. This will allow you to see if specific market events or conditions impact your data. Depending on the event, it could also explain any data anomalies or outliers when compared to previous waves.
5. Employ a Mobile-First Design Strategy
As with any type of online study, an ever-increasing number of respondents are taking surveys from their mobile devices, whether it’s from a phone or a tablet. This needs to be considered not only when you are designing your survey, but you should also look to make improvements wave-to-wave to ensure that the respondent experience is as good as it can be.
6. Shorter Questionnaires
Another aspect of respondent engagement that ensures you get the best results from your tracking studies is to ensure your questionnaires are not too long. You want to design your survey to ask the questions you want to gather your insights on but exclude any extraneous questions that might cause it to be longer than it needs to be. A tracking study is not the time to get “nice-to-have” insights.
History of Tracking Studies and Online Sample
In the old days of sampling, the best practice was leveraging a single sample source. The philosophy being that by using the same single source, you ensured data consistency wave-to-wave. Sample companies maintained similar panel management, ensuring that their panel was similar over time.
However, over the last few years, the perception of using a single sample source as a best practice diminished. There are a variety of factors that drove this change – mergers, technological advancements such as programmatic sampling, mobile apps, the interwovenness of providers because of API integrations, higher levels of fraud, providers plain running out of target respondents. All of this has led to a shift in market researchers using multiple sample sources for studies.
Researchers started using multiple sample sources out of necessity, not because they thought it was the best way to do it. Panel sources they had engaged for a study were falling short and they had to bring on additional sources to “top-up” the study. Demand certainly outpaced supply.

There are even times when a client or a researcher may have thought they were using a single source, but the supplier brought in other providers to fill needed completes or quotas their panel couldn’t achieve. This method of aggregating sample is known as “stacking” suppliers. Multiple suppliers are used because a single sample source cannot provide all the completes needed on a particular study.
Other sample sources are added at the end of the study to gather the rest of the needed completes. There is no magic number of sample sources added with this method; sources are simply added until the study has all the completes needed. Using this method can make closing studies feel like fire drills. It almost takes the control of your project away from you.
Blended Sample
Sample blending is the process of using multiple suppliers, but with a more planned and intentional method. It usually means using three or more different panels and setting limits on the number of completes each panel can get, so no one panel gets more than 50%.

EMI’s Approach to Tracking Studies
Consistency. It is one of the most key factors for any market researcher, especially ones conducting tracking studies. That is why EMI’s approach to tracking studies focuses on providing you accurate insights, long-term feasibility, and data consistency wave-to-wave. We do this by creating a strategic sample blend customized to your tracking studies, your needs, and your research goals. By creating a custom, strategic sample blend, EMI can ensure consistency and quality in your study.
Strategic Sample Blending
EMI is unique in that we don’t just blend sample for the sake of blending. We do it with quality and consistency in mind, understanding that not all techniques for combining multiple panel providers are created equal. In other methods of combining sample like stacking or aggregating, no care is given to panel makeup, respondents’ attitudes and behaviors, or panel bias, and is often done in a last-ditch effort to reach feasibility goals. EMI is different. We know that customizing a strategic blend based on clients’ unique needs will ensure the best results possible. So, what does strategic sample blending entail?
Strategic sample blending takes sample blending a step further. Not only do you use three or more sample providers, but the selection and blending of the selected providers is done in an intentional and controlled manner. Sample sources are selected to complement one another, while reducing the overall sample bias and any potential behavioral or attitudinal impacts a panel can have. This ensures not only the accuracy of your tracker’s data, but that it is truly representational of demographics, behavior, and attitudes of your target audience.
Additionally, by strategically selecting your providers and managing their allocation, you can increase your overall feasibility for the life of your tracker, avoiding the dreaded “top-up” situation that can skew your data. By strategically blending sample, you can ensure the consistency and reliability of your tracker and the data it provides, allowing you and your organization to make the best business decisions possible.
So, how do we do this? We start with a typical blend formula, then customize it based on a variety of criteria so that the strategic blend ensures you will meet the goals of your study. After taking all the factors into account, we develop your strategic blend by plotting out all the partners on the factors we discussed and by identifying panel partners that fit into the sweet spot to meet all the criteria, while providing consistency and feasibility for the life of the tracker. We also balance the partners on attitudes and behaviors to eliminate bias.
Strategic sample blending has several advantages:
- Improved Feasibility
- Improved Consistency
- Reduced Risk
- Reduced Field Time
Collaborating with clients, EMI serves as an extension of your market research team.
EMI’s network of 150 global partners can connect you with your target audience – Business, Consumer, or other specialty population – by connecting you with the right panel blends to measure and track attitudes, behaviors, and other opinions across the globe.
IntelliBlend®
IntelliBlend® is EMI’s unique methodology of strategically blending sample sources in an intentional and controlled approach in order to deliver the most representative and accurate demographic, behavioral, and attitudinal data. This approach includes double opt-in research panels but may also include non-traditional sources such as social media, which is utilized in a limited and controlled manner.
IntelliBlend® can vary from project-to-project based on the needs of the research. The unique blend is developed by leveraging proprietary research-on-research data as well as over 20 years of sample experience. For ongoing work, the custom sample plan is replicated from wave-to-wave utilizing EMI’s sample management platform, SWIFT, which enforces sample source quotas, thus ensuring data consistency.
Our Recommendations for Adjusting Your Tracking Study Over Time

There are numerous factors that may cause you to adjust the sample allocation of your providers, or your decision to work with specific sample providers, including:
- Changes in base size
- Changes in length of interview (LOI)
- Changes to the incidence rate (IR)
- Changes to the sample quotas
- Feasibility of one or more of your sample providers
- Poor or declining data quality
- Mergers/Acquisitions in the sample industry
Similarly, there is a variety of criteria that we can control when creating your blend, including:
- Attitudes and Behaviors by panel
- Client KPIs
- Feasibility
- Targeting Criteria
- Fielding Time & Fielding Criteria
- And much more

When you are looking to adjust your tracking studies, we have five key recommendations you should follow:
Monitor all KPIs by sample provider over time.
Have at least one or more sample provider that provides a small amount of completes per wave but can increase their allotment of completes if necessary.
Make slight adjustments to sample partner blends to start. Immediate major changes may have adverse impacts on KPIs.
Maintain full transparency between the research team, client team, and sample team and ensure everyone understands the advantages and disadvantages of adjusting the blend.
Work with a sample expert to help identify like panels to ensure minimal impact to KPIs.
Transitioning a Tracking Study to EMI
EMI’s strategic sample blending methodology ensures we can help you transition your brand tracking study, no matter the scenario you currently face, and build a strategic blend that is controlled and intentional to help you meet your study’s goals, while also reducing bias and ensuring consistency over time.
When you are looking to transition your tracking study, you should collaborate with an expert on the sample industry, not just one specific panel. We work with clients to transition their tracking studies all the time and have established a process that leads clients to have higher quality data and viability of their tracker long-term.
First, we conduct research-on-research on the sample industry to determine similarities and differences in attitudes and behaviors between sample providers. This allows us to examine the specific sample provider you are looking to replace, identify providers that have similar characteristics, and make recommendations on the replacement.
We also conduct a side-by-side comparison of your existing partner mix and our recommended panel blend to measure for consistency. No matter the scenario you face, EMI has a migration method that can help. To learn more about which method might be right for you, check out the video below.
Ready to take that next step?
Privacy overview.
How to Do Market Research: The Complete Guide
Learn how to do market research with this step-by-step guide, complete with templates, tools and real-world examples.
Access best-in-class company data
Get trusted first-party funding data, revenue data and firmographics
What are your customers’ needs? How does your product compare to the competition? What are the emerging trends and opportunities in your industry? If these questions keep you up at night, it’s time to conduct market research.
Market research plays a pivotal role in your ability to stay competitive and relevant, helping you anticipate shifts in consumer behavior and industry dynamics. It involves gathering these insights using a wide range of techniques, from surveys and interviews to data analysis and observational studies.
In this guide, we’ll explore why market research is crucial, the various types of market research, the methods used in data collection, and how to effectively conduct market research to drive informed decision-making and success.
What is market research?
Market research is the systematic process of gathering, analyzing and interpreting information about a specific market or industry. The purpose of market research is to offer valuable insight into the preferences and behaviors of your target audience, and anticipate shifts in market trends and the competitive landscape. This information helps you make data-driven decisions, develop effective strategies for your business, and maximize your chances of long-term growth.

Why is market research important?
By understanding the significance of market research, you can make sure you’re asking the right questions and using the process to your advantage. Some of the benefits of market research include:
- Informed decision-making: Market research provides you with the data and insights you need to make smart decisions for your business. It helps you identify opportunities, assess risks and tailor your strategies to meet the demands of the market. Without market research, decisions are often based on assumptions or guesswork, leading to costly mistakes.
- Customer-centric approach: A cornerstone of market research involves developing a deep understanding of customer needs and preferences. This gives you valuable insights into your target audience, helping you develop products, services and marketing campaigns that resonate with your customers.
- Competitive advantage: By conducting market research, you’ll gain a competitive edge. You’ll be able to identify gaps in the market, analyze competitor strengths and weaknesses, and position your business strategically. This enables you to create unique value propositions, differentiate yourself from competitors, and seize opportunities that others may overlook.
- Risk mitigation: Market research helps you anticipate market shifts and potential challenges. By identifying threats early, you can proactively adjust their strategies to mitigate risks and respond effectively to changing circumstances. This proactive approach is particularly valuable in volatile industries.
- Resource optimization: Conducting market research allows organizations to allocate their time, money and resources more efficiently. It ensures that investments are made in areas with the highest potential return on investment, reducing wasted resources and improving overall business performance.
- Adaptation to market trends: Markets evolve rapidly, driven by technological advancements, cultural shifts and changing consumer attitudes. Market research ensures that you stay ahead of these trends and adapt your offerings accordingly so you can avoid becoming obsolete.
As you can see, market research empowers businesses to make data-driven decisions, cater to customer needs, outperform competitors, mitigate risks, optimize resources and stay agile in a dynamic marketplace. These benefits make it a huge industry; the global market research services market is expected to grow from $76.37 billion in 2021 to $108.57 billion in 2026 . Now, let’s dig into the different types of market research that can help you achieve these benefits.
Types of market research
- Qualitative research
- Quantitative research
- Exploratory research
- Descriptive research
- Causal research
- Cross-sectional research
- Longitudinal research
Despite its advantages, 23% of organizations don’t have a clear market research strategy. Part of developing a strategy involves choosing the right type of market research for your business goals. The most commonly used approaches include:
1. Qualitative research
Qualitative research focuses on understanding the underlying motivations, attitudes and perceptions of individuals or groups. It is typically conducted through techniques like in-depth interviews, focus groups and content analysis — methods we’ll discuss further in the sections below. Qualitative research provides rich, nuanced insights that can inform product development, marketing strategies and brand positioning.
2. Quantitative research
Quantitative research, in contrast to qualitative research, involves the collection and analysis of numerical data, often through surveys, experiments and structured questionnaires. This approach allows for statistical analysis and the measurement of trends, making it suitable for large-scale market studies and hypothesis testing. While it’s worthwhile using a mix of qualitative and quantitative research, most businesses prioritize the latter because it is scientific, measurable and easily replicated across different experiments.
3. Exploratory research
Whether you’re conducting qualitative or quantitative research or a mix of both, exploratory research is often the first step. Its primary goal is to help you understand a market or problem so you can gain insights and identify potential issues or opportunities. This type of market research is less structured and is typically conducted through open-ended interviews, focus groups or secondary data analysis. Exploratory research is valuable when entering new markets or exploring new product ideas.
4. Descriptive research
As its name implies, descriptive research seeks to describe a market, population or phenomenon in detail. It involves collecting and summarizing data to answer questions about audience demographics and behaviors, market size, and current trends. Surveys, observational studies and content analysis are common methods used in descriptive research.
5. Causal research
Causal research aims to establish cause-and-effect relationships between variables. It investigates whether changes in one variable result in changes in another. Experimental designs, A/B testing and regression analysis are common causal research methods. This sheds light on how specific marketing strategies or product changes impact consumer behavior.
6. Cross-sectional research
Cross-sectional market research involves collecting data from a sample of the population at a single point in time. It is used to analyze differences, relationships or trends among various groups within a population. Cross-sectional studies are helpful for market segmentation, identifying target audiences and assessing market trends at a specific moment.
7. Longitudinal research
Longitudinal research, in contrast to cross-sectional research, collects data from the same subjects over an extended period. This allows for the analysis of trends, changes and developments over time. Longitudinal studies are useful for tracking long-term developments in consumer preferences, brand loyalty and market dynamics.
Each type of market research has its strengths and weaknesses, and the method you choose depends on your specific research goals and the depth of understanding you’re aiming to achieve. In the following sections, we’ll delve into primary and secondary research approaches and specific research methods.
Primary vs. secondary market research
Market research of all types can be broadly categorized into two main approaches: primary research and secondary research. By understanding the differences between these approaches, you can better determine the most appropriate research method for your specific goals.
Primary market research
Primary research involves the collection of original data straight from the source. Typically, this involves communicating directly with your target audience — through surveys, interviews, focus groups and more — to gather information. Here are some key attributes of primary market research:
- Customized data: Primary research provides data that is tailored to your research needs. You design a custom research study and gather information specific to your goals.
- Up-to-date insights: Because primary research involves communicating with customers, the data you collect reflects the most current market conditions and consumer behaviors.
- Time-consuming and resource-intensive: Despite its advantages, primary research can be labor-intensive and costly, especially when dealing with large sample sizes or complex study designs. Whether you hire a market research consultant, agency or use an in-house team, primary research studies consume a large amount of resources and time.
Secondary market research
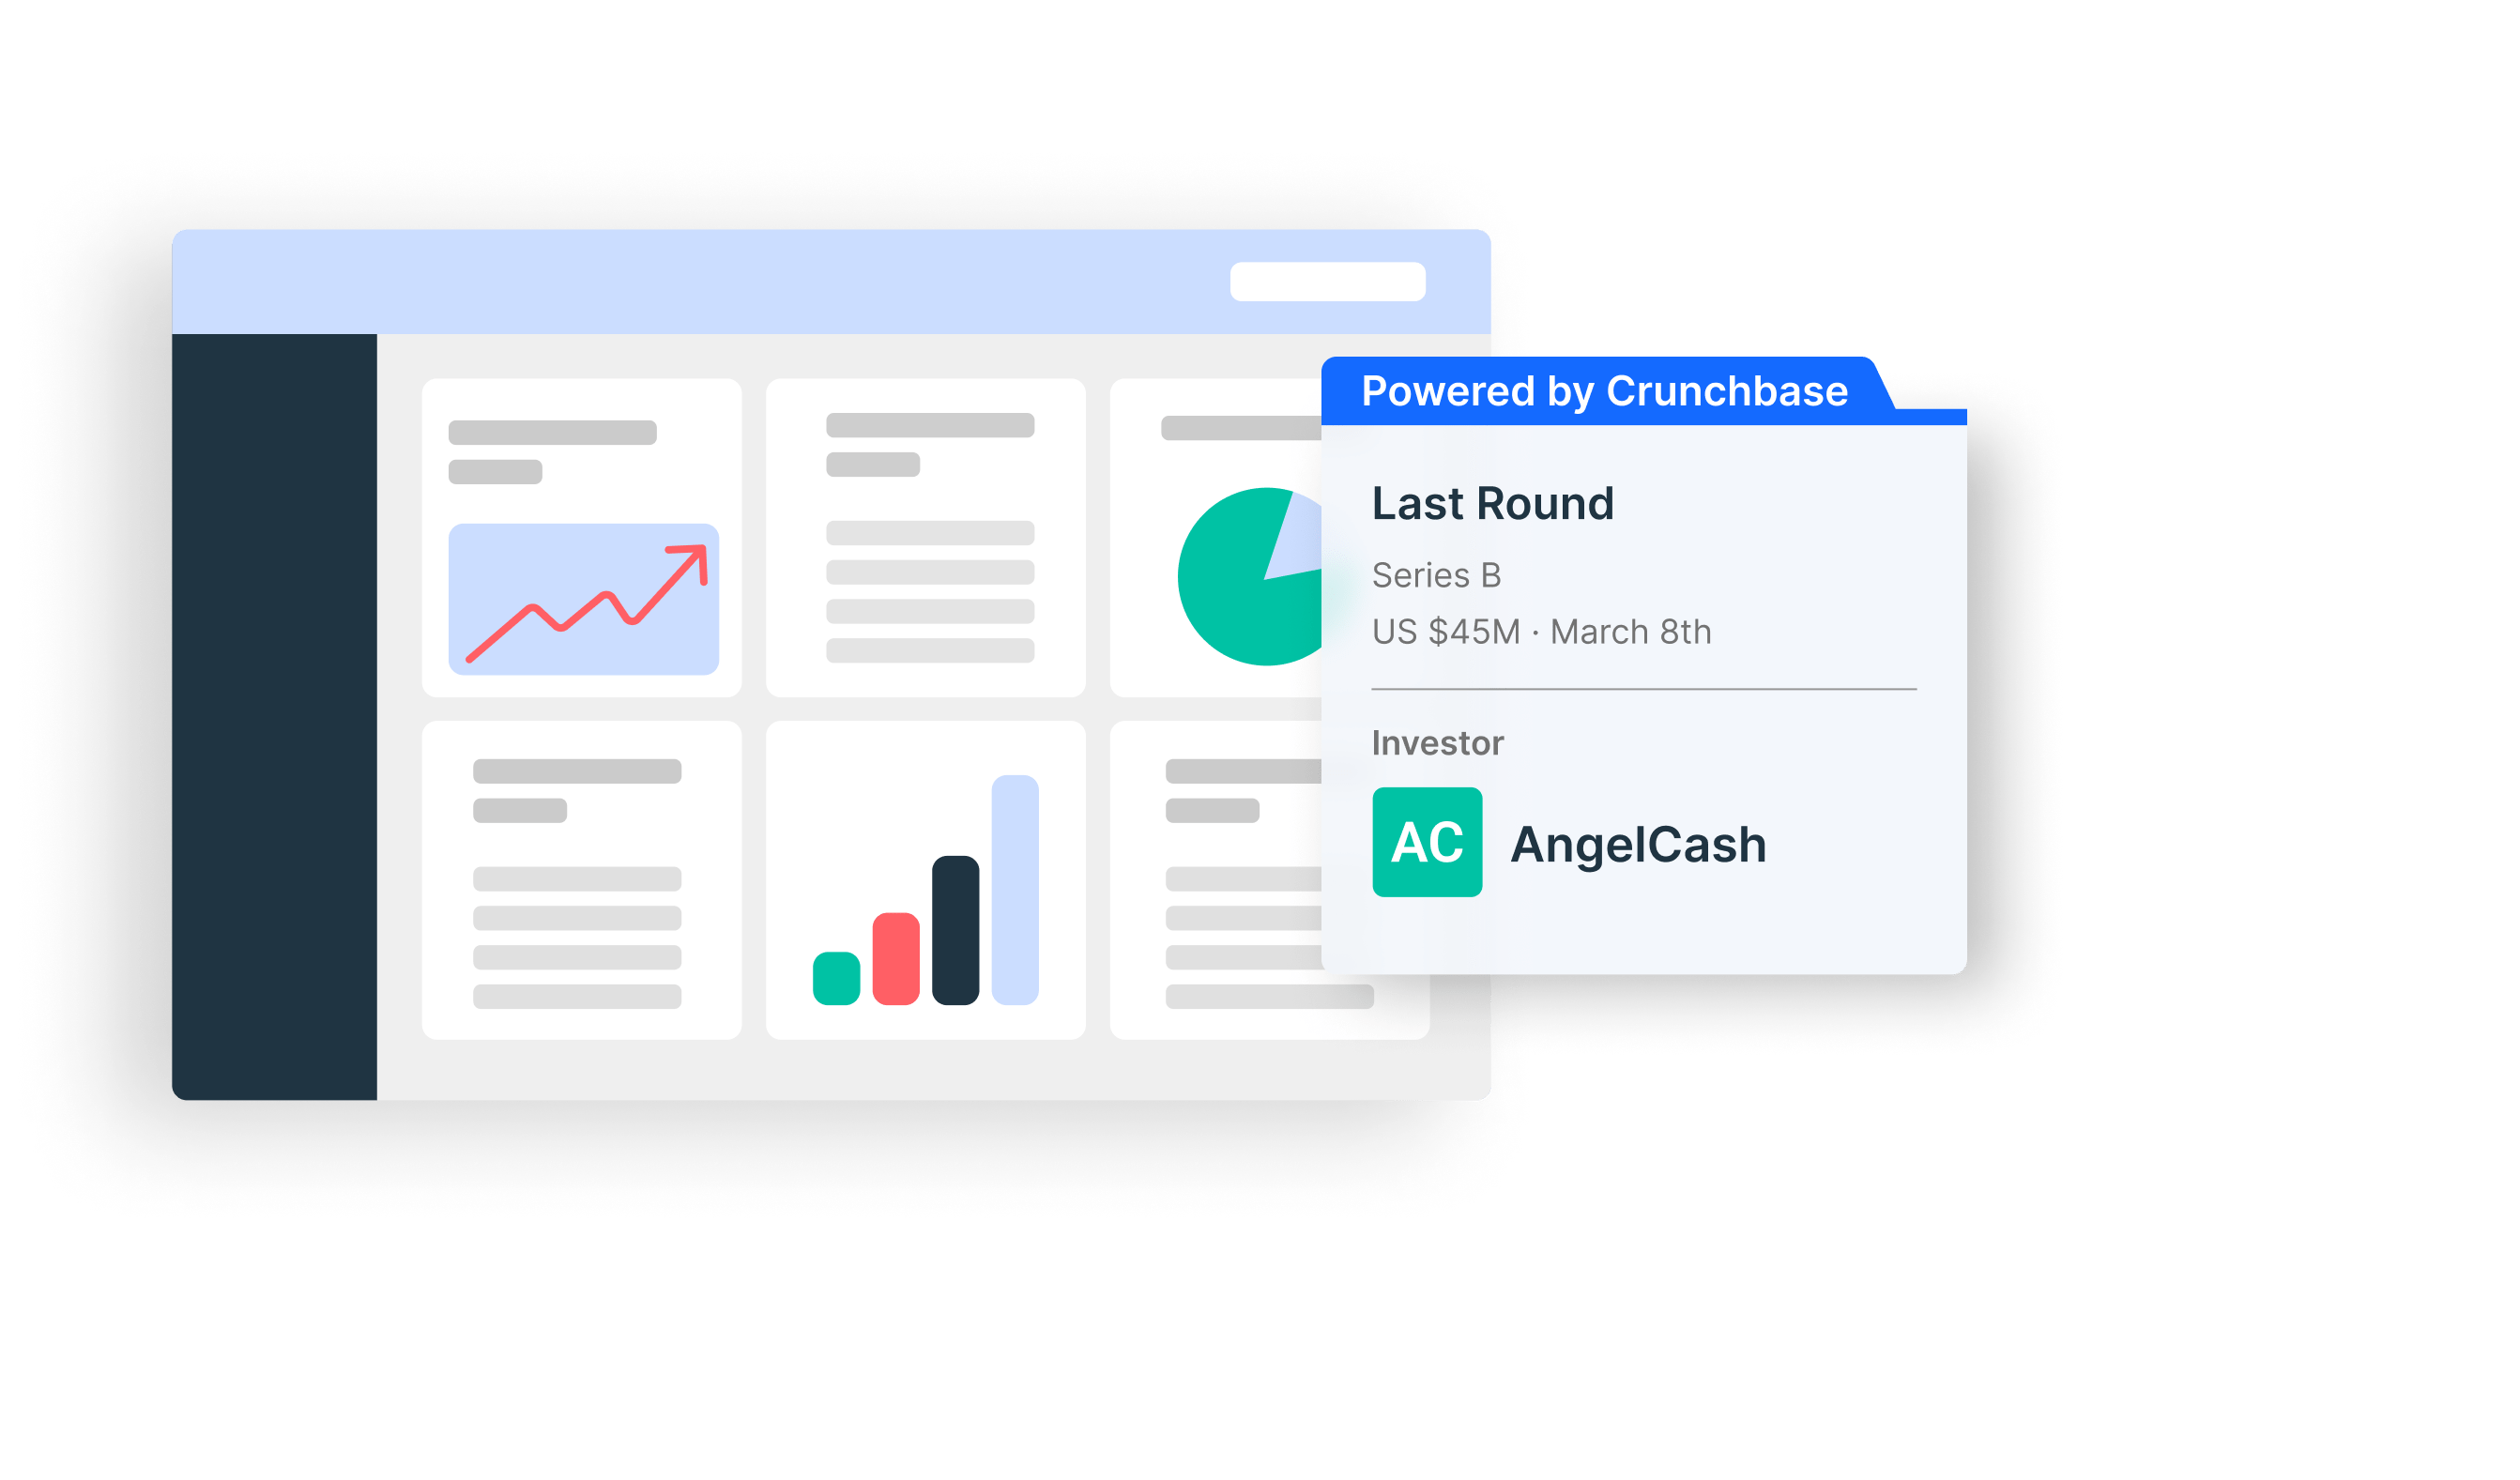
Secondary research, on the other hand, involves analyzing data that has already been compiled by third-party sources, such as online research tools, databases, news sites, industry reports and academic studies.
Here are the main characteristics of secondary market research:
- Cost-effective: Secondary research is generally more cost-effective than primary research since it doesn’t require building a research plan from scratch. You and your team can look at databases, websites and publications on an ongoing basis, without needing to design a custom experiment or hire a consultant.
- Leverages multiple sources: Data tools and software extract data from multiple places across the web, and then consolidate that information within a single platform. This means you’ll get a greater amount of data and a wider scope from secondary research.
- Quick to access: You can access a wide range of information rapidly — often in seconds — if you’re using online research tools and databases. Because of this, you can act on insights sooner, rather than taking the time to develop an experiment.
So, when should you use primary vs. secondary research? In practice, many market research projects incorporate both primary and secondary research to take advantage of the strengths of each approach.
One rule of thumb is to focus on secondary research to obtain background information, market trends or industry benchmarks. It is especially valuable for conducting preliminary research, competitor analysis, or when time and budget constraints are tight. Then, if you still have knowledge gaps or need to answer specific questions unique to your business model, use primary research to create a custom experiment.
Market research methods
- Surveys and questionnaires
- Focus groups
- Observational research
- Online research tools
- Experiments
- Content analysis
- Ethnographic research
How do primary and secondary research approaches translate into specific research methods? Let’s take a look at the different ways you can gather data:
1. Surveys and questionnaires
Surveys and questionnaires are popular methods for collecting structured data from a large number of respondents. They involve a set of predetermined questions that participants answer. Surveys can be conducted through various channels, including online tools, telephone interviews and in-person or online questionnaires. They are useful for gathering quantitative data and assessing customer demographics, opinions, preferences and needs. On average, customer surveys have a 33% response rate , so keep that in mind as you consider your sample size.
2. Interviews
Interviews are in-depth conversations with individuals or groups to gather qualitative insights. They can be structured (with predefined questions) or unstructured (with open-ended discussions). Interviews are valuable for exploring complex topics, uncovering motivations and obtaining detailed feedback.
3. Focus groups
The most common primary research methods are in-depth webcam interviews and focus groups. Focus groups are a small gathering of participants who discuss a specific topic or product under the guidance of a moderator. These discussions are valuable for primary market research because they reveal insights into consumer attitudes, perceptions and emotions. Focus groups are especially useful for idea generation, concept testing and understanding group dynamics within your target audience.
4. Observational research
Observational research involves observing and recording participant behavior in a natural setting. This method is particularly valuable when studying consumer behavior in physical spaces, such as retail stores or public places. In some types of observational research, participants are aware you’re watching them; in other cases, you discreetly watch consumers without their knowledge, as they use your product. Either way, observational research provides firsthand insights into how people interact with products or environments.
5. Online research tools
You and your team can do your own secondary market research using online tools. These tools include data prospecting platforms and databases, as well as online surveys, social media listening, web analytics and sentiment analysis platforms. They help you gather data from online sources, monitor industry trends, track competitors, understand consumer preferences and keep tabs on online behavior. We’ll talk more about choosing the right market research tools in the sections that follow.
6. Experiments
Market research experiments are controlled tests of variables to determine causal relationships. While experiments are often associated with scientific research, they are also used in market research to assess the impact of specific marketing strategies, product features, or pricing and packaging changes.
7. Content analysis
Content analysis involves the systematic examination of textual, visual or audio content to identify patterns, themes and trends. It’s commonly applied to customer reviews, social media posts and other forms of online content to analyze consumer opinions and sentiments.
8. Ethnographic research
Ethnographic research immerses researchers into the daily lives of consumers to understand their behavior and culture. This method is particularly valuable when studying niche markets or exploring the cultural context of consumer choices.
How to do market research
- Set clear objectives
- Identify your target audience
- Choose your research methods
- Use the right market research tools
- Collect data
- Analyze data
- Interpret your findings
- Identify opportunities and challenges
- Make informed business decisions
- Monitor and adapt
Now that you have gained insights into the various market research methods at your disposal, let’s delve into the practical aspects of how to conduct market research effectively. Here’s a quick step-by-step overview, from defining objectives to monitoring market shifts.
1. Set clear objectives
When you set clear and specific goals, you’re essentially creating a compass to guide your research questions and methodology. Start by precisely defining what you want to achieve. Are you launching a new product and want to understand its viability in the market? Are you evaluating customer satisfaction with a product redesign?
Start by creating SMART goals — objectives that are specific, measurable, achievable, relevant and time-bound. Not only will this clarify your research focus from the outset, but it will also help you track progress and benchmark your success throughout the process.
You should also consult with key stakeholders and team members to ensure alignment on your research objectives before diving into data collecting. This will help you gain diverse perspectives and insights that will shape your research approach.
2. Identify your target audience
Next, you’ll need to pinpoint your target audience to determine who should be included in your research. Begin by creating detailed buyer personas or stakeholder profiles. Consider demographic factors like age, gender, income and location, but also delve into psychographics, such as interests, values and pain points.
The more specific your target audience, the more accurate and actionable your research will be. Additionally, segment your audience if your research objectives involve studying different groups, such as current customers and potential leads.
If you already have existing customers, you can also hold conversations with them to better understand your target market. From there, you can refine your buyer personas and tailor your research methods accordingly.
3. Choose your research methods
Selecting the right research methods is crucial for gathering high-quality data. Start by considering the nature of your research objectives. If you’re exploring consumer preferences, surveys and interviews can provide valuable insights. For in-depth understanding, focus groups or observational research might be suitable. Consider using a mix of quantitative and qualitative methods to gain a well-rounded perspective.
You’ll also need to consider your budget. Think about what you can realistically achieve using the time and resources available to you. If you have a fairly generous budget, you may want to try a mix of primary and secondary research approaches. If you’re doing market research for a startup , on the other hand, chances are your budget is somewhat limited. If that’s the case, try addressing your goals with secondary research tools before investing time and effort in a primary research study.
4. Use the right market research tools
Whether you’re conducting primary or secondary research, you’ll need to choose the right tools. These can help you do anything from sending surveys to customers to monitoring trends and analyzing data. Here are some examples of popular market research tools:
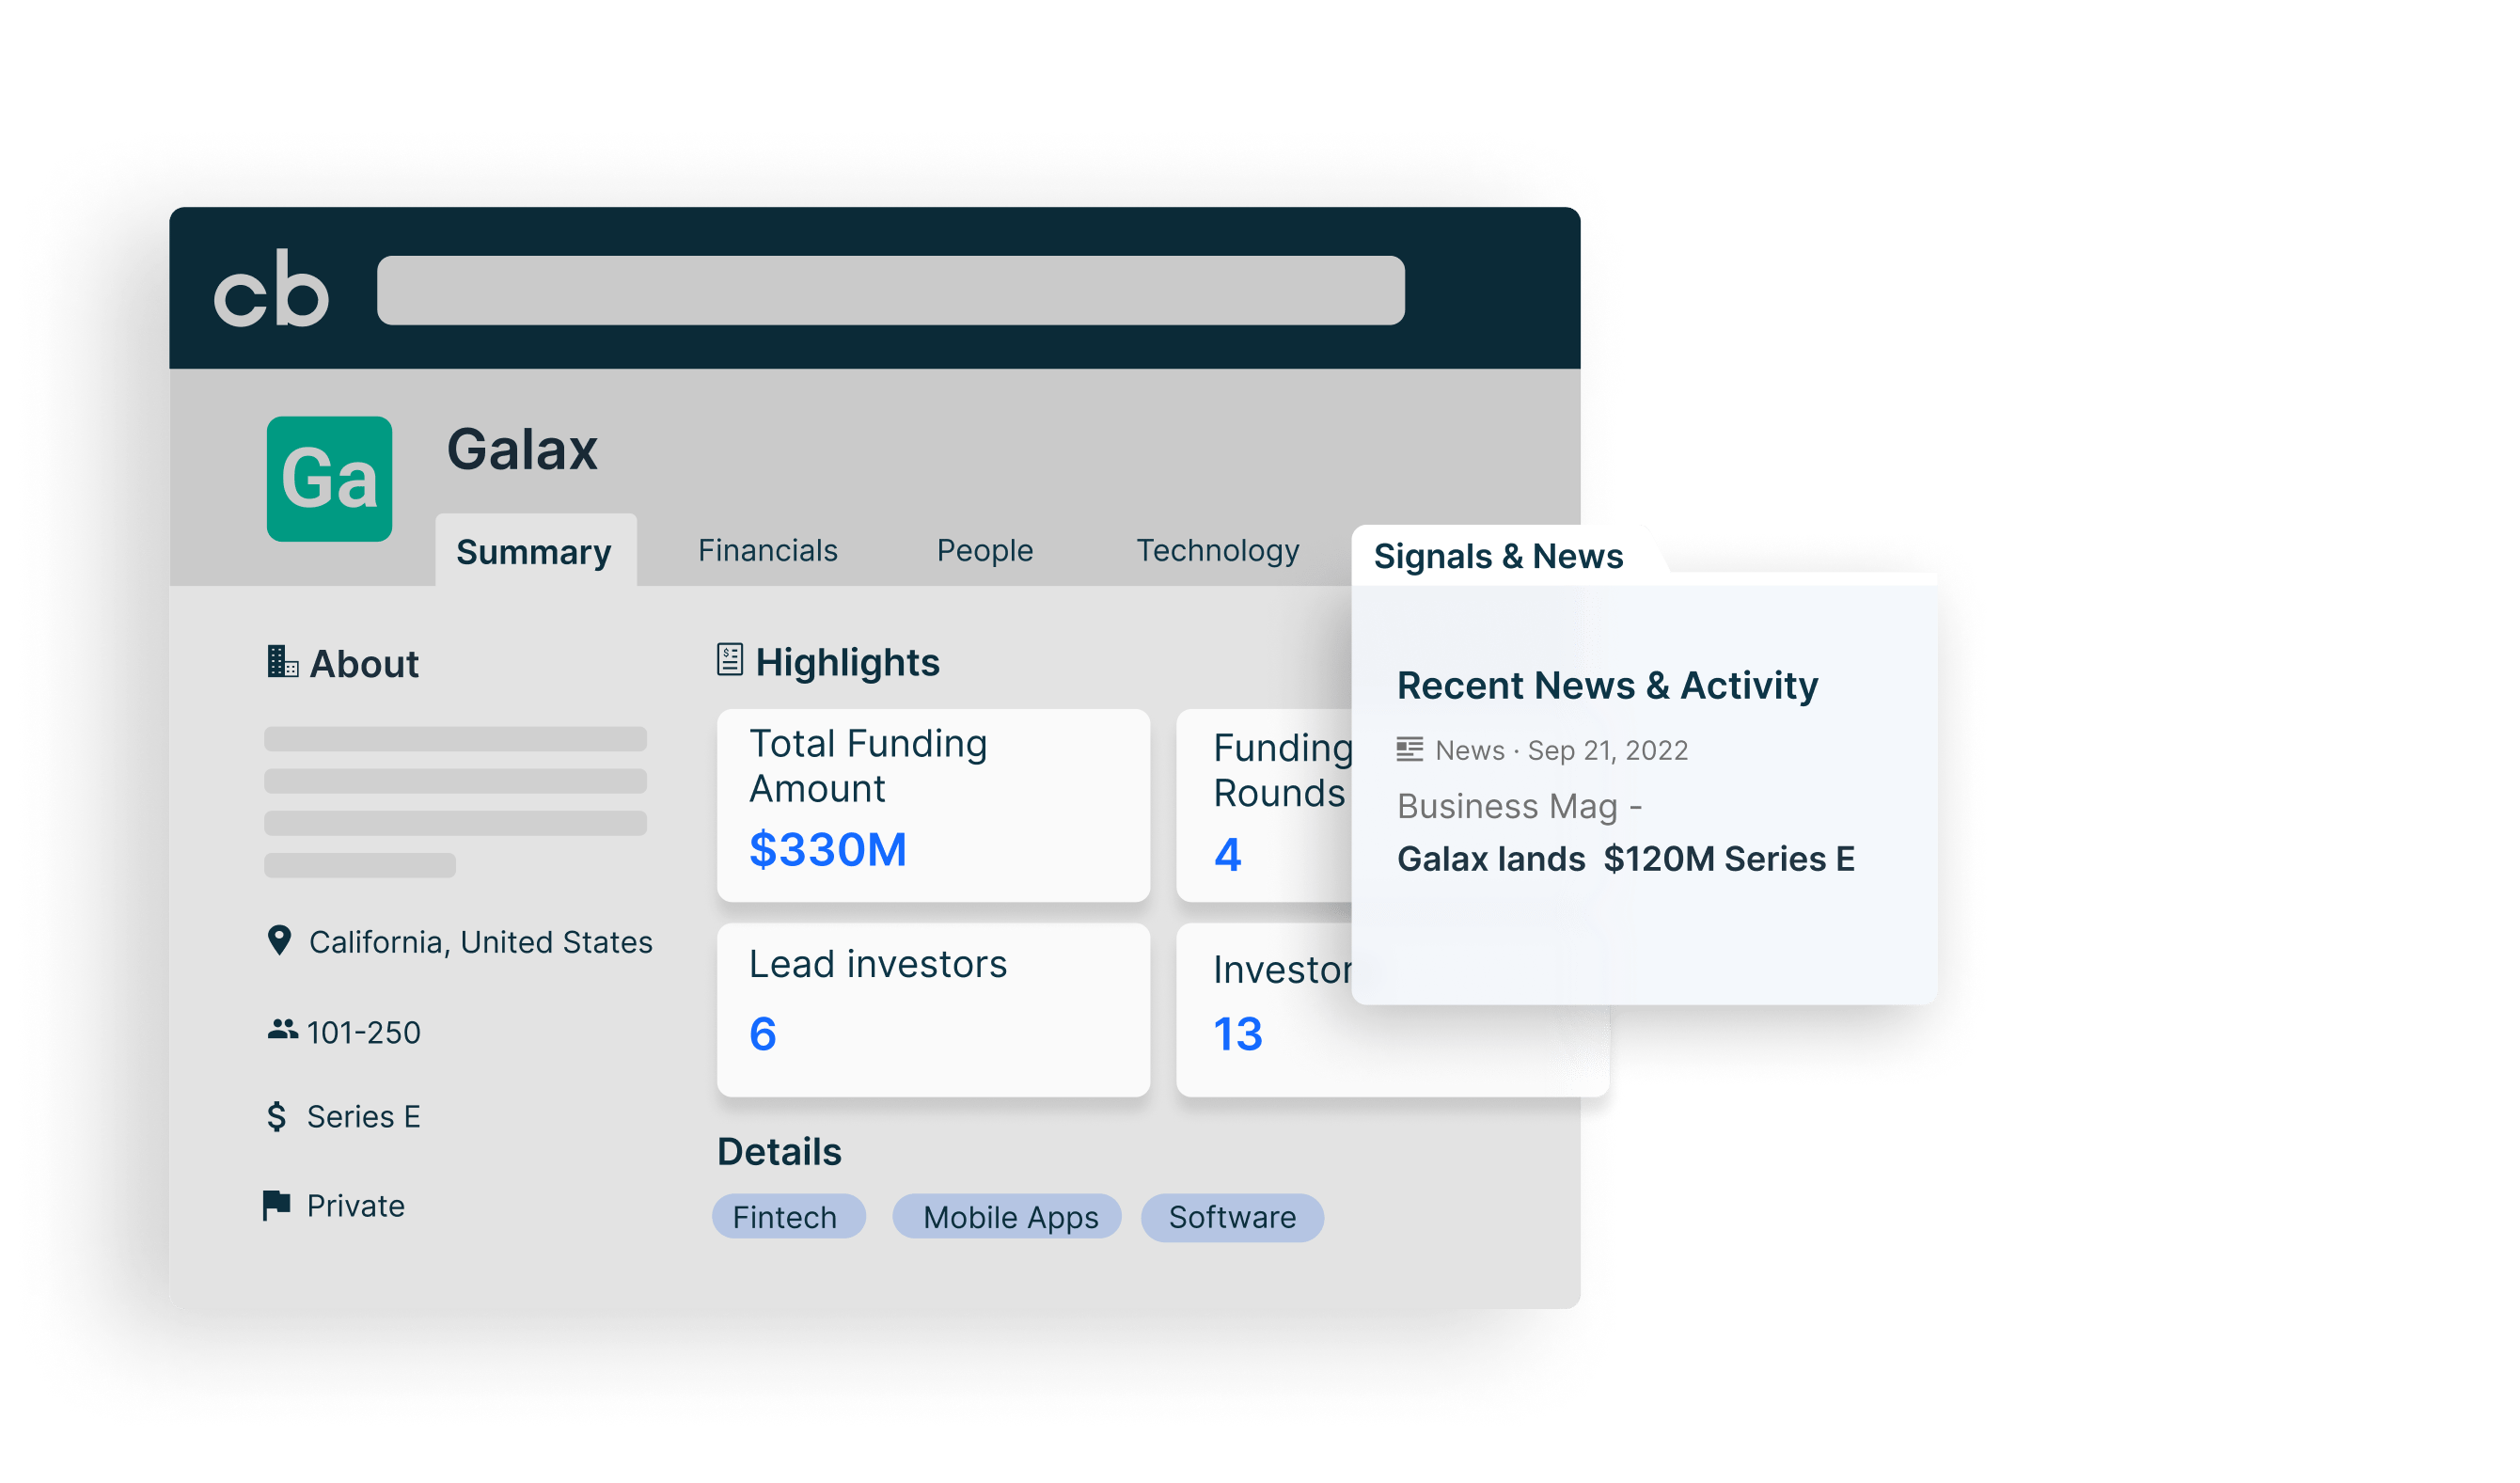
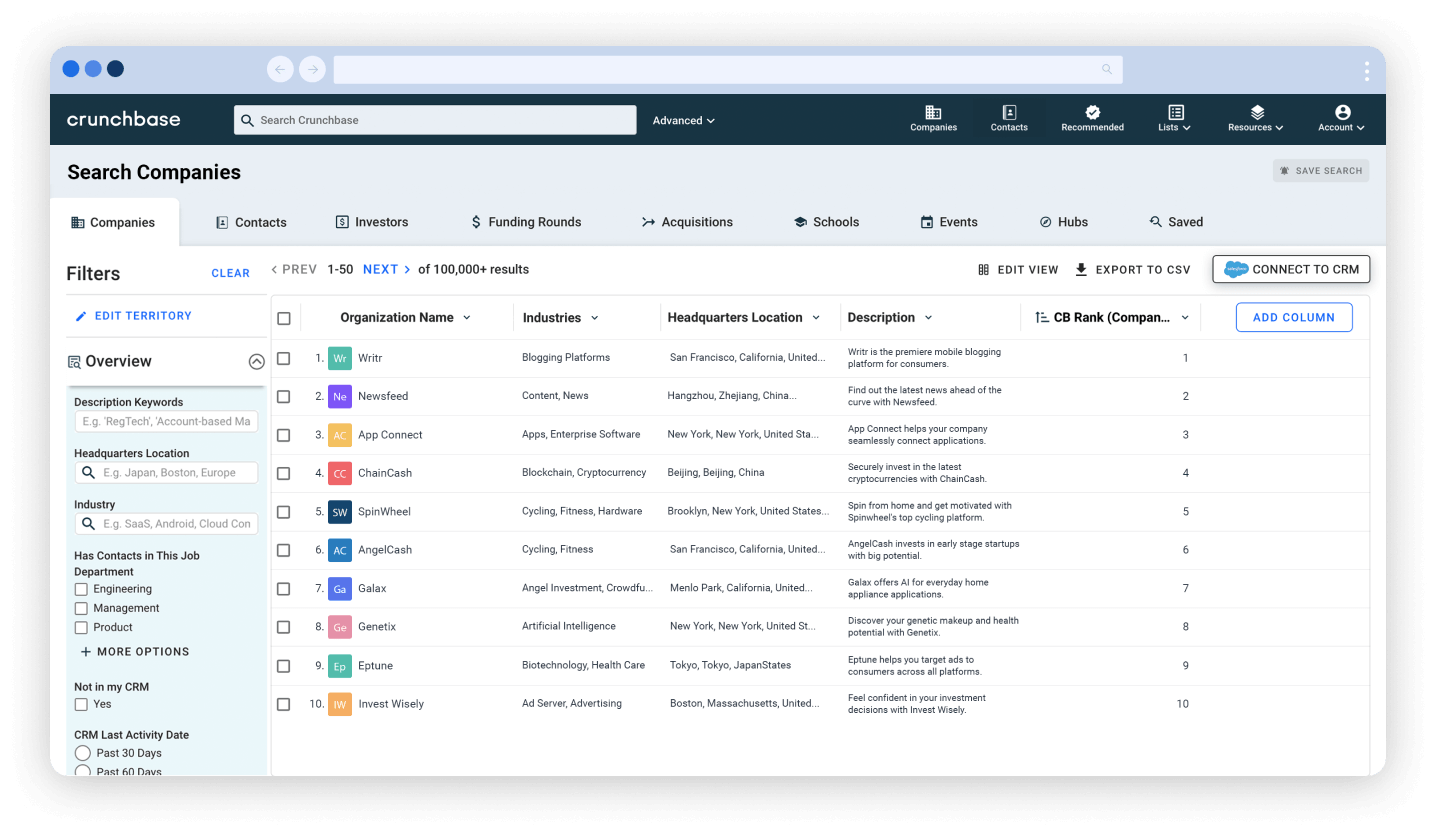
- Market research software: Crunchbase is a platform that provides best-in-class company data, making it valuable for market research on growing companies and industries. You can use Crunchbase to access trusted, first-party funding data, revenue data, news and firmographics, enabling you to monitor industry trends and understand customer needs.
- Survey and questionnaire tools: SurveyMonkey is a widely used online survey platform that allows you to create, distribute and analyze surveys. Google Forms is a free tool that lets you create surveys and collect responses through Google Drive.
- Data analysis software: Microsoft Excel and Google Sheets are useful for conducting statistical analyses. SPSS is a powerful statistical analysis software used for data processing, analysis and reporting.
- Social listening tools: Brandwatch is a social listening and analytics platform that helps you monitor social media conversations, track sentiment and analyze trends. Mention is a media monitoring tool that allows you to track mentions of your brand, competitors and keywords across various online sources.
- Data visualization platforms: Tableau is a data visualization tool that helps you create interactive and shareable dashboards and reports. Power BI by Microsoft is a business analytics tool for creating interactive visualizations and reports.
5. Collect data
There’s an infinite amount of data you could be collecting using these tools, so you’ll need to be intentional about going after the data that aligns with your research goals. Implement your chosen research methods, whether it’s distributing surveys, conducting interviews or pulling from secondary research platforms. Pay close attention to data quality and accuracy, and stick to a standardized process to streamline data capture and reduce errors.
6. Analyze data
Once data is collected, you’ll need to analyze it systematically. Use statistical software or analysis tools to identify patterns, trends and correlations. For qualitative data, employ thematic analysis to extract common themes and insights. Visualize your findings with charts, graphs and tables to make complex data more understandable.
If you’re not proficient in data analysis, consider outsourcing or collaborating with a data analyst who can assist in processing and interpreting your data accurately.
7. Interpret your findings
Interpreting your market research findings involves understanding what the data means in the context of your objectives. Are there significant trends that uncover the answers to your initial research questions? Consider the implications of your findings on your business strategy. It’s essential to move beyond raw data and extract actionable insights that inform decision-making.
Hold a cross-functional meeting or workshop with relevant team members to collectively interpret the findings. Different perspectives can lead to more comprehensive insights and innovative solutions.
8. Identify opportunities and challenges
Use your research findings to identify potential growth opportunities and challenges within your market. What segments of your audience are underserved or overlooked? Are there emerging trends you can capitalize on? Conversely, what obstacles or competitors could hinder your progress?
Lay out this information in a clear and organized way by conducting a SWOT analysis, which stands for strengths, weaknesses, opportunities and threats. Jot down notes for each of these areas to provide a structured overview of gaps and hurdles in the market.
9. Make informed business decisions
Market research is only valuable if it leads to informed decisions for your company. Based on your insights, devise actionable strategies and initiatives that align with your research objectives. Whether it’s refining your product, targeting new customer segments or adjusting pricing, ensure your decisions are rooted in the data.
At this point, it’s also crucial to keep your team aligned and accountable. Create an action plan that outlines specific steps, responsibilities and timelines for implementing the recommendations derived from your research.
10. Monitor and adapt
Market research isn’t a one-time activity; it’s an ongoing process. Continuously monitor market conditions, customer behaviors and industry trends. Set up mechanisms to collect real-time data and feedback. As you gather new information, be prepared to adapt your strategies and tactics accordingly. Regularly revisiting your research ensures your business remains agile and reflects changing market dynamics and consumer preferences.
Online market research sources
As you go through the steps above, you’ll want to turn to trusted, reputable sources to gather your data. Here’s a list to get you started:
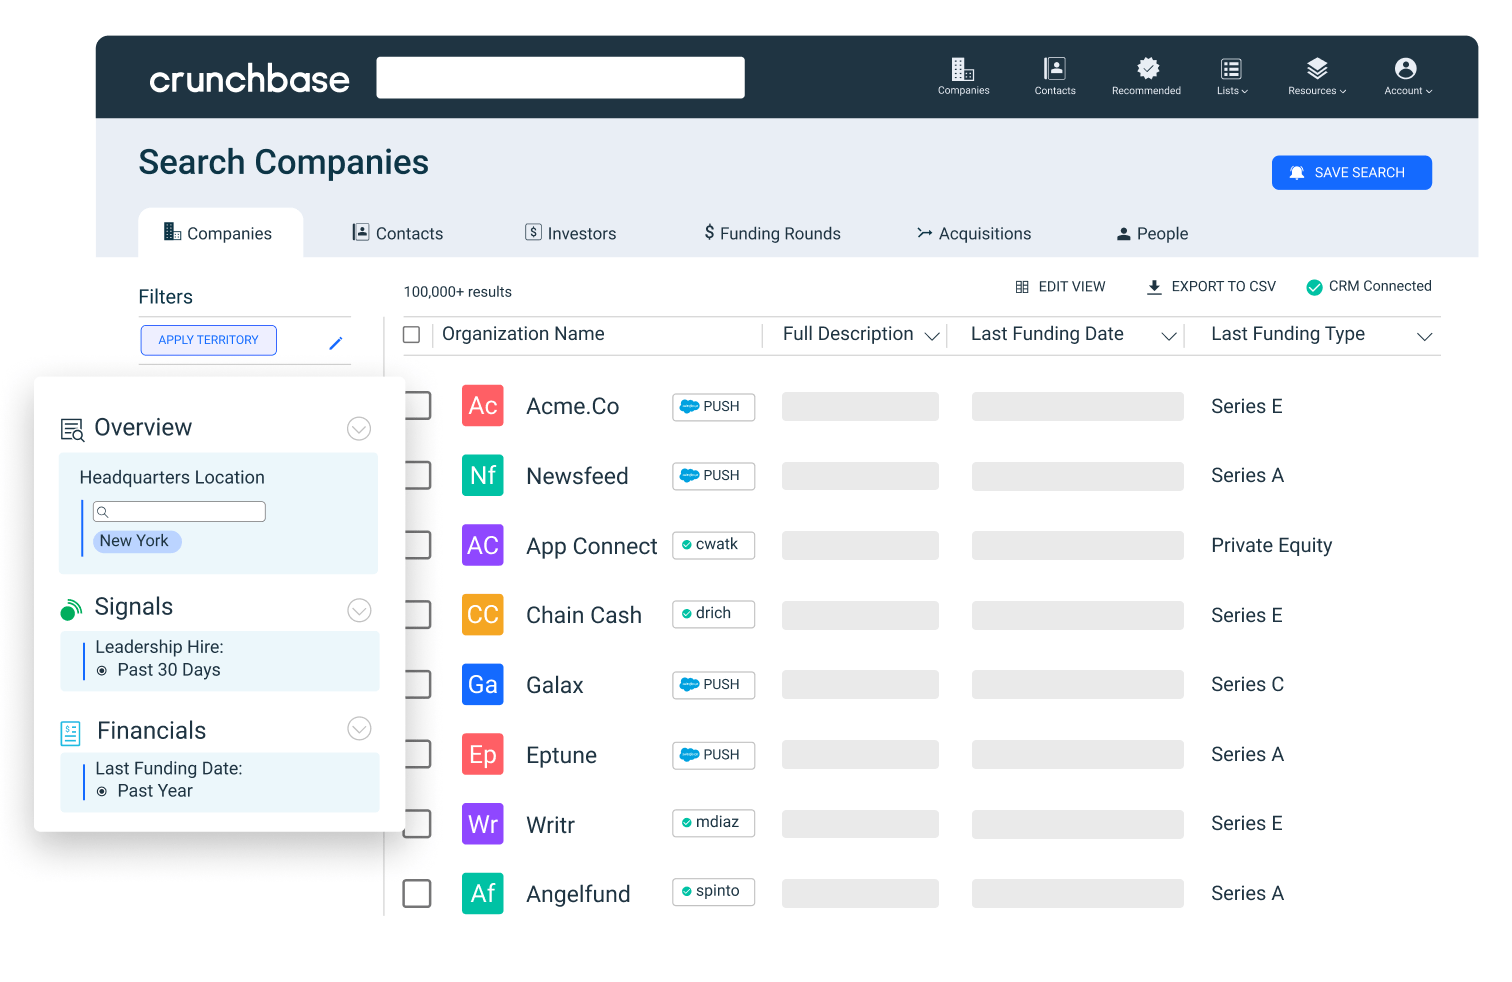
- Crunchbase: As mentioned above, Crunchbase is an online platform with an extensive dataset, allowing you to access in-depth insights on market trends, consumer behavior and competitive analysis. You can also customize your search options to tailor your research to specific industries, geographic regions or customer personas.
- Academic databases: Academic databases, such as ProQuest and JSTOR , are treasure troves of scholarly research papers, studies and academic journals. They offer in-depth analyses of various subjects, including market trends, consumer preferences and industry-specific insights. Researchers can access a wealth of peer-reviewed publications to gain a deeper understanding of their research topics.
- Government and NGO databases: Government agencies, nongovernmental organizations and other institutions frequently maintain databases containing valuable economic, demographic and industry-related data. These sources offer credible statistics and reports on a wide range of topics, making them essential for market researchers. Examples include the U.S. Census Bureau , the Bureau of Labor Statistics and the Pew Research Center .
- Industry reports: Industry reports and market studies are comprehensive documents prepared by research firms, industry associations and consulting companies. They provide in-depth insights into specific markets, including market size, trends, competitive analysis and consumer behavior. You can find this information by looking at relevant industry association databases; examples include the American Marketing Association and the National Retail Federation .
- Social media and online communities: Social media platforms like LinkedIn or Twitter (X) , forums such as Reddit and Quora , and review platforms such as G2 can provide real-time insights into consumer sentiment, opinions and trends.
Market research examples
At this point, you have market research tools and data sources — but how do you act on the data you gather? Let’s go over some real-world examples that illustrate the practical application of market research across various industries. These examples showcase how market research can lead to smart decision-making and successful business decisions.
Example 1: Apple’s iPhone launch
Apple ’s iconic iPhone launch in 2007 serves as a prime example of market research driving product innovation in tech. Before the iPhone’s release, Apple conducted extensive market research to understand consumer preferences, pain points and unmet needs in the mobile phone industry. This research led to the development of a touchscreen smartphone with a user-friendly interface, addressing consumer demands for a more intuitive and versatile device. The result was a revolutionary product that disrupted the market and redefined the smartphone industry.
Example 2: McDonald’s global expansion
McDonald’s successful global expansion strategy demonstrates the importance of market research when expanding into new territories. Before entering a new market, McDonald’s conducts thorough research to understand local tastes, preferences and cultural nuances. This research informs menu customization, marketing strategies and store design. For instance, in India, McDonald’s offers a menu tailored to local preferences, including vegetarian options. This market-specific approach has enabled McDonald’s to adapt and thrive in diverse global markets.
Example 3: Organic and sustainable farming
The shift toward organic and sustainable farming practices in the food industry is driven by market research that indicates increased consumer demand for healthier and environmentally friendly food options. As a result, food producers and retailers invest in sustainable sourcing and organic product lines — such as with these sustainable seafood startups — to align with this shift in consumer values.
The bottom line? Market research has multiple use cases and is a critical practice for any industry. Whether it’s launching groundbreaking products, entering new markets or responding to changing consumer preferences, you can use market research to shape successful strategies and outcomes.
Market research templates
You finally have a strong understanding of how to do market research and apply it in the real world. Before we wrap up, here are some market research templates that you can use as a starting point for your projects:
- Smartsheet competitive analysis templates : These spreadsheets can serve as a framework for gathering information about the competitive landscape and obtaining valuable lessons to apply to your business strategy.
- SurveyMonkey product survey template : Customize the questions on this survey based on what you want to learn from your target customers.
- HubSpot templates : HubSpot offers a wide range of free templates you can use for market research, business planning and more.
- SCORE templates : SCORE is a nonprofit organization that provides templates for business plans, market analysis and financial projections.
- SBA.gov : The U.S. Small Business Administration offers templates for every aspect of your business, including market research, and is particularly valuable for new startups.
Strengthen your business with market research
When conducted effectively, market research is like a guiding star. Equipped with the right tools and techniques, you can uncover valuable insights, stay competitive, foster innovation and navigate the complexities of your industry.
Throughout this guide, we’ve discussed the definition of market research, different research methods, and how to conduct it effectively. We’ve also explored various types of market research and shared practical insights and templates for getting started.
Now, it’s time to start the research process. Trust in data, listen to the market and make informed decisions that guide your company toward lasting success.
Related Articles

- Entrepreneurs
- 15 min read
What Is Competitive Analysis and How to Do It Effectively
Rebecca Strehlow, Copywriter at Crunchbase

17 Best Sales Intelligence Tools for 2024
- Market research
- 10 min read
How to Do Market Research for a Startup: Tips for Success
Jaclyn Robinson, Senior Manager of Content Marketing at Crunchbase
Search less. Close more.
Grow your revenue with Crunchbase, the all-in-one prospecting solution. Start your free trial.

- Company History
- Executive Team
- Banking, Finance, and Insurance
- Business-to-Business
- Consumer Packaged Goods (FMCG)
- Governmental Agencies
- Home Improvement & Trade Research
- Pharma, Medical, Health, and Wellness
- Restaurants
- Social Responsibility/Social Causes
- Technology Sector
- Client List
- Quality Assurance
- Data Security
- Advertising Testing Systems
- Advertising Tracking Research
- Awareness Trial Usage (ATUs)
- Brand Equity Monitoring
- Category Management
- Education Survey Research
- Economic Development Research
- Concept Testing
- Customer Loyalty Simulator
- Mail Surveys
- Data Entry Services
- Multilingual Coding
- Cross-Tabulation Services
- Employee Satisfaction Research
- Employee Retention
- Global Research
- American Home Comfort Study
- Economic Index
- Marketing Strategy
- Brand Name Research
- DecisionSystems
- Technology Forecasting
- Global Internet Panels
- Online Communities
- Panel Management
- Private Online Research Panels
- ESOMAR 28 Questions
- Simulated Shopping with Shelf Sets
- Custom/Ad Hoc Packaging Research
- Optima Product Testing
- Custom Product Testing
- Product Quality Monitoring
- Sensory Research Systems
- Promotion Testing
- Shopping Research
- Strategy Research
Tracking Research
- Win-Loss Research
- Meet Our Moderators
- Digital Ethnography
- In the Moment Research
- Large-Scale Qualitative
- Online Qualitative
- Qualitative Research (Focus Groups)
- Unconventional Qualitative Methods
- Qualitative Research Library
- Analytical Consulting
- Choice Modeling Techniques
- Conceptor Volumetric Forecasting
- Demand Forecasting
- Economic Feasibility Analysis
- Economic Impact Analysis
- Econometric Modeling
- Marketing Science
- Marketing Mix Modeling
- Market Segmentation Methods
- Operations Research
- Predictive Analytics & Marketing Research
- Text Mining
- Pricing Research
- Sales Forecasting and Sales Modeling
- Acquisition Reviews
- Asset Optimization
- GIS mapping
- Location Analysis
- Shopping Center Repositioning
- The Imaginators®
- Relevant Innovation
- Brand Explorations
- Jerry W. Thomas Blogs
- Audrey Guinn Blogs
- Bonnie Janzen Blogs
- Clay Dethloff Blogs
- Elizabeth Horn Blogs
- Felicia Rogers Blogs
- Heather Kluter Blogs
- Jennifer Murphy Blogs
- John Colias Blogs
- Julie Trujillo Blogs
- Lesley Johnson Blogs
- Tom Allen Blogs
- Blog Archives 2017-2021
- Case Histories
- Download Our Complimentary Report
- Economic Index Background
- Email Newsletter
- Free Software
- Videos - General Marketing Research
- Videos - Leadership Strategy Interviews
- Videos - Market Segmentation
- Videos - Media Mix Minute
- Videos - Strategy Series
- Webinars - Insider Series
White Papers
- Research Advice
New and established products give rise to the need for tracking awareness, trial, usage, and image (either continuously or periodically).
- Advertising Tracking (CopyTrack®)
Attitudinal/Image Tracking
Attitudes and images within, and relative to, a product category change over time. Every two to three years (depending upon this rate of change), a comprehensive attitudinal/image assessment is desirable to serve as a platform for marketing planning, new product development, and competitive intelligence.
New Product/Test Market Tracking
Systematically monitoring awareness, trial, and repeat purchase rates for new products is a valuable application of telephone tracking or Internet-based tracking. Usually this tracking data is combined with other data (shipments, store audits, scanner data, and distribution checks) for a full evaluation of the test market.
- Customer Experience Optimization & Loyalty Tracking
This can be an important component in the overall marketing research plan, as long as it is carefully planned and limited in its demands upon customers (lest we offend them with customer satisfaction surveys). Sometimes, the very best customer satisfaction tracking does not involve any formal surveys. We strive to help our clients design and implement efficient and unobtrusive satisfaction measurement systems.
Brand Equity Monitor™
Decision Analyst’s Brand Equity Monitor™ is a comprehensive metric that measures relative brand preference, based on all aspects of the brand including both rational and emotional perceptions of the products/services, customer service, images, and supply or availability in the marketplace.
Tracking Research Services
For more information on Tracking Research, please contact Jerry W. Thomas , President/CEO, by emailing him at [email protected] , or by calling 1-800-ANALYSIS (262-5974) or 1-817-640-6166 .
Watch Our Tracking Research Video
- View More Videos
- Dark Energy in the Digital Age
- Small Business Survival
- Survival Of The Fittest
How to conduct a brand tracking study
What is a brand tracking study, why are brand tracking studies so vital, what brand health metrics should you be tracking, different types of brand tracking studies, how to conduct a brand tracking study in 7 steps, brand tracking made easy with attest.
Are all those creative juices from your team flowing in the right direction? Is your brand getting more well-known, more popular, or more loved—or is it a combination of the three?

Where your brand stands today is crucial knowledge to inform tomorrow’s strategy. Yet, a lot of businesses tend to not take stock, launching campaigns left and right without creating a benchmark.
If you want to do things differently—i.e. better—you’ve come to the right place. Here we’ll walk you through the essentials of running brand tracking studies .
A brand tracking study is a research method used to track the perception of a particular brand over time. This type of study can be used to assess how well a brand is performing, identify any changes in perception that need to be addressed, and determine what factors might be influencing the public’s perception of the brand.
How to track your brand with Attest
Learn what people REALLY think about your brand—and how this affects their likelihood to buy—with a brand tracking study
Would you want to know what people are thinking of you at all times? Personally, probably not.
But for businesses, things are a little different. You can and should ask consumers how they feel about them, because ultimately, you create a brand, product, or service for them—your target audience.
That’s why it’s incredibly important to measure things like brand awareness, brand perception and other brand health metrics. Not just once, but over time, regularly, to figure out if you’re on the right path to charming your consumers.
Brand tracking will shine a light on which actions and campaigns have contributed in a positive way to your brand health , and which ones were not such great ideas. This will serve as incredible fuel for your future decisions.
Brand tracking metrics are super important to measure because they can provide insights into how customers view a company and its products, over time.
Measuring brand health can help businesses track the effectiveness of their marketing campaigns and identify any areas where they may need to improve their brand strategy.
Additionally, tracking brand health can help you spot any potential problems early and take corrective action. Here’s which key metrics from brand tracking studies we encourage you to track to make sure you’re on top of your overall brand health.
Brand reputation
A brand’s reputation is an important aspect to track in your market research, as it can have a big impact on whether people trust your brand enough to spend their money with you.
There are a number of factors that can influence a brand’s reputation, including the quality of the product or service, customer service, marketing and advertising efforts, and the company’s overall ethical and social responsibility.

Brand perception
Brand perception refers to the way your brand makes people think and feel. Much like reputation, it can be affected by a variety of factors, such as the quality of the product or service, the company’s reputation, marketing and advertising efforts, and customer service.
When tracking brand perception, it’s important to measure ALL perceptions—positive, negative and everything in between.
- Brand awareness
Brand awareness is one of the most important metrics to measure in your brand tracking research. It measures how well the public is aware of a particular brand and can be used to gauge the success of marketing campaigns and other promotional activities.
Measuring brand awareness over time can help you identify any changes in perception and determine what factors might be influencing the level of awareness people have of your brand.
Brand recall
Recall is a metric used in market research to measure how often a customer remembers a brand. This can be done through surveys, where customers are asked if they remember a certain brand. This is often used to measure the effect of a marketing campaign. Bear in mind: recall is not the same as brand recognition. Learn more about the difference between recall and recognition.
Brand equity
Brand equity measures the value of a brand, in the context of your market and competitors.
There are four main elements that make up brand equity:
- Loyalty to your brand
- Perceived quality
- Brand association
When you bring together all of these elements, you’ll begin to understand how much of your market belongs to you and how much your brand is worth.

Brand loyalty
Loyalty to your brand is a key measure of brand health, as it indicates how likely customers are to stick with a particular brand, which is especially important if you’re trying to increase your customer lifetime value (CLV).
There are a number of factors that can influence loyalty, including the quality of your product or service, your brand’s reputation, marketing and advertising efforts, and customer service.
Branding linkage
Would you be able to tell which advertisement is from our business? What about if we remove any logos or slogans in order for the audience?
Branding linkage = Brand association after a ‘non-branded’ content effort
If a viewer can associate an unbranded marketing effort from your business as being connected to your business, you’re on the right track. If not, you need to reconsider some creative decisions.
Branded searches
Branded searches are when a person searches for a specific product or company on the internet. They are usually looking for information about the company, such as the address or phone number, or they are looking to buy a product from the company. Branded searches can also be used to track how well a company is doing online. For instance, people googling ‘Nike running shoes’ shows their branding success: they’re not simply looking for ‘running shoes’.
NPS (Net Promoter Score)
The net promoter score (NPS) is a metric used to measure customer loyalty and is calculated by asking customers how likely they are to recommend a brand to others. Your NPS number is based on the answer to the question “how likely are you to recommend our company/product/service to a friend or colleague?” Respondents then give their answer on a range from 1 to 10. It’s a classic when it comes to brand tracking.
Brand favorability
A brand’s favorability is a measure of whether people favor your brand over another or not. Bear in mind: this doesn’t necessarily show whether they love you. They might favor your brand over your arch enemy—but it’s still possible they don’t like either of you. Combine it with purchase intent and market share to learn more.
Want to know more about brand health metrics before starting your brand tracking survey? Here are the 14 most important brand health metrics!
Why are these brand health metrics so important?
Businesses traditionally look at metrics such as customer retention, sales, profit and market share. But combining these numbers over time with the knowledge you gather from your brand tracking study, will show you what has affected those retention, sales and profit numbers.

We have some bad news—you can’t just throw a few metrics in the blender and call it a brand tracking survey. Your brand tracking studies should inform the long-term brand strategy you’ve laid out for your business. Here are some examples of brand tracking studies.
Tracking marketing efforts and campaign effectiveness
The metrics you’ll be using: brand awareness/perception/reputation (depending on the goal of the campaign), brand linking, branded searches.
Next time you launch a big advertising campaign, set up a brand tracking study alongside it. You’ll be measuring right before the campaign, right after and an X amount of months after the campaign to see its long-term impact on your brand. Depending on the goal of the campaign, you can focus on awareness, perception, or reputation.
Tracking customer satisfaction/feedback
The metrics you’ll be using: brand’s loyalty, brand favorability, brand reputation.
How is the relationship with your current customers evolving over time? How can you increase customer loyalty, and turn existing customers into advocates for organic brand growth? This is what you’ll be measuring if you focus on this type of brand tracking study. You can track changes in the relationship, and see what effect price changes, new products, new competing brands and other events in your product category have.
Tracking your brand’s health among non-customers
The metrics you’ll be using: brand awareness, branded searches, brand perception.
It’s crucial to also keep an eye on people who aren’t your customers—yet… Are they becoming at least more aware of your brand? What misconceptions do they have about you? What’s your general reputation? But make sure you balance your target audiences right: there’s no use in collecting data from people who will never be your customers; however don’t forget about the influence non-customers might have over the purchasing decisions your actual customers might make.
Tracking your brand amongst (possible) employees
The metrics you’ll be using: brand awareness, brand perception and brand reputation
It’s not just potential customers you want to impress—it’s future employees, too. A great way to keep your hiring process sharp is by infusing it with a brand tracking study that revolves around your reputation amongst jobseekers.

Tracking your brand alongside other brands
The metrics you’ll be using: brand awareness, NPS, branding linkage
Market research is incredibly versatile, so find something that fits your goals! If you want to get more insights in how you’re performing in your target market, track brand health against competition. You can check what new competitors, consumer behavior and other unexpected events do to performance metrics such as business growth, market penetration and brand usage.
Now you’ve seen that there are different types of brand tracking studies, you understand that there is not just one road that leads there. But in general, there are some steps you simply can’t miss if you want to make your brand tracking study the success it deserves to be.
Step 1: Set a goal and corresponding metrics
Choosing the right metrics for your brand tracking study can be tricky. You want to make sure you’re measuring the things that are important to your business, but you also need to make sure they’re relevant to your customers.
Follow your strategy: what are you focusing on in the next 5 years? Is it building stronger relationships with current customers? Gathering more customers? Let this lead the way to choosing the right metrics.
Step 2: Select an audience
When selecting your target audience for a brand tracking study, it’s important to be as specific as possible. Trying to measure the awareness and perception of a brand among the general public is a daunting task, and you’ll likely get more useful information by narrowing down your focus.
Will you be focusing on current customers who’ve been with you for a while? New customers? Or do you want to learn the purchase intent for the ones whose heart you have yet to conquer? Make sure it makes sense with the metrics you choose.
Step 3: Ask the right questions
You’re in luck! We’ve written several guides about which survey questions you can ask for certain metrics. We’ll just leave them here:
- 100 Great Survey Questions and Examples
- Brand Perception Survey: Questions, Examples and Template
- 16 Brand positioning survey questions that work
- 24 brand image survey questions for real insights
- And we have a whole learning hub, with loads of guides on brand tracking —head over to our Consumer Research Academy !
Step 4: Collect that data!
When it comes to data collection for your brand tracking study, there are a few different ways to go about it. The most common way is through surveys, but you can also look at other numbers such as customer retention rates, profit and loss statements, and social media analytics. No matter how you collect the data, make sure they match periods and audiences.
Track your brand with Attest
Set up a regular brand tracker to see how your awareness and perception are changing over time—and spot trends before they become an issue!
Step 5: Analyze, analyze, analyze
Once you’ve gathered all your data, it’s time to start analyzing it. This is where you’ll see what trends are emerging with your brand—the good, the bad and the neutral.
Are people becoming more aware of your brand? What do they think of your products? How does customer satisfaction change over time?
There are a million questions you can get answered in the data you get, but make sure to stay focused on the goal of your research.
Step 6: And then… Action!
Once you’ve gathered all your data, it’s time to start acting on it. Which campaigns do more harm than good? What is attracting customers to your competitors? How can you become more proactive to keep them on board?

Step 7: Repeat regularly
This is where the tracking part comes in. Brand tracking isn’t something you should do once and forget thereafter. How often you will conduct these studies depends on the length of them. You can also choose to run smaller surveys more often that focus on specific parts of your larger brand tracking study.
Bonus step: Create context with competitors
With this step you’re going the extra mile in your brand tracking study. Let’s say your NPS is a big part of your brand tracking study, because your long-term goal is to grow your brand from the inside out, gathering more customers organically.
A handy trick to give more context in your study, is to not only measure your own metrics, but compare yourself to a competitor. So, if you ask respondents for your own NPS, also ask about another brand. This will put the number in perspective and will guide your decisions a whole lot better.
Alright, what else do you need for your first brand tracking study? Is it templates? Help from an expert researcher? More resources for the true DIYers?
We’ve got it all! Attest is here for all levels of brand trackers. We’ve created some handy templates that will have your online survey up and running in no time. Have a look and play around with it to make it yours!
If you are keen to get started but want to ask an expert for their opinion, let’s chat. All our users get access to brand tracking researchers who have done this rodeo over and over, and are eager to put their latest insights to use in your survey.
The Experts’ Guide to Brand Tracking
How to look at the impact of things like audience reach, panel diversity, and survey design to help you decide whether your current brand tracker is up to scratch.

VP Customer Success
Sam joined Attest in 2019 and leads the Customer Research Team. Sam and her team support brands through their market research journey, helping them carry out effective research and uncover insights to unlock new areas for growth.
Related articles
7 brand intelligence software to collect insights, brand tracking, will travelers be more risk-averse in q4, open-ended survey questions: definition, examples and tips, subscribe to our newsletter.
Fill in your email and we’ll drop fresh insights and events info into your inbox each week.
* I agree to receive communications from Attest. Privacy Policy .
You're now subscribed to our mailing list to receive exciting news, reports, and other updates!
The Ultimate Guide to Market Research [+Free Templates]
A comprehensive guide on Market Research with tools, examples of brands winning with research, and templates for surveys, focus groups + presentation template.
Rakefet is the CMO at Mayple. She manages all things marketing and leads our community of experts through live events, workshops, and expert interviews. MBA, 1 dog + 2 cats, and has an extensive collection of Chinese teas.
Learn about our
Natalie is a content writer and manager who is passionate about using her craft to empower others. She thrives on team dynamic, great coffee, and excellent content. One of these days, she might even get to her own content ideas.
Updated February 26, 2024.
![market research studies tracking The Ultimate Guide to Market Research [+Free Templates] main image](https://entail.mayple.com/en-assets/mayple/62b4087370d3b5eab8bfb6b6_marketingresearch1_e2786f4e8b966e44f1401562fa23c07b_2000-1699776197229.jpg)
Before you do anything in business you have to have a good grasp of the market. What’s the market like? Who are your competitors? And what are the pain points and challenges of your ideal customer? And how can you solve them? Once you have the answers to those questions then you are ready to move forward with a marketing plan and/or hire a digital marketing agency to execute it.
In this guide we break down what market research is, the different types of market research, and provide you with some of the best templates, tools, and examples, to help you execute it on your own.
Excited to learn?
Let’s dive in.
What is market research?
Market research is the process of gathering information about your target market and customers to determine the success of your product or service, make changes to your existing product, or understand the perception of your brand in the market.
“Research is formalized curiosity, it is poking and prying with a purpose.” - Zora Neale Hurston
We hear the phrase "product-market fit" all the time and that just means that a product solves a customer's need in the market. And it's very hard to get there without proper market research. Now, I know what you're going to say. Why not get actionable insights from your existing customers? Why not do some customer research?
The problem with customer research is two-fold:
- You have a very limited amount of data as your current customers don't represent the entire market.
- Customer research can introduce a lot of bias into the process.
So the real way to solve these issues is by going broader and conducting some market research.
Why do market research?
There are many benefits of doing market research for your company. Here are a few of them:
- Understand how much demand exists in the market, the market size
- Discover who your competitors are and where they are falling short.
- Better understand the needs of your target customers and the problems and pain points your product solves.
- Learn what your potential customers feel about your brand.
- Identify potential partners and new markets and opportunities.
- Determine which product features you should develop next.
- Find out what your ideal customer is thinking and feeling.
- Use these findings to improve your brand strategy and marketing campaigns.
“The goal is to transform data into information, and information into insight.” - Carly Fiorina
Market research allows you to make better business decisions at every stage of your business and helps you launch better products and services for your customers.
Primary vs secondary research
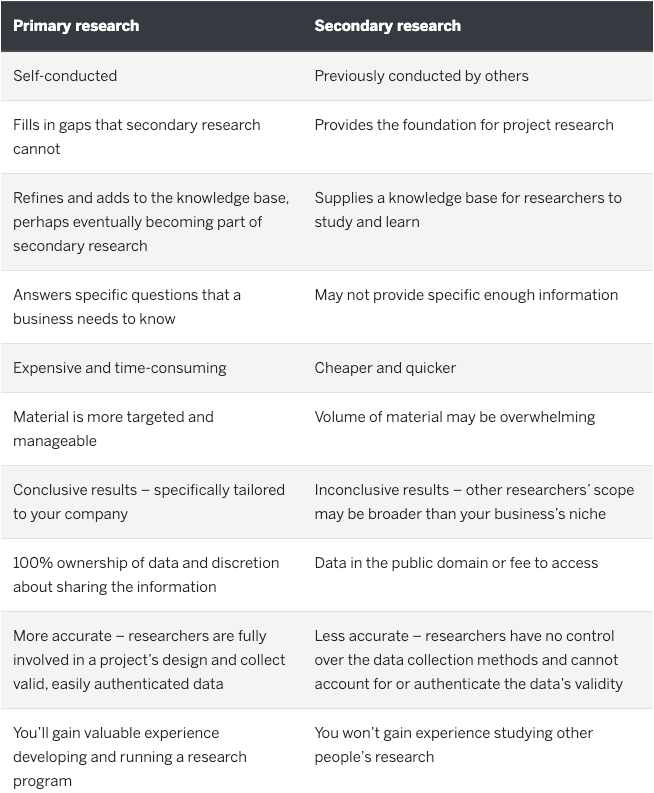
There are two main types of market research - primary and secondary research.
Primary research
Primary market research is when researchers collect information directly, instead of relying on outside sources of information. It could be done through interviews, online surveys, or focus groups and the advantage here is that the company owns that information. The disadvantage of using primary sources of information is that it's usually more expensive and time-consuming than secondary market research.
Secondary research
Secondary market research involves using existing data that is summarized and collected by third parties. Secondary sources could be commercial sources or public sources like libraries, other websites, blogs , government agencies, and existing surveys. It's data that's more readily available and it's usually much cheaper than conducting primary research.
Qualitative vs quantitative research
Qualitative research is about gathering qualitative data like the market sentiment about the products currently available on the market (read: words and meanings). Quantitative research deals with numbers and statistics. It's data that is numbers-based, countable, and measurable.
Types of market research
1. competitive analysis.
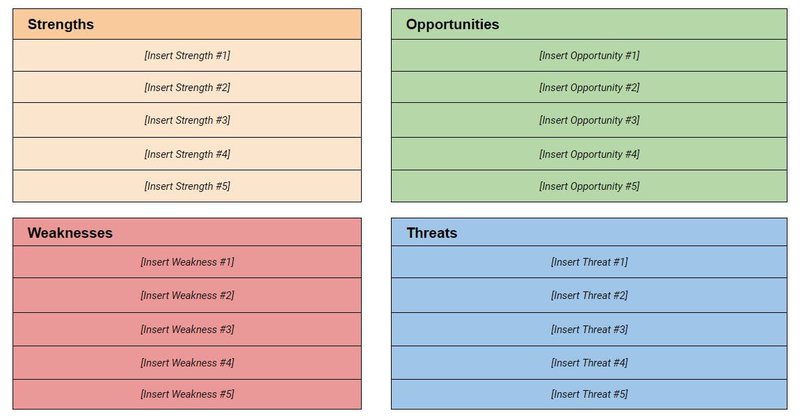
Every business needs to know its own strengths and weaknesses and how they compare with its largest competitors in the market. It helps brands identify gaps in the market, develop new products and services, uncover market trends, improve brand positioning , and increase their market share. A SWOT analysis is a good framework to use for this type of research.
2. Consumer insights
It's also equally important to know what consumers are thinking, what the most common problems are and what products they are purchasing. Consumer research can be done through social listening which involves tracking consumer conversations on social media. It could also include analyzing audiences of brands , online communities, and influencers, and analyzing trends in the market.
3. Brand awareness research
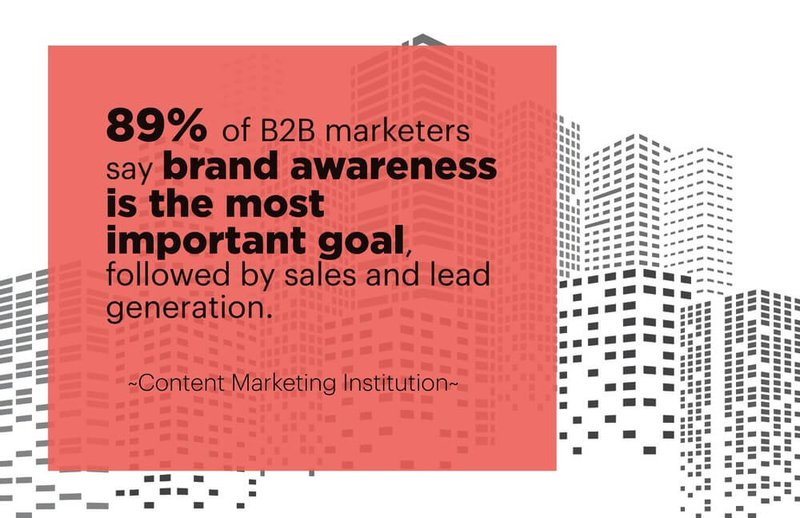
Brand awareness is a super important metric for understanding how well your target audience knows your brand. It's used to assess brand performance and the marketing effectiveness of a brand. It tells you about the associations consumers make when they think of your brand and what they believe you're all about.
4. Customer satisfaction research
Customer satisfaction and loyalty are two really important levers for any business and you don't have to conduct in-depth interviews to get that information. There is a wide range of automated methods to get that kind of data including customer surveys such as NPS surveys, customer effort score (CES) surveys, and regularly asking your customers about their experience with your brand.
5. Customer segmentation research
Customer segmentation research involves figuring out what buckets consumers fall into based on common characteristics such as - demographics, interests, purchasing behavior, and more. Market segmentation is super helpful for advertising campaigns, product launches, and customer journey mapping.
6. Interviews
Customer interviews are one of the most effective market research methods out there. It's a great way for business owners to get first-party data from their customers and get insights into how they are doing in real time.
7. Focus groups
Focus groups are a great way to get data on a specific demographic. It's one of the most well-known data collection methods and it involves taking a sample size of people and asking them some open-ended questions. It's a great way to get actionable insights from your target market.
8. Pricing research
Pricing strategy has a huge influence on business growth and it's critical for any business to know how they compare with the leading brands in their niche. It can help you understand what your target customer is willing to pay for your product and at what price you should be selling it.
To start, get automated software to track your competitors' pricing . Then, summarize your research into a report and group the results based on product attributes and other factors. You can use quadrants to make it easier to read visually.
9. Campaign research
It's also important for a brand to research its past marketing campaigns to determine the results and analyze their success. It takes a lot of experimentation to nail the various aspects of a campaign and it's crucial for business leaders to continuously analyze and iterate.
10. Product/service use research
Product or user research gives you an idea of why and how an audience uses a product and gives you data about specific features. Studies show that usability testing is ranked among the most useful ways to discover user insights (8.7 out of 10), above digital analytics and user surveys. So it's a very effective way to measure the usability of a product.
Now that you know the different types of market research let's go through a step-by-step process of setting up your study.
How to conduct a market research study
Looking for your next business idea? Want to check which niche markets are going to be best for it? if it's going to Here's a pretty simple process for conducting
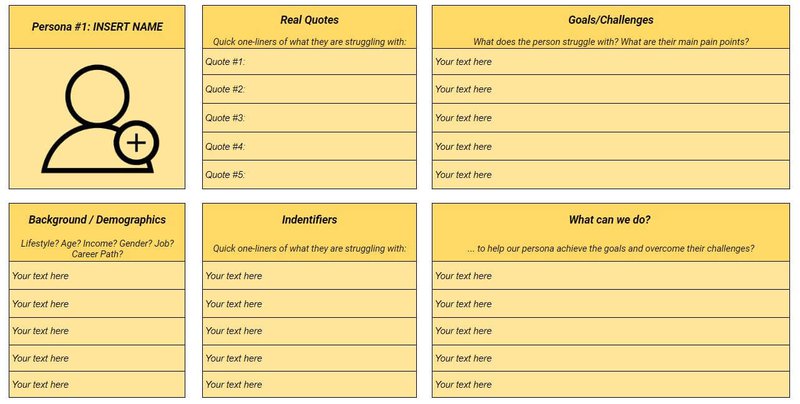
1. Define your buyer persona
The first step in market research is to understand who your buyers are. For that, you need a buyer persona (sometimes called a marketing persona) which is a fictional generalized description of your target customer. You could (and should) have several buyer personas to work with.
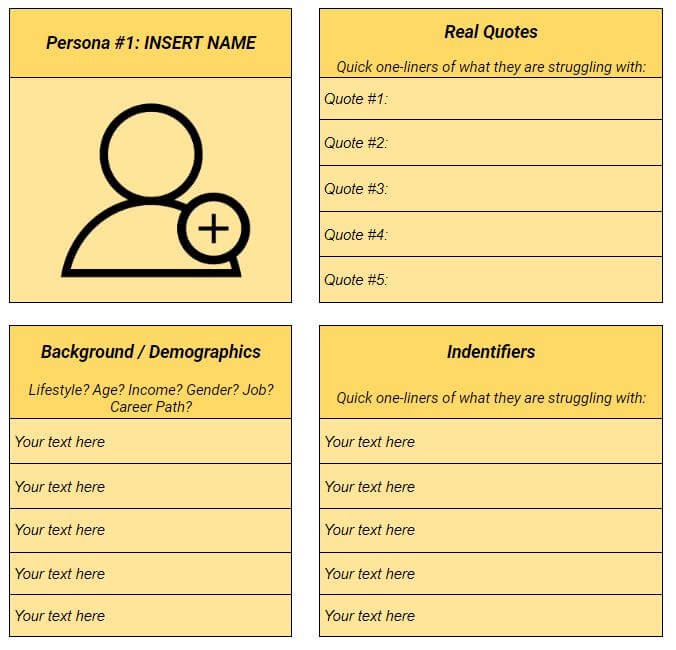
Key characteristics to include in your buyer personas are:
- Job title(s)
- Family size
- Major challenges
Now that you've got your customer personas it's time to decide who to work with for your research.
2. Identify the right people to engage with
It's critical that you pick the right group of people to research. This could make or break your market research study. It's important to pick a representative sample that most closely resembles your target customer. That way you'll be able to identify their actual characteristics, challenges, pain points, and buying behavior.
Here are a few strategies that will help you pick the right people:
- Select people who have recently interacted with you
- Pull a list of participants who made a recent purchase
- Call for participants on social media
- Leverage your own network
- Gather a mix of participants
- Offer an incentive (gift card, product access, content upgrades)
3. Pick your data collection method(s)
Here's a quick breakdown of all the different ways you could collect data for your market research study.
Surveys are by far the fastest method of gathering data. You could launch them on your site or send them in an email and automate the whole process. Regular surveys can also help brands improve their customer service so they help kill two birds with one stone.
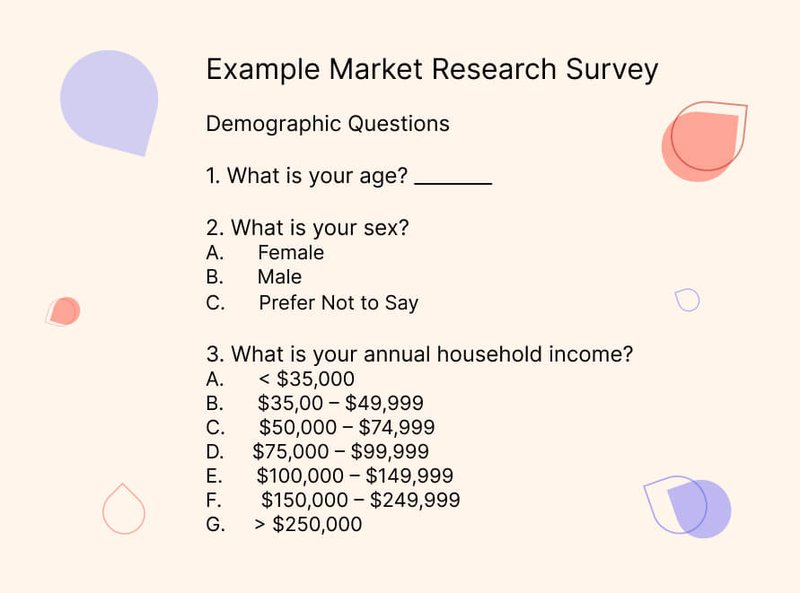
Interviews take a little longer and require a detailed set of interview questions. Never go into an interview without a clear idea of what you're going to be asking. It's also a little more difficult to schedule time and to get your potential or current customers on the phone or on Zoom.
Focus group
Focus groups are controlled interviews with groups of people led by facilitators. Participants in focus groups are selected based on a set of predetermined criteria such as location, age, social status, income, and more.
Online tracking
Online tracking is done through digital analytics tools like HotJar or Google Analytics. Tracking user behavior on your site gets you an accurate analysis of who your demographic is and what are the types of products or content that they engage with.
The problem here is that you never get to find out the 'why' - the reason behind their behavior - and that's why you need to combine digital analytics with other data collection methods like surveys and usability/product testing.
Marketing analysis
Another great way to collect data is to analyze your marketing campaigns which gives you a great idea of who clicked on your ads, how often, and which device they used. It's a more focused way of using tracking to zero in on a specific marketing campaign.
Social media monitoring
We've talked about this one before. Social monitoring or listening is when you track online conversations on social media platforms. You can use a simple social listening tool to get all the data you need by searching for specific keywords, hashtags, or topics.
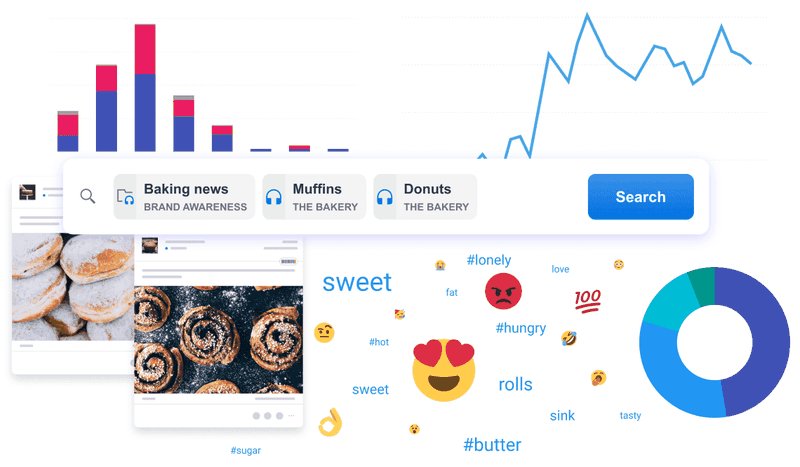
Subscription and registration data
Another great way to collect data is to look at your existing audience. That might include your email list, rewards program, or existing customers. Depending on the size of your list, it could give you some broad insights into the type of customers/users you have and what they are most interested in.
Monitoring in-store traffic
Conduct a customer observation session to monitor your actual customers and how they behave in your store (physically or online). Observation is a market research technique where highly-trained market researchers observe how people or consumers interact with products/services in a natural setting.
4. Prepare your research questions
Write down your research questions before you conduct the research. Make sure you cover all the topics that you are trying to gain clarity on and include open-ended questions. The type of questions you use will vary depending on your data collection approach from the last step.
If you're doing a survey or an in-person interview then here are some of the best questions to ask.
The awareness stage
- How did you know that something in this product category could help you?
- Think back to the time you first realized you needed [product category]. What was your challenge?
- How familiar were you with different options on the market?
The consideration stage
- Where did you go to find out the information?
- What was the first thing you did to research potential solutions?
- Did you search on Google? What specifically did you search for? Which keywords did you use?
- Which vendor sites did you visit?
- What did you find helpful? What turned you off?
The decision stage
- Which criteria did you use to compare different vendors?
- What vendors made it to the shortlist and what were the pros/cons of each?
- Who else was involved in the final decision?
- Allow time for further questions on their end.
- Don't forget to thank them for their time and confirm their email/address to receive the incentive you offered
If you noticed, the progression of these questions follows the stages of the buyer's journey which helps you to gain actionable insights into the entire customer experience.
5. List your primary competitors
There are two kinds of competitors - industry competitors and content competitors. Industry competitors compete with you on the actual product or service they sell. Content competitors compete with you in terms of the content they publish - whether that's on specific keywords or they rank higher on topics that you want to be ranked for.
It's important to write a list of all of your competitors and compare their strengths, weaknesses, competitive advantages, and the type of content they publish.
There are different ways to find your competitors. You can look on sites like G2 Crowd and check their industry quadrants.
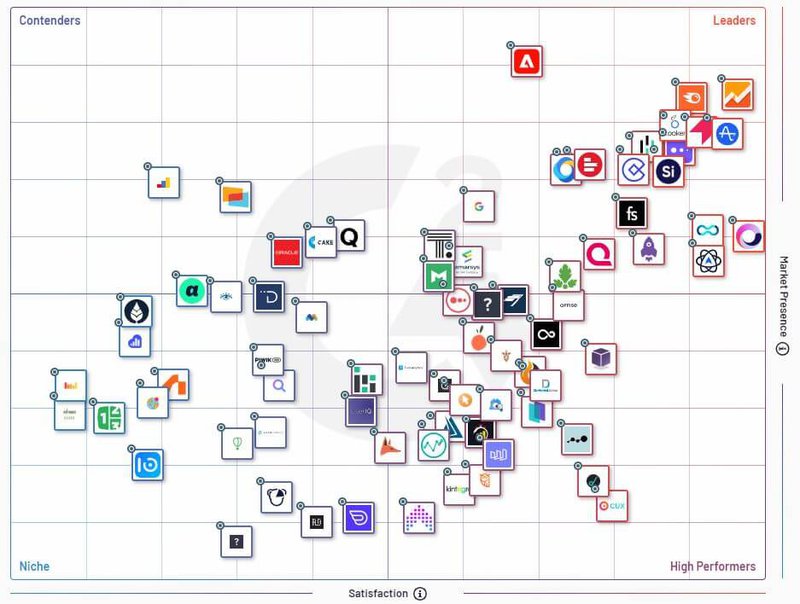
You could also download a market report from Forrester or Gartner . And you could also search on social media or market research tools like SimilarWeb .
6. Summarize your findings
Now that you've done your research it's time to summarize your findings. Look for common themes in your research and try to present them in the simplest way possible. Use your favorite presentation software to document it and add it to your company database.
Here's a quick research outline you could use:
Background - your goals and why you conducted this study
Participants - who you've talked to. Break down the type of personas and/or customers you've spoken with.
Executive summary - what was the most interesting stuff you've learned? What do you plan to do about it?
Customer journey map - map out the specific motivations and behavioral insights you've gained from each stage of the customer journey (awareness, consideration, and decision).
Action plan - describe what action steps you're going to take to address the issues you've uncovered in your research and how you are going to promote your product/service to your target audience more effectively.
Market research template
Not sure where to begin? Need some templates to help you get started? We got them for you.
1. Market survey template
First and foremost, you need a template to run your market survey. In this template, you will find all the types of questions you should be asking - demographic, product, pricing, and brand questions. They can be used for market surveys, individual interviews, and focus groups.
We also present a variety of question formats for you to use:
- true/false questions
- multiple choice questions
- open response questions
2. SWOT analysis template
A strength, weakness, opportunities, and threats (SWOT) analysis is one of the best ways to do competitor research. It's a really simple analysis. There are four squares and you write down all four of these attributes for each of your competitors.
3. Focus group template
Not sure how to conduct focus groups? Here is a comprehensive template that will help you to take better notes and record your findings during the focus group meeting.
4. Marketing strategy template
The plan of action from your market research should become a vital part of your marketing strategy. We've actually created a marketing strategy template that you could download and use to update your marketing personas, your SWOT analysis, and your marketing channel strategies.
Market research examples
Here are some examples of the good, the bad, and the ugly in market research. Some brands thrive on research and some ignore it completely. Take a look.
McDonald's
McDonald’s sells its food in 97 countries around the world. Their secret? They do a lot of market research before they launch anything. The company uses four key questions in their research process:
- Which products are performing well?
- What prices are most affordable to customers?
- What are consumers reading and watching?
- What content do they consume?
- Which restaurants are most attended, and why?
They also extensively use customer feedback to improve their products. They even put some products up for a vote to see which ones are most loved by their customers.
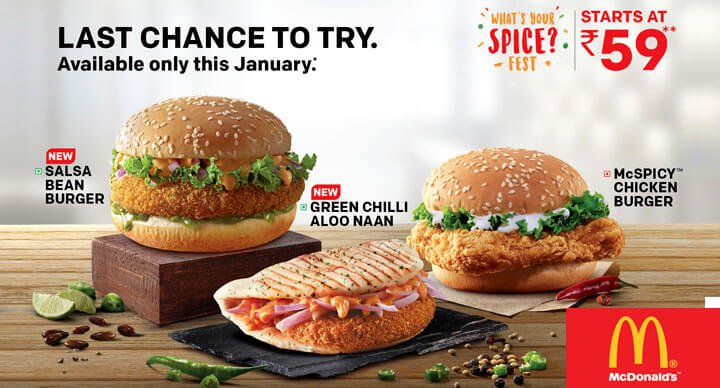
The iconic coffee brand is valued at almost $30 billion and has over 30,000 coffee shops around the world and part of that success comes from their obsession with customer service. They launched a brilliant idea called “My Starbucks Idea” to try and make the customer feel a part of the journey.
It was an open innovation platform where customers could post their idea for a new coffee drink or food item and if it was good a company representative would actually reach out to them. It had a leaderboard and every year the company would develop some of these ideas.
In 2012, Starbucks launched 73 coffee products from ideas they received from customers. Cake pops and pumpkin spice lattes were born out of this platform, all thanks to market research. Can you imagine a world without pumpkin spice lattes?
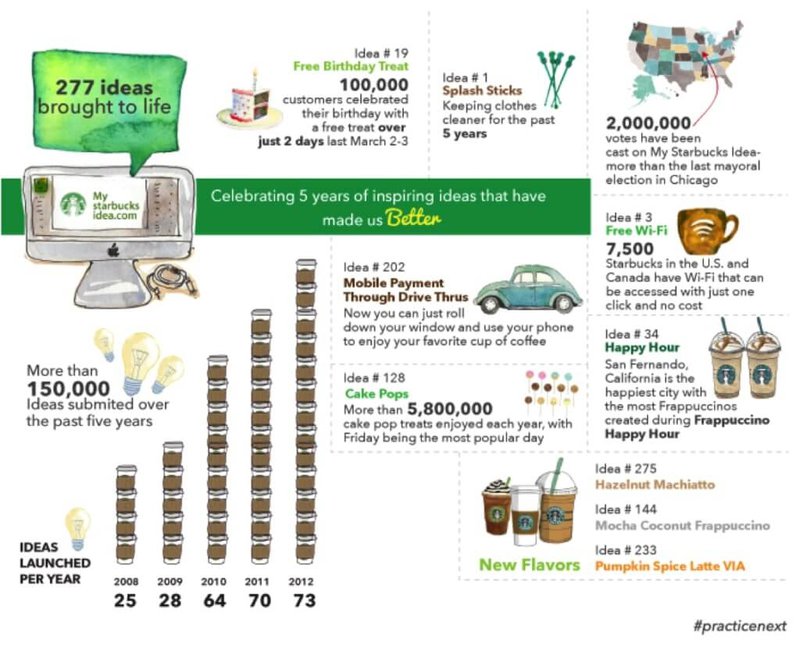
For all its innovation Facebook had an epic market research failure. In 2013, Facebook partnered with HTC to launch a smartphone called First. It had Facebook’s interface on its home screen and that was a really jarring change for most people. Instead of taking you to a home screen with your favorite apps, Facebook really took center stage.
To be fair, you could turn it off and get a regular Android home window but that would be missing the entire reason you bought the phone in the first place. So it was a complete mismatch to consumers’ wants and the phone flopped.
Turns out, that nobody wanted to see Facebook when they first opened their phone 😅.

Bloom & Wild
Bloom & Wild is a UK flower delivery brand that was looking for their next campaign. They did some research and found out that people think red roses are cliche and prefer to buy something else as a gift on Valentine’s Day. So the brand chose not to sell roses for Valentine’s Day 2021 and made it into a “No Roses Campaign”.
The results - they saw a 51% increase in press coverage year after year.

Top tools used for market research
Here are some of the top market research and digital analytics tools you should try out for your next research project.
Answer the Public
Answer the public is a free market research tool that helps marketers figure out what questions people ask online. It's really easy to use. You put in a keyword or topic and it spits out a whole variety of questions and subtopics.
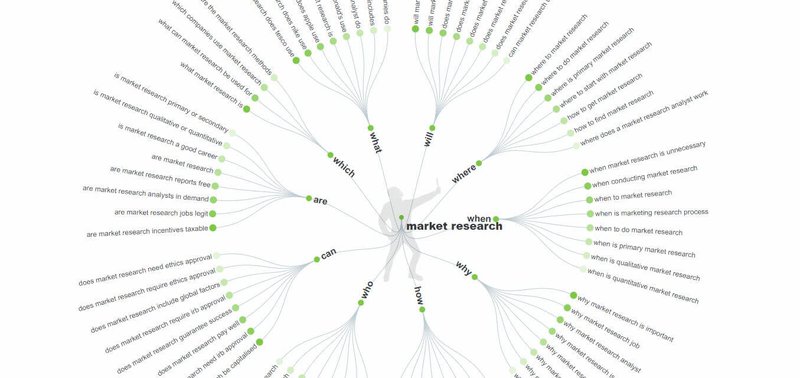
Spyfu is a search engine analytics platform that gives you data on where your competitors get their traffic from. It provides info on the kind of both organic traffic and PPC channels down to the specific keywords people used to find each site. It's a great tool to use to map the competitive landscape.
Think with Google
This is an online publication from Google's team where they publish consumer insights from real-time data and their own insights. It uses Google Analytics but presents it to you as a library of information. You can find industry data on a whole array of businesses from educational institutions to counseling services.
Want to do the most extensive market research possible? Use SimilarWeb. It's a competitive analysis and data tool that provides you with literally everything you need.
It has data on:
- Digital marketing data - SEO, traffic, advertising
- Economic trends - economic indicators like annual growth rate, audience, benchmarking
- eCommerce, investing, and even sales data
BuzzSumo is a great tool to use to get actionable insights from social media and content marketing. It aggregates data from various social media channels and shows you the type of content that users engage with and share on their pages.
Typeform is a survey tool that can help you make surveys and fun interactive forms. It's a great tool to use to make your forms more engaging for your audience. The tool has a bunch of easy templates and a ton of integrations to help you visualize that data and share it with your team.
Latana is a brand research tool that helps you understand consumer perception of your brand over time. It helps you answer some key questions about the type of values your customers have, and the type of audiences your competitors are targeting and helps you to focus your campaigns on the right audience for your business.
Statista is one of the most popular consumer data platforms around. It has a wealth of information about consumer markets, business conditions, and industry trends around the world. It's easier to use than most business publications because it aggregates all the data you need in one place. The downside is that it's a little pricy but perfect for teams that have the budget for it.
Dimensions.ai
Dimensions is a search engine for academic publications. It is a great resource if you're looking for deeper insights into things like psychology, micro and macroeconomics, and business trends. A lot of the articles are free to view just make sure you select the " All OA " option which stands for Open Access research.
Otter is an AI-powered transcription software for interviews and meetings. It sits in the background and transcribes your meeting for you and then provides you with a digitized conversation that can be stored, search for specific keywords, and analyzed. It's a great tool to use for doing interviews.
Yelp is a search engine for reviews of local businesses. It's one of the best sources of opinions about a whole variety of products and services. It's a great place to get ideas about the kind of interview questions you want to ask, to find out the pain points of your ideal customer, and to find deeper insights into your target audience.

You have to conduct your market research regularly if you want to see significant results. Try the different methods that we’ve outlined, see what works for you, and remember to keep your team’s focus on the customer. The more knowledgeable they are of your target customer’s needs and wants the better your targeting and marketing strategy will be.
Related Articles
Ben Kazinik
Omnichannel Personalization: How The Top Brands Scale Customer Experiences

Rakefet Yacoby From
The Best Digital Marketing Books in 2024

Marketing Freelancers Management 101


The Ultimate Guide to eCommerce Marketplaces

Ultimate eCommerce Guide to Conversion Rate Optimization
- Why Displayr
- Product Features
- How It Works
- Displayr AI
- Integrations
CAPABILITIES
- Survey Analysis
- Data Visualization
- Dashboarding
- Automatic Updating
- PowerPoint Reporting
- Finding Data Stories
- Data Cleaning
- New Product Development
- Tracking Analysis
- Customer Feedback
- Segmentation
- Brand Analytics
- Pricing Research
- Advertising Research
- Statistical Testing
- Text Analysis
- Factor Analysis
- Driver Analysis
- Correspondence Analysis
- Cluster & Latent Class
- Success Stories
- Demo Videos
- Book a Demo
- Ebooks & Webinars
- Help Center
- Product Roadmap
UPCOMING WEBINAR
Register now
- Book a demo
A beginner’s guide to tracking (longitudinal) research
Learn all the basics to doing your own tracking research and reporting (fast and error-free).
Watch Part 2: Advanced tracking (longitudinal) research
This webinar will cover
- Getting your data files in the best format for tracking
- Merging data files
- Statistical test over time
- Data visualization for trackers
- Moving averages and better smoothers
- Analysis and reporting in ways that are easy to update
If you're new to tracking analysis and reporting or want to brush up on your basic skills, watch this webinar and master the basics!
The document featured in this webinar can be viewed here .
If you are new to tracking research, also known as analyzing longitudinal data, this webinar is for you.
As always, I am presenting from within Display, as it's designed for interactive presentations. but everything I show, can be done in Q as well. So, if you are a Q user and there are bits you want me to show you in Q, just tell me and I will do it at the end.
Tracking research...
Tracking research involves asking the same set of questions at different points in time. Typically, to a different group of people at each time period.
The idea is to track what changes in he market.
In some markets continuous tackers conduct inerviews every day, week, or month. However, dip sticks, either regular or irregular, are the norm in many markets.
Tracking research involves solving challenges that we can put into three buckets:
Data management
Tracking studies have four big data management challenges.
The first is changes in the questionnaire.
- New questions
- New advertisements
A second is clerical errors. Working on tracking studies can be boring. Doing the same thing again and again. Mistakes happen.
The third problem is how you categorize the text data. Or, to use the market research jargon, how you code it.. No two people read text the same way, so if you change who does the text categorization, you can end up with patterns in the data over time that just relate to who performed the cateorization.
And, the fourth big issue is that all the above increase the time and costs of reporting.
So, how do we solve these problems. It's easier said but done, but the biggest secret is to fight tooth and nail to avoid making unnecessary changes to a tracking questionnaire.
The second point is to work even harder than usual to get a good data file format.
Good file formats likes SPSS and Triple S files contain lots of metadata, such as question wordings, and the order in which options were presented.
If doing a tracking study, changes to the questionnaire are easy to detect and address, if you have these better file formats.
By contrast, when you are using CSV and Excel files, you can make changes to how you collect the data, but have no way of finding these in the raw data, which leads to mistakes.
I'll talk about the next few points. But, a quick notice that more advanced topics, shown in blue, will be covered in the next webinar
Use cumulative ...
OK, let's look at the wrong way to set up your tracker.
You first interview everybody in the first wave.
Then, you copy the project in your data collection software and send the new version off to a second group of people for your second wave.
If you do that, you end up with two data files.
This has two problems.
First, you will need to merge them.
That's usually pretty easy o do.
In Displayr, for example: In Display: Combine > Data Sets > Merge by Case
But, the bigger issue will be that when you merge them, you will inevitably lose information about how the questionnaire has changed over time.
The smart way forward is to only have the one data collection project that contains all the respondents. So, when you do analysis, you just export all the data in a single file. This is known as a cumulative data file.
Automate as much as you can
I will go into a lot more detail on automation in the advanced webinar. However, in this webinar I will just focus on the ideal end goal.
The end goal of your automation work is that your software, rather than you, do all the automation. This means fewer errors, faster turnaround, and lower costs.
Let's look at an example.
Here's a dashboard. It's for the data we've just been looking at. It's showing us the results for July 2015 to September 2017.
Burger consumption in the past month is at 83%, which rose 4% from the previous month.
Now, I'm going to replace my data file, with a new cumultative file, that contains all my old data and one more quarter.
Update data file
It' will take a moment It's got a lot of thinking to do.
Now, remember, our score was 83%, and this has dropped 78%. For
Everything else has automatically updated. The raw data, the underlying tables, calculations, and all visualizations.
That’s where you can get to with automation. But it’s a lot of work. We will return to it in the advanced webinar
When we are doing analysis, our key issues are:
- Finding meaningful changes.
- Avoiding reporting noise as meaningful
- Not confusing trend with seasonality
There are three sets of tools for solving these problems
- Automated stat testing
- Weighting
- And, using our brains to attempt to work out causality.
Let's dig into theses.
Stat testing over time
We have a set of key questions. For example, here's some data on aided awareness.
We want to look at it over time.
If we have a dip stick, the data may be categorical, and we create a standard crosstab.
The goal of stat testing is to try and help us work out which results aren't just noise.
If you are a true beginner, you might look at this and think. Ah, Arnold's declined in Wave 5 from Wave 4.
But, that's not right.
By default, stat testing is not set up for trackers. Instead, by default, stat tests compare each period with all the other periods, rather than just the one before.
So, how do we rectify this?
One approach is to just delete other columns.
Delete Wave 1 through 3
Now, we can see that the Arnold's difference is no statistically significant. Rather, Bread Basket and Nuovo burger changed.
Or, we can use column comparisons.
Properties Significance > Column comparisons.
So, the previous wave, wave 4, is in column d. So, we look in the Wave 5 column for ay Ds, and, just as we saw before, we can see it only is different for Bread Basket and Nuovo burger.
If we have continuous tracking or regular time periods, we will want to do our analysis with a variable that contains the actual date of the interview.
In Displayr and Q, this will mean we have the data set up as a date variable, which will mean we will see a calendar icon like this.
Displayr's automatically grouped the time into monthly buckets. I've got too much data to see.
So, to simplify the data we will aggregate it. This is good practice. If you have too much data, simplify it.
Let's change that to Quarterly.
Interview date > Date/Time Aggregation: Quarterly
When we are looking at tracking data, our main focus is always on the very last period, which is Jul-Sep 17.
We're still showing the column comparisons. With this many date periods they'r a pain, and we're better off showing exception tests.
We need to do two things:
First, we turn on the exception tests
Significance > Arrows and Font Colors
As before, these are comparing all the time periods. Note that we are seeing Burger Shack is up. But, this is telling is that Jul-Sep 17 is higher than the rest of the data, rather than just comparing to he previous period. So, it's the same beginner's mistake from before, and we need to tell the software to compare to the previous period.
Significance > Advanced > Compare to
And look, we have a completely different conclusions. The only significant difference is now Pret'a'pane.
Often we want to compare data to where things were at 12 months ago. Here's a couple of reasons for this
Sometimes, it's jus an interesting statistic to look at.
However, in some markets there are strong seasonal effects, and certain brands are stronger in, say, summer. In such markets, we're more interested in comparing to a year ago.
Looking at Burger Chef in the first row, since July September 16, i's gone up from 74% to 71%. Is this statistically significant?
Stat testing: comparing to 12 months ago
But what if we want to compare to a year ago?
I'm going to do this by creating a new variable
+ > Insert Read-Made New Variable(s) > Contrast Periods
Let's drag it across and look at it.
It's showing the last 2 months of the data
So, i'll tell it to focus on quarters
Date aggregation: Quarter
It's now showing the same result we had before for Pret-a-pane. But, we can now control where we compare against.
Versus: Q3 2016
OK, so we can see that quite a few brands are up compared to a year ago.
With such data, it's often nice to show a difference.
In Displayr, we can do this with a Rule.
Rule > Tabe Computations > Difference Between Pair of Columns Column 1: Q3 2017 Column 2: Q3 2016
And, commonly people may just want to look at the difference.
In this example, we are getting quite different conclusions when comparing to 12 months ago than when just comparing to the previous time period.
So, we need to understand the trend. We will look at the stat testing side of this in the advanced webinar.
But, the key thing is to create a good way of showing all the data, which we will come to shortly.
Weighting is almost always appropriate in tracking studies
In all studies, we get over- and under-representation of different sub-groups. For example, in a tracker, we may have too many men one month, and two few the next.
Weighting can correct for this.
With a tracker, we can expect that every wave we will get such random movement.
Therefore, we pretty much always want to weight a tracker.
Here's some data over time.
Lucky's Pizza shows no significant differences.
What happens when we weight it?
Now we are seeing a difference. This is interesting. The random noise had hidden a pattern, and it's only revealed when we apply the weight.
So, remember, if you can, you should weight your trackers.
We will talk about some more advanced aspects of weighting in our next webinar on tracking.
And, check out our webinar on weighting for more about weighting in general.
Automated stat testing and weighting both help us to sort out the true differences from the random noise.
These should be augmented with attempts to understand causality. That is, trying to figure out what has caused a movement. If you can find other data that that corroborates the differences you see in the tracker, that's a good sign. Examples of other data to look at are:
Marketing activities, such as changes in ad campaigns and distribution.
- Other surveys
- Google rends.
And, the last thing to do is to decompose changes over time in terms of whether they are driven by changes within sub-groups or changes in sub-group size. There's a nice framework and process for this, which will be the centrepiece of our more advanced webinar on tracking.
When we report our tracking, our first key challenge is making it easy for our audience to spot meaningful changes in the data .
Our second challenge is to stop them from seeing patterns in noise.
And, the biggest challenge is stopping them from being bored!
Two great tools for doing this are small multiples and smoothing. We will dig into these shortly.
Another great tool is to have rotational sections of your studies and reporting. E.g., one month maybe you focus on brand health. A second month ad effectveness, and so on.
One particular variant of rotating deep dives is to identify laws of the market, which we will focus on in the advanced webinar.
OK, so every now and then I see a visualization that's just so horrible I had to take a screen shot.
To prevent embarrassment from all concerned, I've hidden the brand names. It's not a good chart.
In interactive..
This is another line chart showing tracking data. Because it's inteactive it's a bit better.
But, to find a pattern we need to work really hard. Tell me, for example, what's the story with The Crown? What pattern can you see?
Yep, nothing really.
The awesomely named mathematician, Lofti Zadah, had a saying: When the only tool you have is a hammer, everything begins to look like a nail.
And, in the world of PowerPoint and Excel, the line charts like these are the only hammer for time series data.
Fortunately, there's a much better solution, which is small multiples. But, you can't do them in Excel.
"Small multiples"
But, we're not in Microsoft anymore toto, so let's do something better.
Now, have a look. What's the story with the Crown? We can now make out lots of really clear patterns in the data.
Brand awareness spaghetti
Here's our earlier brand awareness data. It's not as much as a mess as the earlier line chart.
Brand awareness small multiples
But the small multiple are still so much better!
Small multiples are the number 1 data visualization tool that you need to know about for tracking.
The number 2 is to use smoothers.
Here's some data on customer churn. It moves around a lot.
We could aggregate to show it quarterly. Or, we could put a trendline on it.
Object inspector > Chart > TREND LINES > Line of best fit : Line
Clearly a straight line tells us something, but it's not doing a great job.
Many make researchers use rolling averages, also known as moving averages to show the underlying trend.
Object inspector > Chart > TREND LINES > Line of best fit : Moving Average
For example, this one is a 6 month moving average.
It's called a smoother, because the resulting trend line is a lot smoother than the original data. The idea is that the smooth data will show make it easier to see the trend.
Unfortunately, this rolling or moving average isn't doing a great job. Notice hat:
We've got no line for the first five periods.
And, notice also that the line doesn't do a great job at showing trends. For example, in the raw data our two big peaks are here and hear
But, the peaks occur in the moving average well after this. What's going on?
Well, this ones a bit sad. Moving averages are one of those things that get taught in undergraduate stats as an introductory topic, to help people understand. But, they're not meant to be used!!!
Much, much better techniques have been invented, such as
- Object inspector > Chart > TREND LINES > Line of best fit : LOESS
- And Friedman's super smoother
- Notice how this does a much better job.
Which of these more advanced techniques should you use? Whichever one does a better job at describing the data.
How do they work?
Well, they are better, but they are really complex. So, I'm not gonna even try.
And, what's wrong with the rolling average?
Let's do a worked example.
Why rolling/moving averages are always misleading
We're going to do some very simple math. Do try and follow along, as if you are using rolling averages, I what I will show you is really interesting and surprising.
Let's look at a 6 month rolling average
We calculate the average for October 2019 as the average of the six numbers shown here.
As you hopefully remember, this is the formula for the average.
And, the average for November is calculated this way.
So, the October number is 6, and November is 6.4. That suggest that once we smooth the data, churn's gone up by 0.4
OK, Now a bit of simple maths.
Is the same this line. That is, I've just substituted
that needs to be used. The number 2 is modern smoothers.
Here' I've got some data on customer churn.
Lets plot this data as columns
Insert > Visualization > Column Chart
It jumps around a lot. 99 out of 100 market researchers then go and apply a moving average, also known as a rolling average.
Chart > Trend > Moving average
Displayr's defaulting to the 3 month moving average. This is wiggling around too much.
Let's try 6 months
But, look, the moving average actually does a bad job. Look in June 2019. A huge spike. The moving average shows a small blip up.
According moving average, the data peaked in November 2019. But, look at the actual data. The high points are 2 and 5 months earlier.
What's going on?
The sad truth is that traditional moving averages are just dumb. Statisticians have known for more than 100 years that they are dumb. This is why whenever you see government data or anything done by a good statistician, they don't use moving averages.
There are lots of alternatives.
Three of the popular ones are in Displayr and Q.
Line of best fit: LOESS
One of them is called Locally Weighted Exponential scatterplot smoothing, or loess for short.
It's doing a much better job. It works out that the June 2019 peak was an aberration. And, it picks that since September things have been getting worse.
Another one, with a cooler name, is Friedman's super smoother
Line of best fit: Friedman's super smoother
Or, you can have a cubic spline.
Which is best? Just like with choosing wether to do a 3 or 6 month moving average, it comes down to the story you want to tell.
These techniques are always better than moving averages. Always is a strong word. And I mean it. If your goal is accurately summarize the data, these techniques are provably always better than a moving average.
Nothing comes for free however.
The math is hard. You need to point, click and trust. You are unlikely to ever understand the math. And, unlike a moving average, when you get new data, the historical line will update, so they're not great for setting performance target for bonuses.
Try Displayr now
Discover how much time you can save by analyzing with displayr.
Book a demo Get Displayr free
Prepare to watch, play, learn, make, and discover!
Get access to all the premium content on displayr, last question, we promise, what type of survey data are you working with (select all that apply).
Market research Social research (commercial) Customer feedback Academic research Polling Employee research I don't have survey data
Built for trackers and time series
What Is Tracking Studies in Marketing?
- Small Business
- Advertising & Marketing
- ')" data-event="social share" data-info="Pinterest" aria-label="Share on Pinterest">
- ')" data-event="social share" data-info="Reddit" aria-label="Share on Reddit">
- ')" data-event="social share" data-info="Flipboard" aria-label="Share on Flipboard">
How to Stop Tracking Changes in OpenOffice
Does subliminal marketing work, what is the key response action from a target market.
- How to Red Line in Word 2007
- How to Check if Someone Is a Fan Through Facebook Connect
A tracking study analyzes the changing views of a single group of consumers, making it an effective tool for market research. Tracking studies allow business owners to measure brand awareness, monitor customer satisfaction, study consumer sentiment concerning a new product or service, or analyze the effectiveness of a particular marketing campaign, according to the book “Marketing Hospitality,” by Cathy H. C. Hsu and Tom Powers.
A tracking study is longitudinal, which means it examines the changing views of the same people over a period of time. In contrast, a latitudinal, or cross-sectional, study analyzes views at a single point in time. While you can perform a series of latitudinal studies, any opinion changes you uncover might be due to the fact you’re studying different groups of people. In other words, a tracking study gives you confidence that shifts in consumer sentiment reflect actual changes, because you’re asking the same people the same questions at different times.
Performing a Tracking Study
The key is to clarify what consumer information you need and then design a tracking study that precisely reveals the data you’re after. For example, suppose you want to measure the effectiveness of an upcoming marketing campaign. The first step would be to find a sizable group of people willing to fill out a detailed questionnaire or participate in a focus group. After the marketing campaign is complete, you would then ask the same volunteers to answer the same questions again.
If there is a distinct difference between consumer sentiment before and after your campaign, and that change is in line with the goals of your campaign, then the marketing campaign was a success. On the other hand, if there was no change in consumer sentiment, or if the change was negative, you know your campaign failed. In either case, the feedback quantifies the impact of your marketing campaign, allowing you to improve future campaigns.
Many factors determine the effectiveness of a tracking study. Choosing a representative sample of the right consumer demographic is vital, as is designing interview or survey questions that are directly relevant to the central issue you wish to study. Analyzing your results requires complex calculations and a thorough understanding of consumer-research protocols. For all these reasons, business owners should consider hiring a qualified market-research firm to perform tracking studies.
- Marketing Hospitality; Cathy H. C. Hsu and Tom Powers
- Essentials of Marketing Research: Putting Research into Practice; Kenneth E. Clow and Karen E. James
Stan Mack is a business writer specializing in finance, business ethics and human resources. His work has appeared in the online editions of the "Houston Chronicle" and "USA Today," among other outlets. Mack studied philosophy and economics at the University of Memphis.
Related Articles
Challenges facing business research reporting & evaluating, cross-section design of a business research method, descriptive vs. behavioral marketing, what are the disadvantages of qualitative measurements when doing marketing research, hypothesis testing used in business, what is hypothetical scenario marketing, scientific vs. unscientific methods in business research, the basic steps of the marketing research process, what is the difference between the target population & the experimentally accessible population, most popular.
- 1 Challenges Facing Business Research Reporting & Evaluating
- 2 Cross-Section Design of a Business Research Method
- 3 Descriptive Vs. Behavioral Marketing
- 4 What Are the Disadvantages of Qualitative Measurements When Doing Marketing Research?
How To Present Your Market Research Results And Reports In An Efficient Way
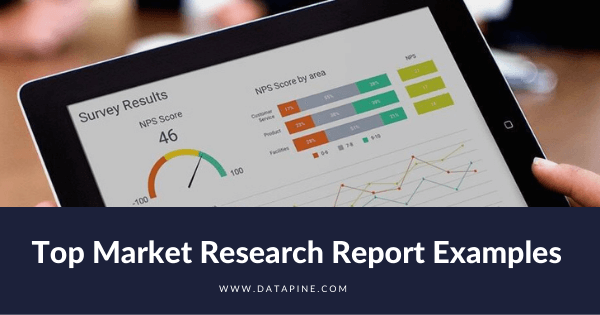
Table of Contents
1) What Is A Market Research Report?
2) Market Research Reports Examples
3) Why Do You Need Market Research Reports
4) How To Make A Market Research Report?
5) Types Of Market Research Reports
6) Challenges & Mistakes Market Research Reports
Market research analyses are the go-to solution for many professionals, and for good reason: they save time, offer fresh insights, and provide clarity on your business. In turn, market research reports will help you to refine and polish your strategy. Plus, a well-crafted report will give your work more credibility while adding weight to any marketing recommendations you offer a client or executive.
But, while this is the case, today’s business world still lacks a way to present market-based research results efficiently. The static, antiquated nature of PowerPoint makes it a bad choice for presenting research discoveries, yet it is still widely used to present results.
Fortunately, things are moving in the right direction. There are online data visualization tools that make it easy and fast to build powerful market research dashboards. They come in handy to manage the outcomes, but also the most important aspect of any analysis: the presentation of said outcomes, without which it becomes hard to make accurate, sound decisions.
Here, we consider the benefits of conducting research analyses while looking at how to write and present market research reports, exploring their value, and, ultimately, getting the very most from your research results by using professional market research software .
Let’s get started.
What Is a Market Research Report?
A market research report is an online reporting tool used to analyze the public perception or viability of a company, product, or service. These reports contain valuable and digestible information like customer survey responses and social, economic, and geographical insights.
On a typical market research results example, you can interact with valuable trends and gain insight into consumer behavior and visualizations that will empower you to conduct effective competitor analysis. Rather than adding streams of tenuous data to a static spreadsheet, a full market research report template brings the outcomes of market-driven research to life, giving users a data analysis tool to create actionable strategies from a range of consumer-driven insights.
With digital market analysis reports, you can make your business more intelligent more efficient, and, ultimately, meet the needs of your target audience head-on. This, in turn, will accelerate your commercial success significantly.
Your Chance: Want to test a market research reporting software? Explore our 14-day free trial & benefit from interactive research reports!
How To Present Your Results: 4 Essential Market Research Report Templates
When it comes to sharing rafts of invaluable information, research dashboards are invaluable.
Any market analysis report example worth its salt will allow everyone to get a firm grip on their results and discoveries on a single page with ease. These dynamic online dashboards also boast interactive features that empower the user to drill down deep into specific pockets of information while changing demographic parameters, including gender, age, and region, filtering the results swiftly to focus on the most relevant insights for the task at hand.
These four market research report examples are different but equally essential and cover key elements required for market survey report success. You can also modify each and use it as a client dashboard .
While there are numerous types of dashboards that you can choose from to adjust and optimize your results, we have selected the top 3 that will tell you more about the story behind them. Let’s take a closer look.
1. Market Research Report: Brand Analysis
Our first example shares the results of a brand study. To do so, a survey has been performed on a sample of 1333 people, information that we can see in detail on the left side of the board, summarizing the gender, age groups, and geolocation.
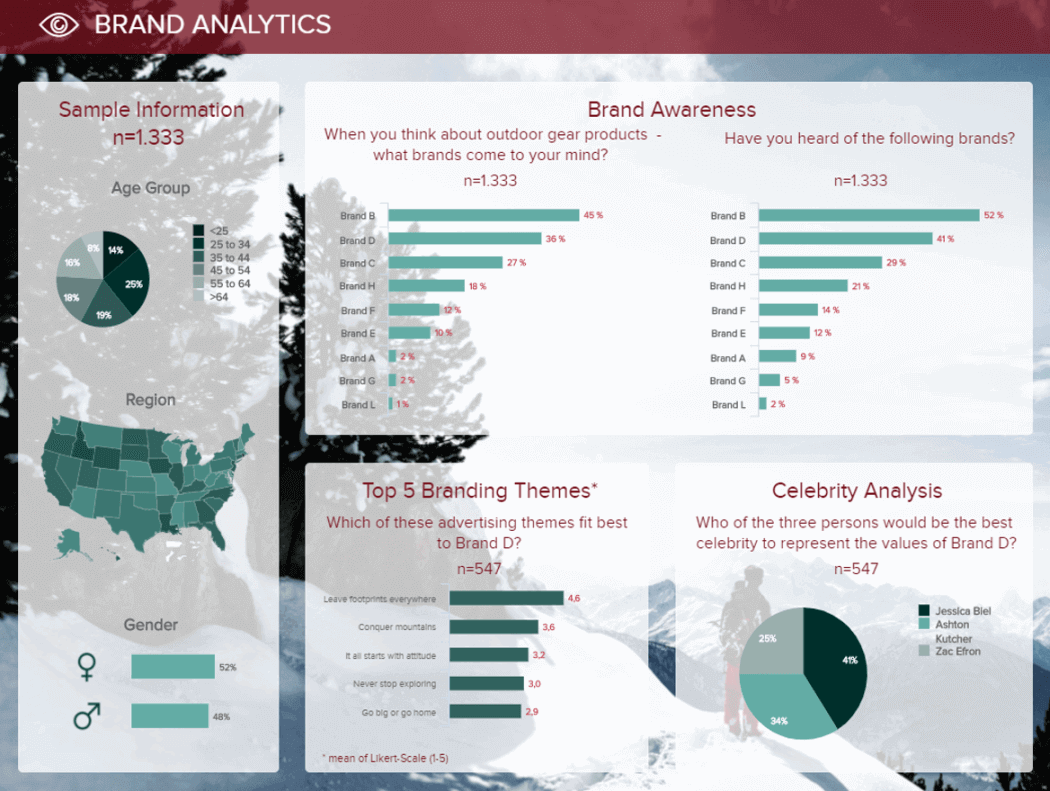
**click to enlarge**
At the dashboard's center, we can see the market-driven research discoveries concerning first brand awareness with and without help, as well as themes and celebrity suggestions, to know which image the audience associates with the brand.
Such dashboards are extremely convenient to share the most important information in a snapshot. Besides being interactive (but it cannot be seen on an image), it is even easier to filter the results according to certain criteria without producing dozens of PowerPoint slides. For instance, I could easily filter the report by choosing only the female answers, only the people aged between 25 and 34, or only the 25-34 males if that is my target audience.
Primary KPIs:
a) Unaided Brand Awareness
The first market research KPI in this most powerful report example comes in the form of unaided brand awareness. Presented in a logical line-style chart, this particular market study report sample KPI is invaluable, as it will give you a clear-cut insight into how people affiliate your brand within their niche.
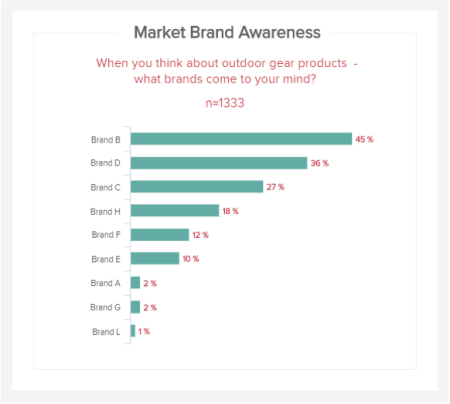
As you can see from our example, based on a specific survey question, you can see how your brand stacks up against your competitors regarding awareness. Based on these outcomes, you can formulate strategies to help you stand out more in your sector and, ultimately, expand your audience.
b) Aided Brand Awareness
This market survey report sample KPI focuses on aided brand awareness. A visualization that offers a great deal of insight into which brands come to mind in certain niches or categories, here, you will find out which campaigns and messaging your target consumers are paying attention to and engaging with.

By gaining access to this level of insight, you can conduct effective competitor research and gain valuable inspiration for your products, promotional campaigns, and marketing messages.
c) Brand image
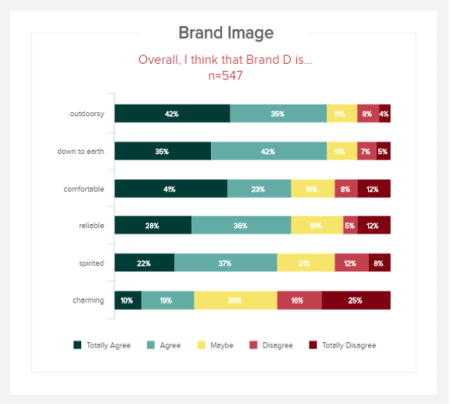
When it comes to research reporting, understanding how others perceive your brand is one of the most golden pieces of information you could acquire. If you know how people feel about your brand image, you can take informed and very specific actions that will enhance the way people view and interact with your business.
By asking a focused question, this visual of KPIs will give you a definitive idea of whether respondents agree, disagree, or are undecided on particular descriptions or perceptions related to your brand image. If you’re looking to present yourself and your message in a certain way (reliable, charming, spirited, etc.), you can see how you stack up against the competition and find out if you need to tweak your imagery or tone of voice - invaluable information for any modern business.
d) Celebrity analysis
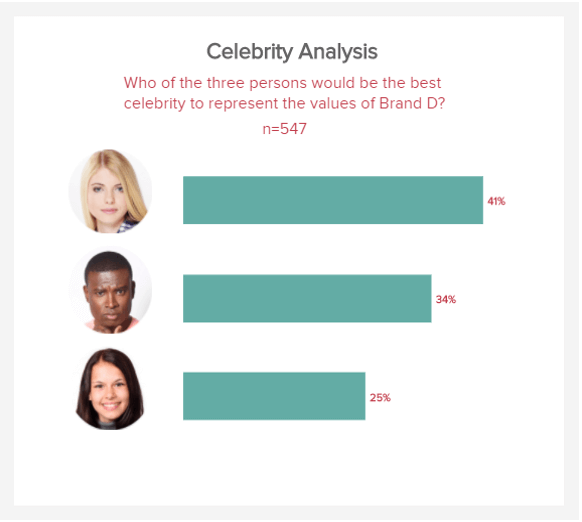
This indicator is a powerful part of our research KPI dashboard on top, as it will give you a direct insight into the celebrities, influencers, or public figures that your most valued consumers consider when thinking about (or interacting with) your brand.
Displayed in a digestible bar chart-style format, this useful metric will not only give you a solid idea of how your brand messaging is perceived by consumers (depending on the type of celebrity they associate with your brand) but also guide you on which celebrities or influencers you should contact.
By working with the right influencers in your niche, you will boost the impact and reach of your marketing campaigns significantly, improving your commercial awareness in the process. And this is the KPI that will make it happen.
2. Market Research Results On Customer Satisfaction
Here, we have some of the most important data a company should care about: their already-existing customers and their perception of their relationship with the brand. It is crucial when we know that it is five times more expensive to acquire a new consumer than to retain one.
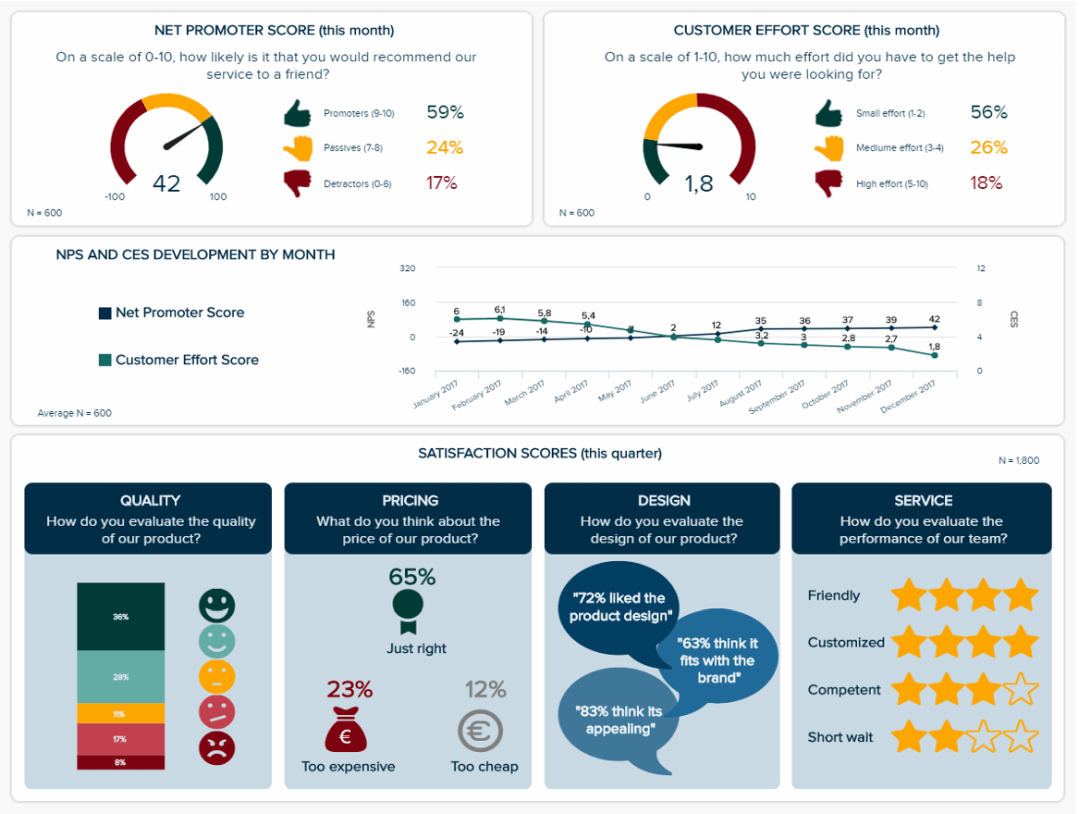
This is why tracking metrics like the customer effort score or the net promoter score (how likely consumers are to recommend your products and services) is essential, especially over time. You need to improve these scores to have happy customers who will always have a much bigger impact on their friends and relatives than any of your amazing ad campaigns. Looking at other satisfaction indicators like the quality, pricing, and design, or the service they received is also a best practice: you want a global view of your performance regarding customer satisfaction metrics .
Such research results reports are a great tool for managers who do not have much time and hence need to use them effectively. Thanks to these dashboards, they can control data for long-running projects anytime.
Primary KPIs :
a) Net Promoter Score (NPS)
Another pivotal part of any informative research presentation is your NPS score, which will tell you how likely a customer is to recommend your brand to their peers.
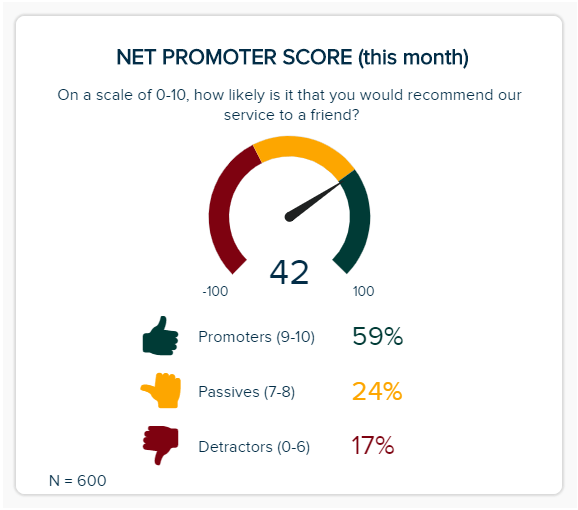
Centered on overall customer satisfaction, your NPS Score can cover the functions and output of many departments, including marketing, sales, and customer service, but also serve as a building block for a call center dashboard . When you’re considering how to present your research effectively, this balanced KPI offers a masterclass. It’s logical, it has a cohesive color scheme, and it offers access to vital information at a swift glance. With an NPS Score, customers are split into three categories: promoters (those scoring your service 9 or 10), passives (those scoring your service 7 or 8), and detractors (those scoring your service 0 to 6). The aim of the game is to gain more promoters. By gaining an accurate snapshot of your NPS Score, you can create intelligent strategies that will boost your results over time.
b) Customer Satisfaction Score (CSAT)
The next in our examples of market research reports KPIs comes in the form of the CSAT. The vast majority of consumers that have a bad experience will not return. Honing in on your CSAT is essential if you want to keep your audience happy and encourage long-term consumer loyalty.
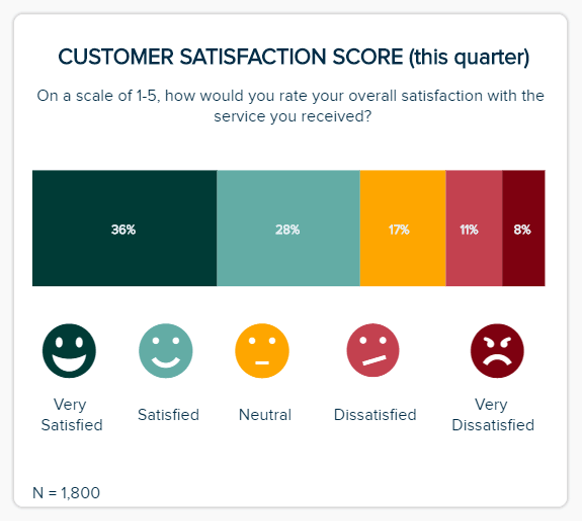
This magnificent, full report KPI will show how satisfied customers are with specific elements of your products or services. Getting to grips with these scores will allow you to pinpoint very specific issues while capitalizing on your existing strengths. As a result, you can take measures to improve your CSAT score while sharing positive testimonials on your social media platforms and website to build trust.
c) Customer Effort Score (CES)
When it comes to presenting research findings, keeping track of your CES Score is essential. The CES Score KPI will give you instant access to information on how easy or difficult your audience can interact with or discover your company based on a simple scale of one to ten.
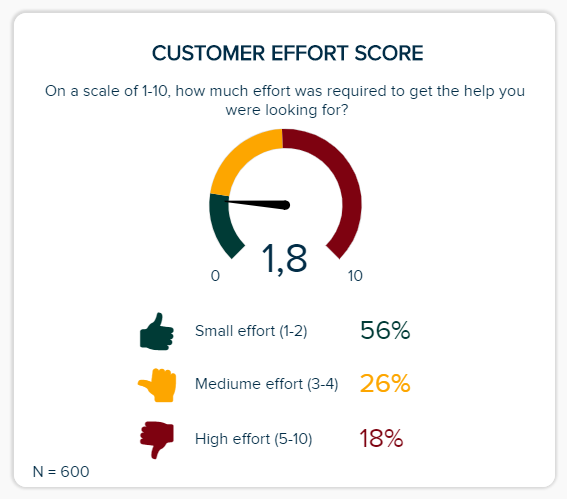
By getting a clear-cut gauge of how your customers find engagement with your brand, you can iron out any weaknesses in your user experience (UX) offerings while spotting any friction, bottlenecks, or misleading messaging. In doing so, you can boost your CES score, satisfy your audience, and boost your bottom line.
3. Market Research Results On Product Innovation
This final market-driven research example report focuses on the product itself and its innovation. It is a useful report for future product development and market potential, as well as pricing decisions.
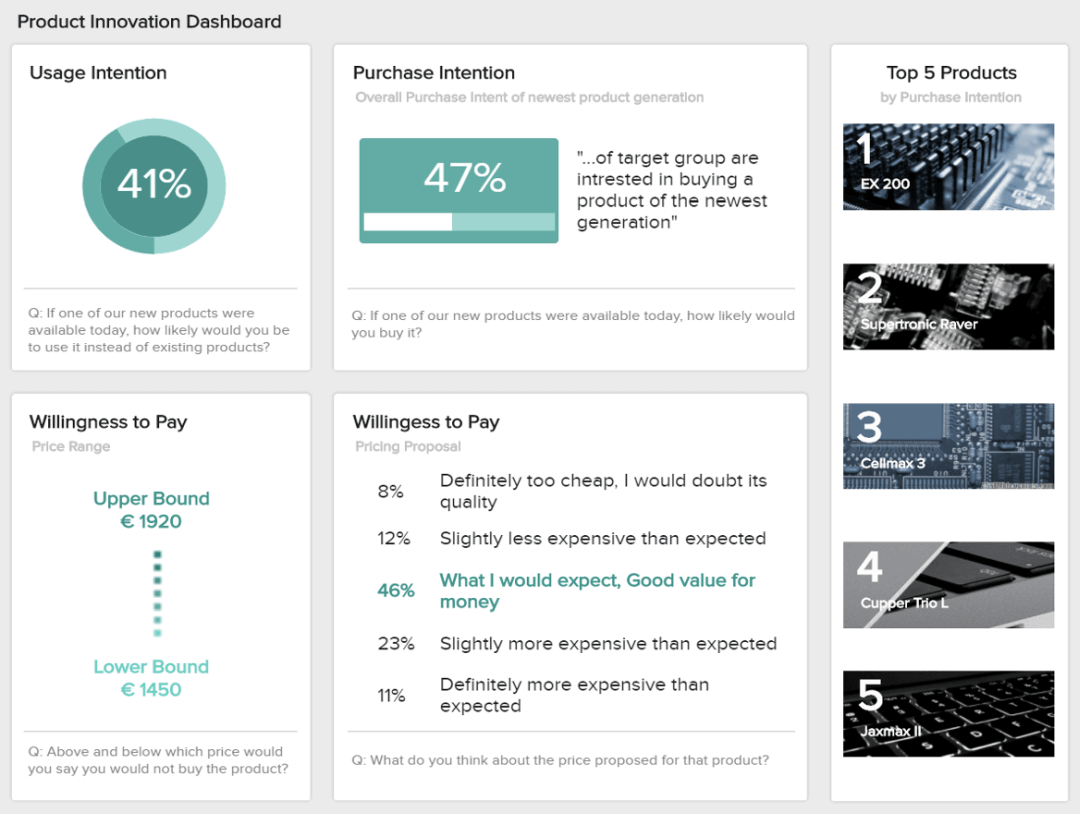
Using the same sample of surveyed people as for the first market-focused analytical report , they answer questions about their potential usage and purchase of the said product. It is good primary feedback on how the market would receive the new product you would launch. Then comes the willingness to pay, which helps set a price range that will not be too cheap to be trusted nor too expensive for what it is. That will be the main information for your pricing strategy.
a) Usage Intention
The first of our product innovation KPI-based examples comes in the form of usage intention. When you’re considering how to write a market research report, including metrics centered on consumer intent is critical.
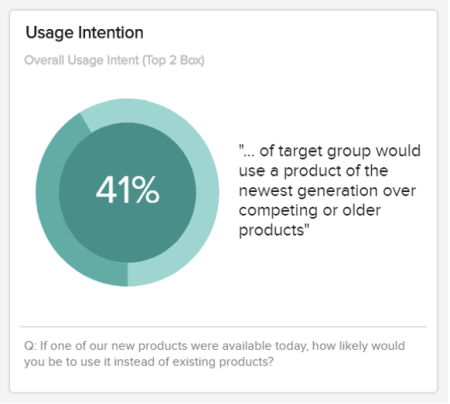
This simple yet effective visualization will allow you to understand not only how users see your product but also whether they prefer previous models or competitor versions . While you shouldn’t base all of your product-based research on this KPI, it is very valuable, and you should use it to your advantage frequently.
b) Purchase Intention
Another aspect to consider when looking at how to present market research data is your audience’s willingness or motivation to purchase your product. Offering percentage-based information, this effective KPI provides a wealth of at-a-glance information to help you make accurate forecasts centered on your product and service offerings.
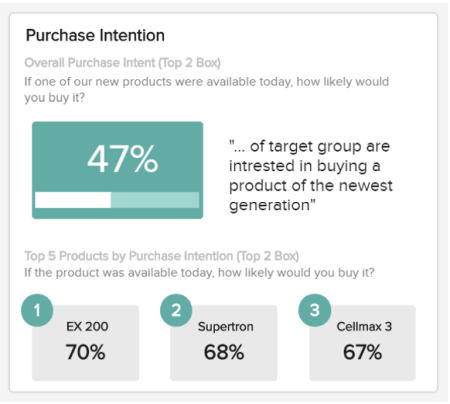
Analyzing this information regularly will give you the confidence and direction to develop strategies that will steer you to a more prosperous future, meeting the ever-changing needs of your audience on an ongoing basis.
c) Willingness To Pay (WPS)
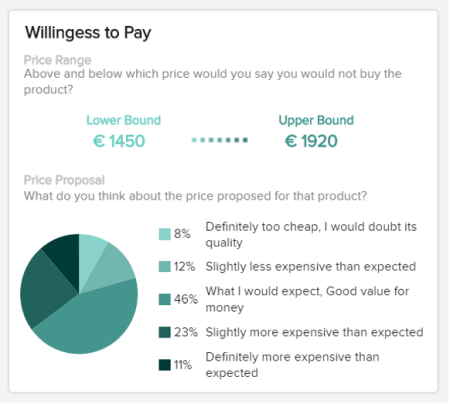
Our final market research example KPI is based on how willing customers are to pay for a particular service or product based on a specific set of parameters. This dynamic visualization, represented in an easy-to-follow pie chart, will allow you to realign the value of your product (USPs, functions, etc.) while setting price points that are most likely to result in conversions. This is a market research presentation template that every modern organization should use to its advantage.
4. Market Research Report On Customer Demographics
This particular example of market research report, generated with a modern dashboard creator , is a powerful tool, as it displays a cohesive mix of key demographic information in one intuitive space.
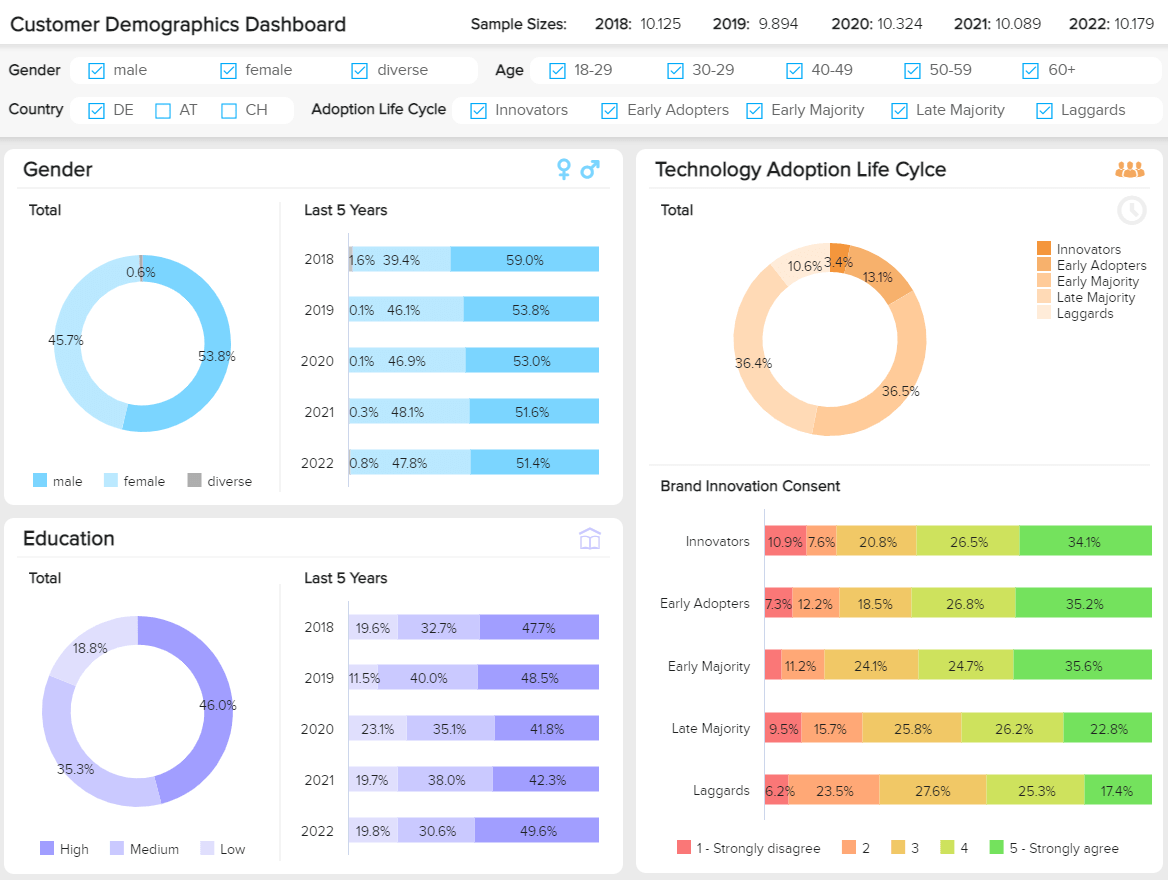
By breaking down these deep pockets of consumer-centric information, you can gain the power to develop more impactful customer communications while personalizing every aspect of your target audience’s journey across every channel or touchpoint. As a result, you can transform theoretical insights into actionable strategies that will result in significant commercial growth.
Every section of this responsive marketing research report works in unison to build a profile of your core audience in a way that will guide your company’s consumer-facing strategies with confidence. With in-depth visuals based on gender, education level, and tech adoption, you have everything you need to speak directly to your audience at your fingertips.
Let’s look at the key performance indicators (KPIs) of this invaluable market research report example in more detail.
a) Customer By Gender
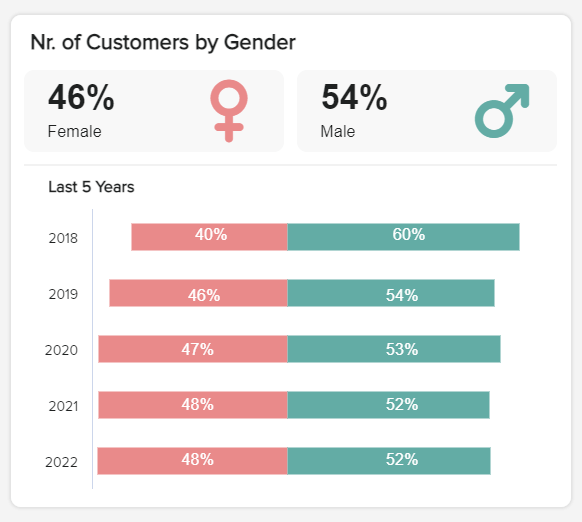
This KPI is highly visual and offers a clear-cut representation of your company’s gender share over time. By gaining access to this vital information, you can deliver a more personalized experience to specific audience segments while ensuring your messaging is fair, engaging, and inclusive.
b) Customers by education level
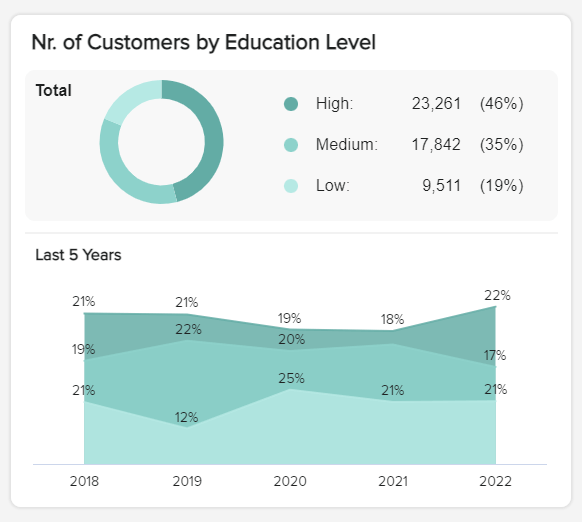
The next market analysis report template is a KPI that provides a logical breakdown of your customers’ level of education. By using this as a demographic marker, you can refine your products to suit the needs of your audience while crafting your content in a way that truly resonates with different customer groups.
c) Customers by technology adoption
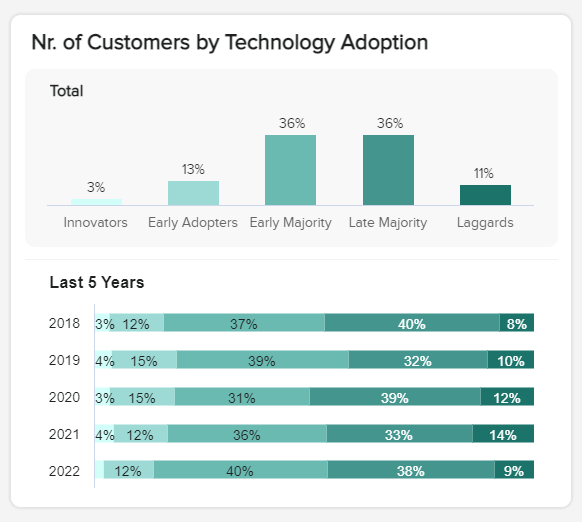
Particularly valuable if you’re a company that sells tech goods or services, this linear KPI will show you where your customers are in terms of technological know-how or usage. By getting to grips with this information over time, you can develop your products or services in a way that offers direct value to your consumers while making your launches or promotions as successful as possible.
d) Customer age groups
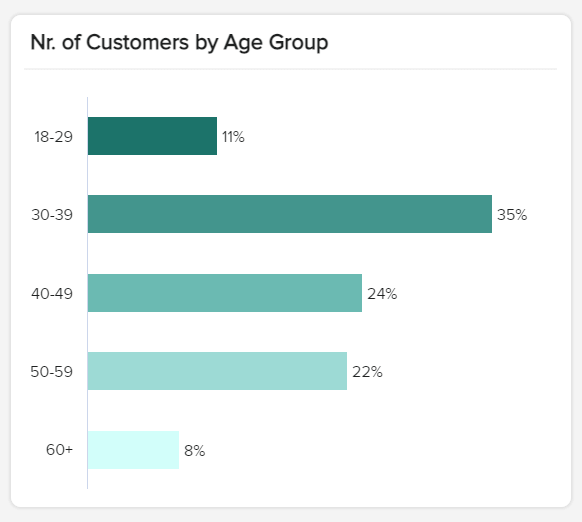
By understanding your customers’ age distribution in detail, you can gain a deep understanding of their preferences. And that’s exactly what this market research report sample KPI does. Presented in a bar chart format, this KPI will give you a full breakdown of your customers’ age ranges, allowing you to build detailed buyer personas and segment your audience effectively.
Why Do You Need Market Research Reports?
As the adage goes, “Look before you leap“ – which is exactly what a research report is here for. As the headlights of a car, they will show you the pitfalls and fast lanes on your road to success: likes and dislikes of a specific market segment in a certain geographical area, their expectations, and readiness. Among other things, a research report will let you:
- Get a holistic view of the market : learn more about the target market and understand the various factors involved in the buying decisions. A broader view of the market lets you benchmark other companies you do not focus on. This, in turn, will empower you to gather the industry data that counts most. This brings us to our next point.
- Curate industry information with momentum: Whether you’re looking to rebrand, improve on an existing service, or launch a new product, time is of the essence. By working with the best market research reports created with modern BI reporting tools , you can visualize your discoveries and data, formatting them in a way that not only unearths hidden insights but also tells a story - a narrative that will gain a deeper level of understanding into your niche or industry. The features and functionality of a market analysis report will help you grasp the information that is most valuable to your organization, pushing you ahead of the pack in the process.
- Validate internal research: Doing the internal analysis is one thing, but double-checking with a third party also greatly helps avoid getting blinded by your own data.
- Use actionable data and make informed decisions: Once you understand consumer behavior as well as the market, your competitors, and the issues that will affect the industry in the future, you are better armed to position your brand. Combining all of it with the quantitative data collected will allow you to more successful product development. To learn more about different methods, we suggest you read our guide on data analysis techniques .
- Strategic planning: When you want to map out big-picture organizational goals, launch a new product development, plan a geographic market expansion, or even a merger and acquisition – all of this strategic thinking needs solid foundations to fulfill the variety of challenges that come along.
- Consistency across the board: Collecting, presenting, and analyzing your results in a way that’s smarter, more interactive, and more cohesive will ensure your customer communications, marketing campaigns, user journey, and offerings meet your audience’s needs consistently across the board. The result? Faster growth, increased customer loyalty, and more profit.
- Better communication: The right market research analysis template (or templates) will empower everyone in the company with access to valuable information - the kind that is relevant and comprehensible. When everyone is moving to the beat of the same drum, they will collaborate more effectively and, ultimately, push the venture forward thanks to powerful online data analysis techniques.
- Centralization: Building on the last point, using a powerful market research report template in the form of a business intelligence dashboard will make presenting your findings to external stakeholders and clients far more effective, as you can showcase a wealth of metrics, information, insights, and invaluable feedback from one centralized, highly visual interactive screen.
- Brand reputation: In the digital age, brand reputation is everything. By making vital improvements in all of the key areas above, you will meet your customers’ needs head-on with consistency while finding innovative ways to stand out from your competitors. These are the key ingredients of long-term success.
How To Present Market Research Analysis Results?
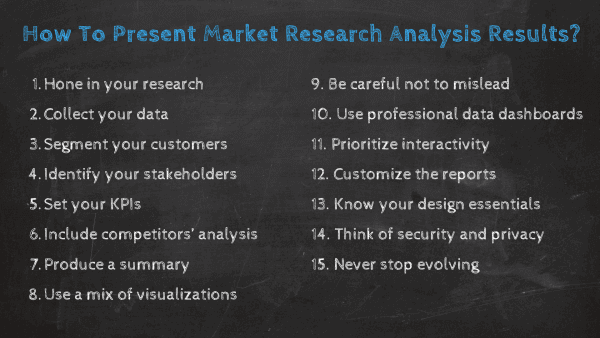
Here we look at how you should present your research reports, considering the steps it takes to connect with the outcomes you need to succeed:
- Collect your data
As with any reporting process, you first and foremost need to collect the data you’ll use to conduct your studies. Businesses conduct research studies to analyze their brand awareness, identity, and influence in the market. For product development and pricing decisions, among many others. That said, there are many ways to collect information for a market research report. Among some of the most popular ones, we find:
- Surveys: Probably the most common way to collect research data, surveys can come in the form of open or closed questions that can be answered anonymously. They are the cheapest and fastest way to collect insights about your customers and business.
- Interviews : These are face-to-face discussions that allow the researcher to analyze responses as well as the body language of the interviewees. This method is often used to define buyer personas by analyzing the subject's budget, job title, lifestyle, wants, and needs, among other things.
- Focus groups : This method involves a group of people discussing a topic with a mediator. It is often used to evaluate a new product or new feature or to answer a specific question that the researcher might have.
- Observation-based research : In this type of research, the researcher or business sits back and watches customers interact with the product without any instructions or help. It allows us to identify pain points as well as strong features.
- Market segmentation : This study allows you to identify and analyze potential market segments to target. Businesses use it to expand into new markets and audiences.
These are just a few of the many ways in which you can gather your information. The important point is to keep the research objective as straightforward as possible. Supporting yourself with professional BI solutions to clean, manage, and present your insights is probably the smartest choice.
2. Hone in on your research:
When looking at how to source consumer research in a presentation, you should focus on two areas: primary and secondary research. Primary research comes from your internal data, monitoring existing organizational practices, the effectiveness of sales, and the tools used for communication, for instance. Primary research also assesses market competition by evaluating the company plans of the competitors. Secondary research focuses on existing data collected by a third party, information used to perform benchmarking and market analysis. Such metrics help in deciding which market segments are the ones the company should focus its efforts on or where the brand is standing in the minds of consumers. Before you start the reporting process, you should set your goals, segmenting your research into primary and secondary segments to get to grips with the kind of information you need to work with to achieve effective results.
3. Segment your customers:
To give your market research efforts more context, you should segment your customers into different groups according to the preferences outlined in the survey or feedback results or by examining behavioral or demographic data.
If you segment your customers, you can tailor your market research and analysis reports to display only the information, charts, or graphics that will provide actionable insights into their wants, needs, or industry-based pain points.
- Identify your stakeholders:
Once you’ve drilled down into your results and segmented your consumer groups, it’s important to consider the key stakeholders within the organization that will benefit from your information the most.
By looking at both internal and external stakeholders, you will give your results a path to effective presentation, gaining the tools to understand which areas of feedback or data are most valuable, as well as most redundant. As a consequence, you will ensure your results are concise and meet the exact information needs of every stakeholder involved in the process.
- Set your KPIs:
First, remember that your reports should be concise and accurate - straight to the point without omitting any essential information. Work to ensure your insights are clean and organized, with participants grouped into relevant categories (demographics, profession, industry, education, etc.). Once you’ve organized your research, set your goals, and cleaned your data, you should set your KPIs to ensure your report is populated with the right visualizations to get the job done. Explore our full library of interactive KPI examples for inspiration.
- Include competitor’s analysis
Whether you are doing product innovation research, customer demographics, pricing, or any other, including some level of insights about competitors in your reports is always recommended as it can help your business or client better understand where they stand in the market. That being said, competitor analysis is not as easy as picking a list of companies in the same industry and listing them. Your main competitor can be just a company's division in an entirely different industry. For example, Apple Music competes with Spotify even though Apple is a technology company. Therefore, it is important to carefully analyze competitors from a general but detailed level.
Providing this kind of information in your reports can also help you find areas that competitors are not exploiting or that are weaker and use them to your advantage to become a market leader.
- Produce your summary:
To complement your previous efforts, writing an executive summary of one or two pages that will explain the general idea of the report is advisable. Then come the usual body parts:
- An introduction providing background information, target audience, and objectives;
- The qualitative research describes the participants in the research and why they are relevant to the business;
- The survey research outlines the questions asked and answered;
- A summary of the insights and metrics used to draw the conclusions, the research methods chosen, and why;
- A presentation of the findings based on your research and an in-depth explanation of these conclusions.
- Use a mix of visualizations:
When presenting your results and discoveries, you should aim to use a balanced mix of text, graphs, charts, and interactive visualizations.
Using your summary as a guide, you should decide which type of visualization will present each specific piece of market research data most effectively (often, the easier to understand and more accessible, the better).
Doing so will allow you to create a story that will put your research information into a living, breathing context, providing a level of insight you need to transform industry, competitor, or consumer info or feedback into actionable strategies and initiatives.
- Be careful not to mislead
Expanding on the point above, using a mix of visuals can prove highly valuable in presenting your results in an engaging and understandable way. That being said, when not used correctly, graphs and charts can also become misleading. This is a popular practice in the media, news, and politics, where designers tweak the visuals to manipulate the masses into believing a certain conclusion. This is a very unethical practice that can also happen by mistake when you don’t pick the right chart or are not using it in the correct way. Therefore, it is important to outline the message you are trying to convey and pick the chart type that will best suit those needs.
Additionally, you should also be careful with the data you choose to display, as it can also become misleading. This can happen if you, for example, cherry-pick data, which means only showing insights that prove a conclusion instead of the bigger picture. Or confusing correlation with causation, which means assuming that because two events happened simultaneously, one caused the other.
Being aware of these practices is of utmost importance as objectivity is crucial when it comes to dealing with data analytics, especially if you are presenting results to clients. Our guides on misleading statistics and misleading data visualizations can help you learn more about this important topic.
- Use professional dashboards:
To optimize your market research discoveries, you must work with a dynamic business dashboard . Not only are modern dashboards presentable and customizable, but they will offer you past, predictive, and real-time insights that are accurate, interactive, and yield long-lasting results.
All market research reports companies or businesses gathering industry or consumer-based information will benefit from professional dashboards, as they offer a highly powerful means of presenting your data in a way everyone can understand. And when that happens, everyone wins.
Did you know? The interactive nature of modern dashboards like datapine also offers the ability to quickly filter specific pockets of information with ease, offering swift access to invaluable insights.
- Prioritize interactivity
The times when reports were static are long gone. Today, to extract the maximum value out of your research data, you need to be able to explore the information and answer any critical questions that arise during the presentation of results. To do so, modern reporting tools provide multiple interactivity features to help you bring your research results to life.
For instance, a drill-down filter lets you go into lower levels of hierarchical data without generating another graph. For example, imagine you surveyed customers from 10 different countries. In your report, you have a chart displaying the number of customers by country, but you want to analyze a specific country in detail. A drill down filter would enable you to click on a specific country and display data by city on that same chart. Even better, a global filter would allow you to filter the entire report to show only results for that specific country.
Through the use of interactive filters, such as the one we just mentioned, you’ll not only make the presentation of results more efficient and profound, but you’ll also avoid generating pages-long reports to display static results. All your information will be displayed in a single interactive page that can be filtered and explored upon need.
- Customize the reports
This is a tip that is valuable for any kind of research report, especially when it comes to agencies that are reporting to external clients. Customizing the report to match your client’s colors, logo, font, and overall branding will help them grasp the data better, thanks to a familiar environment. This is an invaluable tip as often your audience will not feel comfortable dealing with data and might find it hard to understand or intimidating. Therefore, providing a familiar look that is also interactive and easier to understand will keep them engaged and collaborative throughout the process.
Plus, customizing the overall appearance of the report will also make your agency look more professional, adding extra value to your service.
- Know your design essentials
When you’re presenting your market research reports sample to internal or external stakeholders, having a firm grasp on fundamental design principles will make your metrics and insights far more persuasive and compelling.
By arranging your metrics in a balanced and logical format, you can guide users toward key pockets of information exactly when needed. In turn, this will improve decision-making and navigation, making your reports as impactful as possible.
For essential tips, read our 23 dashboard design principles & best practices to enhance your analytics process.
- Think of security and privacy
Cyberattacks are increasing at a concerning pace, making security a huge priority for organizations of all sizes today. The costs of having your sensitive information leaked are not only financial but also reputational, as customers might not trust you again if their data ends up in the wrong hands. Given that market research analysis is often performed by agencies that handle data from clients, security and privacy should be a top priority.
To ensure the required security and privacy, it is necessary to invest in the right tools to present your research results. For instance, tools such as datapine offer enterprise-level security protocols that ensure your information is encrypted and protected at all times. Plus, the tool also offers additional security features, such as being able to share your reports through a password-protected URL or to set viewer rights to ensure only the right people can access and manipulate the data.
- Keep on improving & evolving
Each time you gather or gain new marketing research reports or market research analysis report intel, you should aim to refine your existing dashboards to reflect the ever-changing landscape around you.
If you update your reports and dashboards according to the new research you conduct and new insights you connect with, you will squeeze maximum value from your metrics, enjoying consistent development in the process.
Types of Market Research Reports: Primary & Secondary Research
With so many market research examples and such little time, knowing how to best present your insights under pressure can prove tricky.
To squeeze every last drop of value from your market research efforts and empower everyone with access to the right information, you should arrange your information into two main groups: primary research and secondary research.
A. Primary research
Primary research is based on acquiring direct or first-hand information related to your industry or sector and the customers linked to it.
Exploratory primary research is an initial form of information collection where your team might set out to identify potential issues, opportunities, and pain points related to your business or industry. This type of research is usually carried out in the form of general surveys or open-ended consumer Q&As, which nowadays are often performed online rather than offline .
Specific primary research is definitive, with information gathered based on the issues, information, opportunities, or pain points your business has already uncovered. When doing this kind of research, you can drill down into a specific segment of your customers and seek answers to the opportunities, issues, or pain points in question.
When you’re conducting primary research to feed into your market research reporting efforts, it’s important to find reliable information sources. The most effective primary research sources include:
- Consumer-based statistical data
- Social media content
- Polls and Q&A
- Trend-based insights
- Competitor research
- First-hand interviews
B. Secondary research
Secondary research refers to every strand of relevant data or public records you have to gain a deeper insight into your market and target consumers. These sources include trend reports, market stats, industry-centric content, and sales insights you have at your disposal. Secondary research is an effective way of gathering valuable intelligence about your competitors.
You can gather very precise, insightful secondary market research insights from:
- Public records and resources like Census data, governmental reports, or labor stats
- Commercial resources like Gartner, Statista, or Forrester
- Articles, documentaries, and interview transcripts
Another essential branch of both primary and secondary research is internal intelligence. When it comes to efficient market research reporting examples that will benefit your organization, looking inward is a powerful move.
Existing sales, demographic, or marketing performance insights will lead you to valuable conclusions. Curating internal information will ensure your market research discoveries are well-rounded while helping you connect with the information that will ultimately give you a panoramic view of your target market.
By understanding both types of research and how they can offer value to your business, you can carefully choose the right informational sources, gather a wide range of intelligence related to your specific niche, and, ultimately, choose the right market research report sample for your specific needs.
If you tailor your market research report format to the type of research you conduct, you will present your visualizations in a way that provides the right people with the right insights, rather than throwing bundles of facts and figures on the wall, hoping that some of them stick.
Taking ample time to explore a range of primary and secondary sources will give your discoveries genuine context. By doing so, you will have a wealth of actionable consumer and competitor insights at your disposal at every stage of your organization’s development (a priceless weapon in an increasingly competitive digital age).
Dynamic market research is the cornerstone of business development, and a dashboard builder is the vessel that brings these all-important insights to life. Once you get into that mindset, you will ensure that your research results always deliver maximum value.
Common Challenges & Mistakes Of Market Research Reporting & Analysis
We’ve explored different types of market research analysis examples and considered how to conduct effective research. Now, it’s time to look at the key mistakes of market research reporting. Let’s start with the mistakes.
The mistakes
One of the biggest mistakes that stunt the success of a company’s market research efforts is strategy. Without taking the time to gather an adequate mix of insights from various sources and define your key aims or goals, your processes will become disjointed. You will also suffer from a severe lack of organizational vision.
For your market research-centric strategy to work, everyone within the company must be on the same page. Your core aims and objectives must align throughout the business, and everyone must be clear on their specific role. If you try to craft a collaborative strategy and decide on your informational sources from the very start of your journey, your strategy will deliver true growth and intelligence.
- Measurement
Another classic market research mistake is measurement – or, more accurately, a lack of precise measurement. When embarking on market intelligence gathering processes, many companies fail to select the right KPIs and set the correct benchmarks for the task at hand. Without clearly defined goals, many organizations end up with a market analysis report format that offers little or no value in terms of decision-making or market insights.
To drive growth with your market research efforts, you must set clearly defined KPIs that align with your specific goals, aims, and desired outcomes.
- Competition
A common mistake among many new or scaling companies is failing to explore and examine the competition. This will leave you with gaping informational blindspots. To truly benefit from market research, you must gather valuable nuggets of information from every key source available. Rather than solely looking at your consumers and the wider market (which is incredibly important), you should take the time to see what approach your direct competitors have adopted while getting to grips with the content and communications.
One of the most effective ways of doing so (and avoiding such a monumental market research mistake) is by signing up for your competitors’ mailing lists, downloading their apps, and examining their social media content. This will give you inspiration for your own efforts while allowing you to exploit any gaps in the market that your competitors are failing to fill.
The challenges
- Informational quality
We may have an almost infinite wealth of informational insights at our fingertips, but when it comes to market research, knowing which information to trust can prove an uphill struggle.
When working with metrics, many companies risk connecting with inaccurate insights or leading to a fruitless informational rabbit hole, wasting valuable time and resources in the process. To avoid such a mishap, working with a trusted modern market research and analysis sample is the only way forward.
- Senior buy-in
Another pressing market research challenge that stunts organizational growth is the simple case of senior buy-in. While almost every senior decision-maker knows that market research is an essential component of a successful commercial strategy, many are reluctant to invest an ample amount of time or money in the pursuit.
The best way to overcome such a challenge is by building a case that defines exactly how your market research strategies will offer a healthy ROI to every key aspect of the organization, from marketing and sales to customer experience (CX) and beyond.
- Response rates
Low interview, focus group, or poll response rates can have a serious impact on the success and value of your market research strategy. Even with adequate senior buy-in, you can’t always guarantee that you will get enough responses from early-round interviews or poll requests. If you don’t, your market research discoveries run the risk of being shallow or offering little in the way of actionable insight.
To overcome this common challenge, you can improve the incentive you offer your market research prospects while networking across various platforms to discover new contact opportunities. Changing the tone of voice of your ads or emails will also help boost your consumer or client response rates.
Bringing Your Reports a Step Further
Even if it is still widespread for market-style research results presentation, using PowerPoint at this stage is a hassle and presents many downsides and complications. When busy managers or short-on-time top executives grab a report, they want a quick overview that gives them an idea of the results and the big picture that addresses the objectives: they need a dashboard. This can be applied to all areas of a business that need fast and interactive data visualizations to support their decision-making.
We all know that a picture conveys more information than simple text or figures, so managing to bring it all together on an actionable dashboard will convey your message more efficiently. Besides, market research dashboards have the incredible advantage of always being up-to-date since they work with real-time insights: the synchronization/updating nightmare of dozens of PowerPoint slides doesn’t exist for you anymore. This is particularly helpful for tracking studies performed over time that recurrently need their data to be updated with more recent ones.
In today’s fast-paced business environment, companies must identify and grab new opportunities as they arise while staying away from threats and adapting quickly. In order to always be a step further and make the right decisions, it is critical to perform market research studies to get the information needed and make important decisions with confidence.
We’ve asked the question, “What is a market research report?”, and examined the dynamics of a modern market research report example, and one thing’s for sure: a visual market research report is the best way to understand your customer and thus increase their satisfaction by meeting their expectations head-on.
From looking at a sample of a market research report, it’s also clear that modern dashboards help you see what is influencing your business with clarity, understand where your brand is situated in the market, and gauge the temperature of your niche or industry before a product or service launch. Once all the studies are done, you must present them efficiently to ensure everyone in the business can make the right decisions that result in real progress. Market research reports are your key allies in the matter.
To start presenting your results with efficient, interactive, dynamic research reports and win on tomorrow’s commercial battlefield, try our dashboard reporting software and test every feature with our 14-day free trial !

- B2B Market Research
- Brand Market Research
- Concept & Product testing
- Consumer Market Research
- Consumer Online Panel
- Global Physicians Panel
- Healthcare Market Research
- Omnibus Research
- Online Market Research
- Tracking Research
- Focus Groups / Online Focus Groups
- Ethnographic Market Research
- In-Depth Interviews
- Online bulletin boards
- Usability and Testing Research
- Face to Face Interviews
- Online Surveys
- Computer Aided Telephonic Interviews (CATI)
- Computer Assisted Personal Interviews (CAPI)
- Central Location Test
- Animal Health
- Automotive Industry
- Banking and Financial Services
- Chemical Industry
- Consumer Health
- Consumer Packaged Goods
- Energy and Utilities
- Food and Drinks
- Government and Public Sector
- IT and Telecommunication
- Medical Devices and Diagnostics
- Pharmaceuticals
- Retail Industry
- Travel & Tourism
- Esomar 28 Questions
- Market Research Associations
- Research Methods
- Terms of Business
- Privacy Policy
- Animal Health Market Research
- Automotive Market Research
- Banking and Financial Services Market Research
- Chemical Market Research
- Consumer Health Market Research
- Consumer Packaged Goods Market Research
- Energy and Utilities Market Research
- Food and Drink Market Research
- Government and Public Sector Market Research
- IT and Telecommunication Market Research
- Research Services
InVeritas Research’s tracking studies help clients to evaluate and improve their brand management, performance, profitability and potential opportunities to target new customer segment and grow brands.
It also helps clients to gain insight of their brand, changes in the customer market such as increases or decreases in category usage, changes in customer demand or behavior, new customer segments, and changes in customer loyalty and retention time to time.
Our Brand Tracking Research services include:
- Sampling and ensuring consistent sample for all the waves
- Ensures that the surveys reach the right people
- Our Survey design teams ensure that the tracker can be completed across different types of devices, delivering consistent and accurate results.
- With a strong global consumer and healthcare panel, InVeritas Research ensures complete solutions to your research needs
Our Research Services
Market Research: A How-To Guide and Template
Discover the different types of market research, how to conduct your own market research, and use a free template to help you along the way.

MARKET RESEARCH KIT
5 Research and Planning Templates + a Free Guide on How to Use Them in Your Market Research

Updated: 02/21/24
Published: 02/21/24
Today's consumers have a lot of power. As a business, you must have a deep understanding of who your buyers are and what influences their purchase decisions.
Enter: Market Research.
![market research studies tracking → Download Now: Market Research Templates [Free Kit]](https://no-cache.hubspot.com/cta/default/53/6ba52ce7-bb69-4b63-965b-4ea21ba905da.png)
Whether you're new to market research or not, I created this guide to help you conduct a thorough study of your market, target audience, competition, and more. Let’s dive in.
Table of Contents
What is market research?
Primary vs. secondary research, types of market research, how to do market research, market research report template, market research examples.
Market research is the process of gathering information about your target market and customers to verify the success of a new product, help your team iterate on an existing product, or understand brand perception to ensure your team is effectively communicating your company's value effectively.
Market research can answer various questions about the state of an industry. But if you ask me, it's hardly a crystal ball that marketers can rely on for insights on their customers.
Market researchers investigate several areas of the market, and it can take weeks or even months to paint an accurate picture of the business landscape.
However, researching just one of those areas can make you more intuitive to who your buyers are and how to deliver value that no other business is offering them right now.
How? Consider these two things:
- Your competitors also have experienced individuals in the industry and a customer base. It‘s very possible that your immediate resources are, in many ways, equal to those of your competition’s immediate resources. Seeking a larger sample size for answers can provide a better edge.
- Your customers don't represent the attitudes of an entire market. They represent the attitudes of the part of the market that is already drawn to your brand.
The market research services market is growing rapidly, which signifies a strong interest in market research as we enter 2024. The market is expected to grow from roughly $75 billion in 2021 to $90.79 billion in 2025 .
.png)
Free Market Research Kit
- SWOT Analysis Template
- Survey Template
- Focus Group Template
You're all set!
Click this link to access this resource at any time.
Why do market research?
Market research allows you to meet your buyer where they are.
As our world becomes louder and demands more of our attention, this proves invaluable.
By understanding your buyer's problems, pain points, and desired solutions, you can aptly craft your product or service to naturally appeal to them.
Market research also provides insight into the following:
- Where your target audience and current customers conduct their product or service research
- Which of your competitors your target audience looks to for information, options, or purchases
- What's trending in your industry and in the eyes of your buyer
- Who makes up your market and what their challenges are
- What influences purchases and conversions among your target audience
- Consumer attitudes about a particular topic, pain, product, or brand
- Whether there‘s demand for the business initiatives you’re investing in
- Unaddressed or underserved customer needs that can be flipped into selling opportunity
- Attitudes about pricing for a particular product or service
Ultimately, market research allows you to get information from a larger sample size of your target audience, eliminating bias and assumptions so that you can get to the heart of consumer attitudes.
As a result, you can make better business decisions.
To give you an idea of how extensive market research can get , consider that it can either be qualitative or quantitative in nature — depending on the studies you conduct and what you're trying to learn about your industry.
Qualitative research is concerned with public opinion, and explores how the market feels about the products currently available in that market.
Quantitative research is concerned with data, and looks for relevant trends in the information that's gathered from public records.
That said, there are two main types of market research that your business can conduct to collect actionable information on your products: primary research and secondary research.
Primary Research
Primary research is the pursuit of first-hand information about your market and the customers within your market.
It's useful when segmenting your market and establishing your buyer personas.
Primary market research tends to fall into one of two buckets:
- Exploratory Primary Research: This kind of primary market research normally takes place as a first step — before any specific research has been performed — and may involve open-ended interviews or surveys with small numbers of people.
- Specific Primary Research: This type of research often follows exploratory research. In specific research, you take a smaller or more precise segment of your audience and ask questions aimed at solving a suspected problem.
Secondary Research
Secondary research is all the data and public records you have at your disposal to draw conclusions from (e.g. trend reports, market statistics, industry content, and sales data you already have on your business).
Secondary research is particularly useful for analyzing your competitors . The main buckets your secondary market research will fall into include:
- Public Sources: These sources are your first and most-accessible layer of material when conducting secondary market research. They're often free to find and review — like government statistics (e.g., from the U.S. Census Bureau ).
- Commercial Sources: These sources often come in the form of pay-to-access market reports, consisting of industry insight compiled by a research agency like Pew , Gartner , or Forrester .
- Internal Sources: This is the market data your organization already has like average revenue per sale, customer retention rates, and other historical data that can help you draw conclusions on buyer needs.
- Focus Groups
- Product/ Service Use Research
- Observation-Based Research
- Buyer Persona Research
- Market Segmentation Research
- Pricing Research
- Competitive Analysis Research
- Customer Satisfaction and Loyalty Research
- Brand Awareness Research
- Campaign Research
1. Interviews
Interviews allow for face-to-face discussions so you can allow for a natural flow of conversation. Your interviewees can answer questions about themselves to help you design your buyer personas and shape your entire marketing strategy.
2. Focus Groups
Focus groups provide you with a handful of carefully-selected people that can test out your product and provide feedback. This type of market research can give you ideas for product differentiation.
3. Product/Service Use Research
Product or service use research offers insight into how and why your audience uses your product or service. This type of market research also gives you an idea of the product or service's usability for your target audience.
4. Observation-Based Research
Observation-based research allows you to sit back and watch the ways in which your target audience members go about using your product or service, what works well in terms of UX , and which aspects of it could be improved.
5. Buyer Persona Research
Buyer persona research gives you a realistic look at who makes up your target audience, what their challenges are, why they want your product or service, and what they need from your business or brand.
6. Market Segmentation Research
Market segmentation research allows you to categorize your target audience into different groups (or segments) based on specific and defining characteristics. This way, you can determine effective ways to meet their needs.
7. Pricing Research
Pricing research helps you define your pricing strategy . It gives you an idea of what similar products or services in your market sell for and what your target audience is willing to pay.
8. Competitive Analysis
Competitive analyses give you a deep understanding of the competition in your market and industry. You can learn about what's doing well in your industry and how you can separate yourself from the competition .
9. Customer Satisfaction and Loyalty Research
Customer satisfaction and loyalty research gives you a look into how you can get current customers to return for more business and what will motivate them to do so (e.g., loyalty programs , rewards, remarkable customer service).
10. Brand Awareness Research
Brand awareness research tells you what your target audience knows about and recognizes from your brand. It tells you about the associations people make when they think about your business.
11. Campaign Research
Campaign research entails looking into your past campaigns and analyzing their success among your target audience and current customers. The goal is to use these learnings to inform future campaigns.
- Define your buyer persona.
- Identify a persona group to engage.
- Prepare research questions for your market research participants.
- List your primary competitors.
- Summarize your findings.
1. Define your buyer persona.
You have to understand who your customers are and how customers in your industry make buying decisions.
This is where your buyer personas come in handy. Buyer personas — sometimes referred to as marketing personas — are fictional, generalized representations of your ideal customers.
Use a free tool to create a buyer persona that your entire company can use to market, sell, and serve better.

Don't forget to share this post!
Related articles.
![market research studies tracking SWOT Analysis: How To Do One [With Template & Examples]](https://blog.hubspot.com/hubfs/marketingplan_20.webp)
SWOT Analysis: How To Do One [With Template & Examples]

20+ Tools & Resources for Conducting Market Research

TAM SAM SOM: What Do They Mean & How Do You Calculate Them?
![market research studies tracking How to Run a Competitor Analysis [Free Guide]](https://blog.hubspot.com/hubfs/Google%20Drive%20Integration/how%20to%20do%20a%20competitor%20analysis_122022.jpeg)
How to Run a Competitor Analysis [Free Guide]
![market research studies tracking 5 Challenges Marketers Face in Understanding Audiences [New Data + Market Researcher Tips]](https://blog.hubspot.com/hubfs/challenges%20marketers%20face%20in%20understanding%20the%20customer%20.png)
5 Challenges Marketers Face in Understanding Audiences [New Data + Market Researcher Tips]

Causal Research: The Complete Guide

Total Addressable Market (TAM): What It Is & How You Can Calculate It

What Is Market Share & How Do You Calculate It?
![market research studies tracking 3 Ways Data Privacy Changes Benefit Marketers [New Data]](https://blog.hubspot.com/hubfs/how-data-privacy-benefits-marketers_1.webp)
3 Ways Data Privacy Changes Benefit Marketers [New Data]

What is a Competitive Analysis — and How Do You Conduct One?
Free Guide & Templates to Help Your Market Research
Marketing software that helps you drive revenue, save time and resources, and measure and optimize your investments — all on one easy-to-use platform
- A/B Monadic Test
- A/B Pre-Roll Test
- Key Driver Analysis
- Multiple Implicit
- Penalty Reward
- Price Sensitivity
- Segmentation
- Single Implicit
- Category Exploration
- Competitive Landscape
- Consumer Segmentation
- Innovation & Renovation
- Product Portfolio
- Marketing Creatives
- Advertising
- Shelf Optimization
- Performance Monitoring
- Better Brand Health Tracking
- Ad Tracking
- Trend Tracking
- Satisfaction Tracking
- AI Insights
- Case Studies
quantilope is the Consumer Intelligence Platform for all end-to-end research needs
8 Types of Market Research Studies and How To Use Them

A market research study is a study that brands create to understand their target audience from a variety of angles (who they are, what they do, how they act, and other behaviors relevant to their business decisions). With a variety of market research study types available, the trick is knowing which type will deliver the right kind of information.
In this blog, we look at 8 different types of market research studies and how they can tap into the specific insights needed to steer a business toward success.
Table of contents:
- Brand research studies
- Consumer insights research
- Customer satisfaction research
- Product/service research
- Competitor research
- Segmentation research
- Advertising research
- Usability testing
1. Brand research studies
A brand image can be a company’s greatest asset, so it’s crucial that businesses know how their brand or portfolio of brands is performing from a consumer point of view. This includes:
Brand awareness and recall:
Whether consumers know your brand exists, and whether they remember it (spontaneously)
Brand image:
How consumers perceive your brand and your brand's overall reputation
Brand positioning:
Your brand's values, personality, and where it sits within the competitive set
Brand performance:
How your brand is selling/performing in the market, and its projected future sales
Brand trust:
Whether your brand is viewed as reliable and if consumers trust it
Brand loyalty:
Whether customers stick with your brand or move on to a competitor instead
All of these brand topics can be researched using a mixture of qualitative and quantitative research, and oftentimes it would be advantageous to combine them. Aspects like brand awareness and brand loyalty are best understood via quantitative methods as solid percentages can be attached to awareness and loyalty amongst different customer segments or demographics (e.g. by life stage, location, gender). The more nuanced aspects of brand image and positioning can really be brought to life through qualitative research ; hearing from consumers in their own words can clearly explain how they feel, what their body image says about the brand, and other sentiment analyses. Depending on a brand's needs, qualitative research might be used to prompt ideas for a later quantitative study, supplement insights from a previously-run quantitative study, or, used on its own.
Brands can track t hese metrics over a period of time using a brand health tracking approach - an equally incremented capture of consumer data to see how consumer perceptions around a brand change over time. Back to table of contents
2. Consumer insights research
Consumer insights are all about putting together a comprehensive picture of who your target market is: their demographics, their lifestyles, their likes and dislikes, what’s important to them, their values, needs, and behaviors. It can be thought of as a ‘scene-setting’ exercise, so that brands can build consumer profiles that help guide their marketing or product development strategies. Brands might also want to run consumer insights research with regard to a certain area of its business: branding, social media activity, or product usage, for example.
Sales data can act as a starting point for consumer insights research, which brings useful knowledge around demographics. Knowing who buys your brand will determine which types of people to recruit for future market research studies. For example, if you know your customer base is made up mainly of women, you might set a sample quota that is 80% female and 20% male. Like brand research studies, consumer insights research is beneficial both quantitatively and qualitatively. Q uantitative research will provide insights in the form of numerical data while q ualitative research (focus groups, interviews and observations) are useful for exploring consumers' values, needs, and behaviors in further context. Back to table of contents
3. Customer satisfaction research
Satisfaction research investigates which areas of a brand or product are performing well and which could do with improvement. In most cases, quantitative research is used since businesses need the reliability of larger numbers to show how satisfied customers are. Survey questions ask respondents to score the brand/product/service on a variety of metrics (e.g. usability, reliability, value for money, design, taste, etc.) and computer-based analysis tools are used to calculate satisfaction according to those scores. NPS (Net Promoter Score) is a common methodology used for this research purpose. NPS measures how likely a consumer is to recommend a product or brand to someone they know, which gives a good indication of the value they attach to it . Back to table of contents
4. Product/service research
Product or service research forms a core part of market research in many businesses. For existing products, ensuring they remain relevant and achieve sales targets means making changes to them when appropriate. Product development research involves capturing consumer feedback on a product to identify what’s working well or where the pain points are, which feeds into ideas for improving the offer. New product research involves presenting respondents with a concept or product mock-up/prototype and gathering feedback, while new service research means exploring the potential of a brand's service that hasn't existed before. As with many studies, qual and quant both play their part here, with qual nailing down the issues that exist and quant putting numbers against them. Back to table of contents
5. Competitor research
Regardless of the business you’re in, knowing what/who you’re up against in your category is essential. Understanding your competitors’ strengths and weaknesses means your brand can capitalize on gaps in the market and create an option for consumers that meets their needs. This is an area where existing sales and performance data on a variety of brands can be used effectively and cheaply, as this information is generally freely available (i.e. secondary data). But primary research (new research carried out to explore the issue at hand) also has its place, with focus groups hammering out the pros and cons of various brands, and quantitative market research rating brands on relevant metrics. Once findings are in, a SWOT analysis (strengths, weaknesses, opportunities, and threats) can be created to identify what a brand should continue doing and where it should improve.
Back to table of contents
One of the best ways to understand competitors is to use a multi-implicit association test:

6. Segmentation research
Market segmentation takes a target market and divides it up into groups that share similar traits, preferences, attitudes, needs, and behaviors. It is a useful way to understand that a target market isn’t one homogenous mass of people, but that it includes different groups who operate in different ways. This is powerful knowledge to have when developing marketing messages, as sub-groups will respond in different ways to advertising and other communications. Segmentation is primarily done through quantitative means to size the groups and quantify the prominence of traits, though segments can always be further explored through qualitative research as well. Back to table of contents
7. Advertising research
Any business should care about whether or not its advertising is resonating with consumers in terms of message, style, and tone. Testing a selection of possible campaign routes (with an A/B test for example) helps advertising teams make the right decisions about which one to run with. Brands can test all sorts of elements in an A/B test such as advertising channel, ad format, color scheme, font size, logo placement , and so on. As with other types of research, qual research can help in gauging initial reactions to ad executions amongst a small audience, as well as refining them once quantitative research has taken place (or, vice versa). Quantitative research delivers scores on different aspects of the advertising, thereby showing which are working well, which are irrelevant, and which require improvement. Back to table of contents
8. Usability testing
Usability testing asks respondents to use a product or service and report on how well it performs. This could be anything from a car, to a website, to a pack of cleaning wipes. Qualitative research excels here at revealing the pertinent issues that might not have been uncovered if the research had gone straight into a quantitative approach (i.e. a consumer explaining that the scent of a cleaning wipe reminded them of a negative experience and that's why they rated it poorly). Ethnographical research is a form of qualitative research that sheds light on how products or services are actually used, so that design teams can work on the technicalities a product. Quantitative research (whether done before, after, or apart from qualitative research) can quantifies how many consumers report good/bad usability of a product, and for what reasons. Back to table of contents
Choose the right research method with quantilope
quantilope can help with all aspects of your research and marketing strategy. Its online qual and quant tools deliver high-quality research for all eight of the research study types outlined above and many more.
quantilope’s online survey platform makes quantitative research simple to set up, analyze, and present. With just a few clicks, you can create a questionnaire to be sent to target customers in a fraction of the time it takes with traditional research vendors. When results come in, quantilope’s automated advanced research methods take the data and model it in a way that makes the findings actionable for your business. Analysis tools like MaxDiff will identify which features of a brand or product are most important in the purchase decision, or which parts of an advertising message are most motivating. Key Driver Analysis will reveal which attributes are most likely to end in a positive outcome (customer satisfaction, loyalty, or purchase, for example.) Meanwhile, quantilope’s dedicated segmentation tool will map your target market and identify the defining characteristics and needs of each. These are just a few of quantilope’s advanced analysis methods - each created to solve specific business issues.
In addition to our quantitative offer, quantilope’s inColor video research tool takes a qualitative approach to research. Respondents post videos of themselves answering specific research questions, talking generally about a research topic, or even using a product or service. Brands can put together a sample as large or small as they wish, then use the videos to create showreels for their stakeholders that illustrate consumer views on the topics covered.
If you’d like to chat more about what quantilope's end-to-end Consumer Intelligence Platform can do for your business, get in touch below:
Request a demo!
Related posts, quirk's virtual event: fab-brew-lous collaboration: product innovations from the melitta group, brand value: what it is, how to build it, and how to measure it, what are brand perceptions and how can you measure them, how can brands build, measure, and manage brand equity.
Root out friction in every digital experience, super-charge conversion rates, and optimize digital self-service
Uncover insights from any interaction, deliver AI-powered agent coaching, and reduce cost to serve
Increase revenue and loyalty with real-time insights and recommendations delivered to teams on the ground
Know how your people feel and empower managers to improve employee engagement, productivity, and retention
Take action in the moments that matter most along the employee journey and drive bottom line growth
Whatever they’re are saying, wherever they’re saying it, know exactly what’s going on with your people
Get faster, richer insights with qual and quant tools that make powerful market research available to everyone
Run concept tests, pricing studies, prototyping + more with fast, powerful studies designed by UX research experts
Track your brand performance 24/7 and act quickly to respond to opportunities and challenges in your market
Explore the platform powering Experience Management
- Free Account
- For Digital
- For Customer Care
- For Human Resources
- For Researchers
- Financial Services
- All Industries
Popular Use Cases
- Customer Experience
- Employee Experience
- Employee Exit Interviews
- Net Promoter Score
- Voice of Customer
- Customer Success Hub
- Product Documentation
- Training & Certification
- XM Institute
- Popular Resources
- Customer Stories
- Market Research
- Artificial Intelligence
- Partnerships
- Marketplace
The annual gathering of the experience leaders at the world’s iconic brands building breakthrough business results, live in Salt Lake City.
- English/AU & NZ
- Español/Europa
- Español/América Latina
- Português Brasileiro
- REQUEST DEMO
- Experience Management
- Market Research Surveys
- What is market research survey
Why use surveys?
Survey research methods.
- Conducting market research surveys
- Common mistakes with market research surveys?
The different types of survey methods
Survey tools for your survey method, what can businesses do with these types of surveys, how to write a research survey (free example templates), try qualtrics for free, types of market research surveys.
20 min read There are different types of survey research you can run, but the majority of research is conducted with just a handful of research survey methods. We explore what they are and how to use them.
What is a market research survey?
A market research survey is a way of getting feedback directly from the people who have the ultimate say in your organization’s success: your customers.
Unlike focus groups or interviews, market research surveys allow you to get detailed feedback at scale — from behaviors to overall experiences — and in a standardized format. Also, as the data is easy to process, you can quickly turn it into actionable insights .
Surveys are used to collect primary research, which means market research data that you collect yourself. The other type is secondary data, which is obtained from other sources, for example census data.
Surveys are among the most popular methods of primary market research, since they can be used to gather qualitative and quantitative research on market trends, and they can cover a huge range of respondents across your customer base. They’re also a format familiar to many people.
Get started with our free survey software
Surveys are ultimately about understanding your target audience, but they can go beyond your customer base. They can be taken by anyone — employees, potential future customers, and even those who don’t want to engage with your business (helping you to identify the ones that do).
However, a survey isn’t a stand-alone solution. It can work alongside other survey methods, such as focus groups, field studies, observation, and market analysis, to help you get a clear picture of your market and decide what direction to take.
But with all these different types of survey methods, and some being better than others in specific areas (e.g. data quality, collecting feedback), where should you start?
To get the best out of each survey research type, consider what you can invest in terms of:
- Time: How quickly do you need the survey research? Do you have time to conduct research?
- Money: Do you have the budget to invest in research overheads?
- Knowledge of analytics: Are you trained to interpret the collected data? If not, do you have a partner you can work with to get the insights you need?
- Research expertise: Do you have clearly defined problems or challenges that you want to explore or understand through surveys?
- Technology capability: Is your survey software up to the task of analyzing the data?
- Your audience’s response: Is it likely that your audience will respond? What survey types (online surveys, etc.) would they be most receptive to?
- Slow responses: Do you have a strategy in place to avoid low response rates?
Conducting market research surveys: best practices
Today’s market research industry is advancing rapidly, thanks in part to new technologies which make it easier to conduct market research, and offer more power and sophistication when it comes to analyzing your data.
Data-driven research is the standard across market research and other disciplines, and within the sector competition between brands is driving progress towards better and better market research tools. Beyond customer satisfaction, demographic questions and competitive analysis, today’s tools can dive deeper into your data, unearthing key drivers behind trends and even providing aggregated data on emotions and attitudes in customer feedback.
However, none of these technological advances can replace humans. To conduct market research successfully, you need to be able to combine tech with insight, intelligence and intuition, especially when you’re dealing directly with target customers, for example during a phone interview or when you’re approaching existing customers whose relationship to your brand needs to be maintained.
As we’ll see in this guide, market research can be used in a huge range of contexts, including brand tracking, customer experience research, employee experience programs, and of course product development. Whichever application you’re looking at, it’s essential to prepare thoroughly before sending out your surveys.
- Make sure your research question has been formulated and agreed by everyone involved in the project
- Develop a communications plan to maximize the chances of people engaging with your survey, including introductions, publicity, reminders and follow-up
- Consider using pre-testing before you fully launch your survey to thoroughly road-test it and iron out any issues
- Close the loop – after the study is complete and actions have been taken, let participations know how their contribution helped
- Consider a research panel for future surveys, either one you’ve built yourself or one managed by a third party provider
What are some common mistakes with market research surveys?
With the right survey tools and appropriate support from your survey platform provider, everything should go smoothly, even if you’re not an expert at doing your own market research. However, there are a few things to watch out for.
Choosing the wrong people to survey
Figuring out who you’re going to survey in the first place may seem like an obvious first step and not one you need to spend much time on. But in fact it’s possible to get it wrong, survey the wrong people and end up running a market research study with unreliable data. This is sometimes called ‘sample framing error’
Getting your sample size wrong
If your sample is too small, you run the risk of getting a sample group that doesn’t adequately reflect your target population. This can throw your entire market research survey off course. But if the sample is too large, you spend time and money on research that doesn’t add significant value. Have a look at our sample size calculator to help determine the right sample size for your market research surveys.
Using the wrong kinds of analysis
Do you know your conjoint analysis from your T-test? Understanding the basic types of statistical tests you can use to analyze market research survey data is essential if you’re not using a survey tool with built-in analytics. You’ll need to match the kind of data you’re collecting to the analysis method you choose in order to get accurate insights from your market research surveys.
Writing confusing survey questions
Survey questions aren’t like the questions we use in everyday speech, or even like the ones we ask in formal writing. They need to be highly specific, include appropriate context, and be free of any kind of descriptive or persuasive element that might introduce bias. For a primer on writing great market research survey questions, see our guide to great survey questions
You should choose your survey method based on your target audience, distribution capabilities, and the questions you want answered. For example, interviews are far more personal and explorative by nature, but they’re difficult and costly to scale. Online surveys, on the other hand, have far greater reach and much more affordable — but you lose the opportunity to connect with respondents. Let’s go through the different types and how you can use them.

Online surveys
Online surveys are accessible to any participant across the globe, providing they have an internet connection. You can create online surveys using survey platforms and distribute them via email using a link, or respondents can go directly to the online survey and complete it.
Paper surveys
Paper surveys (or written surveys) are printed surveys filled in by hand. This method works well if respondents have enough time (and incentive) to complete the survey, and the researcher is happy to manually collect the data before collating and interpreting the answers.
Mail surveys
Mail surveys provide exceptional geographical coverage as they can be printed off and sent via the post. However, as recipients need to return the surveys for counting, it’s recommended that you include a pre-paid returns envelope in the original envelope, otherwise you’ll have lower response rates.
Telephone surveys
Telephone surveys involve asking respondents a series of questions over the phone. It’s a popular survey method as it’s convenient for researchers and doesn’t require a lot of capital to do. However, researchers may need to invest time to set up interviews with participants and take notes during the process.
In-person interviews / face-to-face surveys
In-person interviews and face-to-face surveys are great opportunities to get more insightful and valuable responses from participants. You can quickly find out why they think and feel the way that they do, providing an unbiased view of a subject or issue. However, like telephone surveys, they require a lot of time to set up and gather data.
Panel surveys
Panel surveys use a pre-selected group of people as the sample, so that the research can be carried out quickly. It presents a happy medium between the speed and quality of research data.
Based on the type of survey method you choose, here are the types of tools you need and can use for each:
A good internet connection is required for participants to access online surveys, though mobile devices data plans mean that most people can connect to the internet easily.
A good survey software platform is needed to give you full functionality and flexibility, so your online surveys can be customized and optimized. However, businesses can get more for their money with a survey software system that does more for the company.
For example, the Qualtrics XM Platform™ is a best-of-breed experience operating system for experience management. It brings all your operational and experience data together from across the organization to help create and improve experiences for employees, customers, prospects and more. It automatically updates records, has an in-built analytics engine and can handle research projects, from start to finish, in a few clicks.
All you need are paper, ink, pens and clipboards — but due to environmental and sustainability concerns, particularly paper waste and ink pollution, you may want to opt for a more digitized solution.
For mail surveys, the resources and concerns are the same as with paper surveys — but the main difference is distribution.
Ultimately, you need a reliable postal service that can deliver to your target audience. It also becomes costly if you want to include international respondents.
As long as you have good connectivity and network coverage, telephone surveys are straightforward. That said, survey calls can last a long time, so if you plan to include international audiences, ensure you can afford the calling costs.
The only requirement for in-person interviews and face-to-face surveys is a venue to hold them in.
These require participants to be available at the time of the research. Traditionally, third-party generated research panels are available as a service to companies that don’t have access to the audiences they need.
The surveys we explored can be used for four purposes in any business:
1. Market surveys
These help you understand who’s out there, what they want, and how you can best meet their needs.
Market description surveys
Purpose: to determine the size and relative market share of the market. Such studies provide key information about market growth, competitive positioning, and tracking share of the market .
Market profiling / segmentation surveys
Purpose: to identify who the customers are , who they are not, and why they are or are not your customers. This is often a descriptive market segmentation and market share analysis.
Stage in the purchase process / tracking surveys
Where is the customer in the adoption process? This information shows Market Awareness – Knowledge – Intention – Trial – Purchase – Repurchase of the product.
2. Customer experience surveys
This kind of survey helps you put yourself in the customer’s shoes and look at your business from their perspective.
Customer intention – purchase analysis surveys
Purpose: Directed at understanding the current customer. What motivates the customer to move from interest in the product to actual purchase? This is key to understanding customer conversion, commitment, and loyalty .
Customer attitudes and expectations surveys
Purpose: Used to direct advertising and improve customer conversion, commitment, and loyalty. Does the product meet customer expectations ? What attitudes have customers formed about the product and/or company?
Learn how you can set up and run customer attitudes and use surveys
Sales lead generation surveys
Purpose: Sales lead generation surveys are for
- assuring timely use and follow-up of sales leads
- qualifying sales leads (thereby saving valuable sales force time)
- providing more effective tracking of sales leads
Customer trust / loyalty / retention analysis surveys
Purpose: Especially helpful for high-priced consumer goods with a long decision and purchase processes (time from need recognition to purchase), this type of study explores the depth of consumer attitudes formed about the product and/or company.
Salesforce effectiveness surveys
Purpose: A combination of measures that focus on the sales activities, performance, and effectiveness in producing the desired and measurable effect or goal. Often measured as a 360-degree survey completed by the salesperson, the client (evaluating the sales call), and the supervisor responsible for evaluating the salesperson.
Customer service surveys
Purpose: Akin to customer satisfaction surveys, customer service surveys instead focus in detail on the actual customer service that was received, the process involved in receiving that service, and the evaluation of the participants in the service process.
Customer service representative (CSR) surveys
Purpose: CSRs often exhibit frustration, burnout, and high turnover . Surveys focus on CSR retention, reducing costs, and increasing the quality of customer relationships.
Attitudes, burnout, turnover, and retention: CSRs hold attitudes that reflect on their job-related activities including:
- the allocation of time
- solutions to customer needs
- how to improve their job
- best practices
- how well internal departments help customers
3. Product surveys
As part of product development, surveys help you find out what features, benefits and attributes appeal most to your customers, and how best to package your product, experience or service.
New product, service or experience concept analysis surveys
Purpose: Concept test studies are appropriate in the initial screening of new product concepts . Likes and dislikes about the concept and evaluation of acceptability and likelihood of purchase are especially useful measures.
Concept optimization, demand estimation, and cost analysis surveys (conjoint analysis)
Purpose: Determines an optimal bundle of features and benefits, and estimates associated demand. This kind of survey develops market share estimates of market potential for the alternative potential products.
Habits and practices, or attitude and usage surveys
Purpose: Directed at understanding usage situations, including how, when, and where the product is used. Habits and practices studies sometimes include a real or virtual pantry audit. Attitude and usage studies are used to understand consumer attitudes towards the product category and to life in general. They also look at product and brand usage, including how, when and where the product is used.
Product satisfaction surveys (attribute, features, promised benefits)
Purpose: Evaluation of the product’s promised bundle of benefits (both tangible and image). Are expectations created for the product by advertising, packaging , and the product appearance fulfilled by the product?
Competitive benchmarking surveys
Purpose: A “best practices” study of “how does the market view us relative to the competition?” Competitive positioning analyses often compare the attributes and benefits that make up the product using multidimensional scaling. These analyses also include an evaluation of key competitors, looking at the same KPIs and attributes as product satisfaction surveys.
Sales forecasting and market tracking surveys
Purpose: Sales forecasting and market tracking studies can include expert opinion (experts estimate the market), judgmental bootstrapping (expert-based rules describing how to use available secondary market information), conjoint analysis (estimation of consumer intentions based on product attributes that are important in the decision), and intentions evaluations (consumer self-reported intentions of future purchases).
Price setting surveys and elasticity of demand analysis
Purpose: Price surveys estimate the elasticity of demand and show optimal price points, including prices too low or too high. Price surveys may estimate the demand for different product or service segments, or different usage situations.
4. Brand surveys
A survey can help you understand how consumers perceive your brand and what values and ideas they associate with it. You can explore what value your brand has and whether people would choose you over competitors in your market niche.
Brand equity analysis surveys
Purpose: What is the psychological value that a brand holds in the marketplace? Brand equity is a composite of brand awareness , brand quality, brand associations, and brand loyalty measures.
Advertising value identification and analysis surveys
Purpose: Advertising value analysis focuses on mapping the hierarchical attributes, benefits, and values that are associated with and portrayed by an advertisement. Means-end analysis is often part of this type of study.
Advertising message effectiveness surveys (media and message)
Purpose: Message effectiveness testing identifies the impressions, feelings, and effectiveness in moving the respondent to a desired goal (increased awareness, more product information, trial, repeat purchase).
Once you know the right type of survey to run, the next step is to write a survey that your respondents will love to take!
Survey methods can be used to help collect data on real business issues and help you answer questions. Qualtrics supports customer surveys on every channel, at every journey stage to get you answers for more informed decisions.
We’ve put together a range of survey example templates that you can use for free to help you get started:
- Employee satisfaction survey template
- Employee exit survey template
- Customer satisfaction (CSAT) survey template
- Ad testing survey template
- Brand awareness survey template
- Product pricing survey template
- Product research survey template
- Employee engagement survey template
- Customer service survey template
- NPS survey template
- Product package testing survey template
- Product features prioritization survey template
In addition, for large-scale research studies, Qualtrics offers market research services to help with everything from questionnaire design and survey methods, to implementation and analysis.
Related resources
Post event survey questions 10 min read, best survey software 16 min read, close-ended questions 7 min read, survey vs questionnaire 12 min read, response bias 13 min read, double barreled question 11 min read, likert scales 14 min read, request demo.
Ready to learn more about Qualtrics?

Using the right software for market research tracking studies
Blog: using the right software for market research tracking studies.
Market research tracking studies are a valuable source of revenue for many research agencies. However, most of the software used in market research struggles with the practicalities that face researchers and data analysts when analysing tracking data. This article looks at the problems most software has with handling tracking studies and, as importantly, looks at the importance of productivity and efficiency. Fortunately, MRDCL is one of the few products that manage trackers effectively, regardless of the data source . See why .
Tracking studies get easier and easier – right?
In theory, managing a tracking study should get easier and easier. Indeed, this is true in some ways. Staff working on a tracking study become more and more familiar with what it takes to handle it efficiently and to a client’s satisfaction. However, for data processors and data analysts, the task often gets increasingly complex. Any problems tend to compound over the life of a tracking study, and something that started as easy can become burdensome. Often, the software can be the root cause of problems associated with handling tracking studies.
The big problem: Questionnaires change
- There are new questions or new rating statements
- There is a need to remove some questions, permanently or temporarily
- The code lists change, e.g. when there are new brands, brands merge, brands disappear
- The data locations change
- Variable dependencies change (I’ll explain fully below)
Let’s look at each of these categories in more detail.
1. Tracking studies need new questions
Clients will almost always want to add a question or two (or more) to get feedback on new issues that arise. Most data analysis software platforms can handle this scenario fairly well. The main requirement is to filter results on the periods that the question appears on the questionnaire. When there are rating statements, it is particular likely that clients will want to change the questionnaire. If there are any regular changes, this can be cumbersome to implement.
2. There is a need to remove some questions, permanently or temporarily
In essence, this is the same issue as adding new questions. There is a need to filter results on the periods that a particular question appears on the questionnaire. Again, this can become time-consuming and prone to error if there are no tools for automation. While many software products may have tools to meet this need, editing filter definitions manually for every wave is not desirable.
3. The code lists change in tracking studies
4. The data locations change
When questionnaires change, the field where the software platform stores each question may change. The standard response by many software suppliers is that a database stores the data for each question by variable name, so it doesn’t matter. That is probably true if the whole project is collected and analysed in one product. If the data needs to be available on a wave by wave basis in another product, this is almost certainly a problem. The majority of data collection platforms, for example, will offer no control over how your data is output as a CSV file or as ASCII format. Or, if they do, it is another awkward task, which is prone to error.
5. Variable dependencies change
If you have a tracking project of just average complexity, you may want to build variables for analysis from the original questions. These variables are likely to be in terms of codes or sequential responses. If any of the scenarios above are true, these variables may need updating as well. This task can be highly time-consuming, complex and, again, prone to error. Please take a look at my anecdote below, where we were able to reduce variable dependencies from 20 person-days per month to just a few hours per month using MRDCL – and most of that time was carrying out checking final outputs.
Exporting data for other uses
If you need to export or transfer data for other purposes – such as dashboards, multivariate statistical analysis, client databases – the problems discussed above can become real time-consuming burdens for you. That’s why there is a big difference between software that can handle tracking studies and software that handles tracking studies well .
Latest Posts
An anecdote about tracking studies
A client was struggling with a project for several reasons. Firstly, the questionnaire changed every week. Secondly, the brands and their sub-brands changed most weeks. The pricing plans for each sub-brand changed quarterly on average. From time to time, sub-brands merged. Occasionally, brands merged. There was an average of 20 brands, consisting of almost 100 sub-brands and over 1000 price plans per year. The project was four years old when we helped our client transfer the project to MRDCL. After two months’ work extrapolating all the data, the number of days spent per month on the project reduced by over 90% from 20 days to just over one day. I doubt many software products could handle the complexity of the analysis and, certainly, not the complexity of the data itself. Further, the tables themselves were too complex for most other tabulation software products.
MRDCL and tracking studies
Finally, let’s look at why MRDCL is so good for tracking studies. Broadly, MRDCL can handle all the five problems I have cited efficiently, but there are five key points:
- MRDCL is a convenient way to document questionnaire changes to be more of a clerical task than a highly skilled programming task.
- You never need to recode data physically. Personally, I think recoding data is one of the most dangerous operations to carry out. Automation and templates are far less risky.
- MRDCL allows you to keep an audit trail of the history of a tracking study.
- You can apply variable dependencies automatically so that there is no manual updating of complex variables.
MRDCL: a summary
MRDCL may not be the only tool to manage tracking studies effectively. Indeed, simple customer feedback surveys of three or four questions rarely need the power of MRDCL. However, MRDCL can deal with unexpected issues that may arise during the life of a tracking study. The project described in the anecdote grew too big and almost impossible to manage within the original platform used. Fortunately, transferring the project to MRDCL allowed the client to retain the project for several more years.
If you want to know more or discuss your tracking study, please contact me.

Contact Details
Direct links, recent blog posts.
- Does your survey platform do everything you want? December 2, 2022
- Why MRDCL’s crosstab templates offer automation, power and simplicity October 20, 2022
- Using MRDCL with other software products September 3, 2022
- Using the right software for market research tracking studies July 20, 2022

Climate change damage could cost $38 trillion per year by 2050, study finds
- Medium Text

Make sense of the latest ESG trends affecting companies and governments with the Reuters Sustainable Switch newsletter. Sign up here.
Reporting by Riham Alkousaa, Editing by Rachel More, Katy Daigle and Barbara Lewis
Our Standards: The Thomson Reuters Trust Principles. New Tab , opens new tab

Thomson Reuters
Riham Alkousaa is the energy and climate change correspondent for Reuters in Germany, covering Europe’s biggest economy's green transition and Europe’s energy crisis. Alkousaa is a Columbia University Journalism School graduate and has 10 years of experience as a journalist covering Europe’s refugee crisis and the Syrian civil war for publications such Der Spiegel Magazine, USA Today and the Washington Times. Alkousaa was on two teams that won Reuters Journalist of the year awards in 2022 for her coverage of Europe’s energy crisis and the Ukraine war. She has also won the Foreign Press Association Award in 2017 in New York and the White House Correspondent Association Scholarship that year.
Business Chevron

Japan's factory activity declines slow, PMI shows
Japan's factory activity contracted but approached the break-even point in April, a business survey showed on Tuesday, suggesting the key sector is finally picking up after months of sluggishness.

Numbers, Facts and Trends Shaping Your World
Read our research on:
Full Topic List
Regions & Countries
- Publications
- Our Methods
- Short Reads
- Tools & Resources
Read Our Research On:
Religious restrictions around the world
For more than a decade, Pew Research Center has been tracking global patterns in restrictions on religion – both those imposed by governments and hostilities committed by individuals and social groups. Scroll down to explore restrictions in 198 countries and territories, and see how each country’s restrictions have changed since 2007.
For more details on restrictions on religion around the world, read our latest report on the topic, “Globally, Government Restrictions on Religion Reached Peak Levels in 2021, While Social Hostilities Went Down.”
Note: Government restrictions include laws, policies and actions by authorities that impinge on religious beliefs and practices, while social hostilities involving religion include actions by private individuals or groups in society that limit such practices.
1615 L St. NW, Suite 800 Washington, DC 20036 USA (+1) 202-419-4300 | Main (+1) 202-857-8562 | Fax (+1) 202-419-4372 | Media Inquiries
Research Topics
- Age & Generations
- Coronavirus (COVID-19)
- Economy & Work
- Family & Relationships
- Gender & LGBTQ
- Immigration & Migration
- International Affairs
- Internet & Technology
- Methodological Research
- News Habits & Media
- Non-U.S. Governments
- Other Topics
- Politics & Policy
- Race & Ethnicity
- Email Newsletters
ABOUT PEW RESEARCH CENTER Pew Research Center is a nonpartisan fact tank that informs the public about the issues, attitudes and trends shaping the world. It conducts public opinion polling, demographic research, media content analysis and other empirical social science research. Pew Research Center does not take policy positions. It is a subsidiary of The Pew Charitable Trusts .
Copyright 2024 Pew Research Center
Terms & Conditions
Privacy Policy
Cookie Settings
Reprints, Permissions & Use Policy

IMAGES
VIDEO
COMMENTS
Brand tracking market research offers flexibility and on-demand data, unlike more long-term market research studies. Benefit #6: Determine the success of marketing and sales campaigns 📣 A brand tracker survey can help answer a broad range of topics as well as specific business components such as marketing and advertising .
What Are Tracking Studies? In the broadest sense, tracking studies are longitudinal studies used in marketing research that survey a target population or audience at a specific time interval to measure changes in attitudes and behaviors. The questionnaire is rarely changed, and the time interval is kept consistent (i.e., weekly, monthly, etc ...
Tracking Studies help you to continuously monitor a research topic by repeatedly fielding the same questionnaire and comparing how your data points have changed over time. The topics you may want to track as a business typically range from changes in your target group (e.g. demographics, values, attitudes, media consumption), the perception of ...
Understand how to fine-tune the goals of the study. Create customized surveys to best meet the goals. Ensure the results are accurate and actionable. Create digestible reports. 💡 The Key Takeaway: Third-party market researchers know how to conduct customized, actionable, and successful tracking studies.
Market research is the process of gathering, analyzing and interpreting information about a specific market or industry. Here's how to do market research. ... This allows for the analysis of trends, changes and developments over time. Longitudinal studies are useful for tracking long-term developments in consumer preferences, brand loyalty ...
Tracking Research Services. For more information on Tracking Research, please contact Jerry W. Thomas, President/CEO, by emailing him at [email protected], or by calling 1-800-ANALYSIS (262-5974) or 1-817-640-6166. Decision Analyst designs and conducts tracking studies to help companies monitor their market performance over time.
Congratulations! You've run the first wave of your market research tracking study! Now, you repeat. When it's time to run the next occurrence (wave) of your tracker, you'll need to communicate with your external research team (at an agency) or set up the next wave of your tracker by toggling on a button (on an end-to-end research platform).
3. Tracking Marketing Efforts. Brand tracking studies differ based not only on the type of respondent but also on the objective and goal of the market research. In fact, my favorite type of brand tracking revolves around a company's marketing and advertising efforts. The marketing world moves at high speed.
A brand tracking study is a research method used to track the perception of a particular brand over time. This type of study can be used to assess how well a brand is performing, identify any changes in perception that need to be addressed, and determine what factors might be influencing the public's perception of the brand.
Step 3: Determine which research methods are most effective. Your choice of methods depends on budget, time constraints, and the type of question you're trying to answer. You could combine surveys, interviews and focus groups to get a mix of qualitative and quantitative data.
Interviews. Customer interviews are one of the most effective market research methods out there. It's a great way for business owners to get first-party data from their customers and get insights into how they are doing in real time. 7. Focus groups. Focus groups are a great way to get data on a specific demographic.
The idea is to track what changes in he market. In some markets continuous tackers conduct inerviews every day, week, or month. However, dip sticks, either regular or irregular, are the norm in many markets. Challenges. Tracking research involves solving challenges that we can put into three buckets: Data management; Analysis; Reporting . Data ...
A tracking study analyzes the changing views of a single group of consumers, making it an effective tool for market research. Tracking studies allow business owners to measure brand awareness ...
How to track an industry's market trends . Not long ago, market research agencies were the go-to source for tracking research. These traditional agencies, while capable of tracking trends over time, cost brands a lot of money, and can take weeks for one wave's results.
1. Market Research Report: Brand Analysis. Our first example shares the results of a brand study. To do so, a survey has been performed on a sample of 1333 people, information that we can see in detail on the left side of the board, summarizing the gender, age groups, and geolocation. **click to enlarge**.
Run concept tests, pricing studies, prototyping + more with fast, powerful studies designed by UX research experts. Brand. Track your brand performance 24/7 and act quickly to respond to opportunities and challenges in your market. XM Platform. Explore the platform powering Experience Management. Free Account Watch Demo SOLUTIONS. back; Teams ...
Tracking Research. InVeritas Research's tracking studies help clients to evaluate and improve their brand management, performance, profitability and potential opportunities to target new customer segment and grow brands. It also helps clients to gain insight of their brand, changes in the customer market such as increases or decreases in ...
Market research is a process of gathering, analyzing, and interpreting information about a given market. It takes into account geographic, demographic, and psychographic data about past, current, and potential customers, as well as competitive analysis to evaluate the viability of a product offer. In other words, it's the process of ...
Download HubSpot's free, editable market research report template here. 1. Five Forces Analysis Template. Use Porter's Five Forces Model to understand an industry by analyzing five different criteria and how high the power, threat, or rivalry in each area is — here are the five criteria: Competitive rivalry.
A market research study is a study that brands create to understand their target audience from a variety of angles (who they are, what they do, how they act, and other behaviors relevant to their business decisions). With a variety of market research study types available, the trick is knowing which type will deliver the right kind of information.
This information shows Market Awareness - Knowledge - Intention - Trial - Purchase - Repurchase of the product. 2. Customer experience surveys. This kind of survey helps you put yourself in the customer's shoes and look at your business from their perspective.
Market research tracking studies are a valuable source of revenue for many research agencies. However, most of the software used in market research struggles with the practicalities that face researchers and data analysts when analysing tracking data. This article looks at the problems most software has with handling tracking studies and, as ...
The United States Census Bureau designates Hispanic as an ethnicity, not a race. It is important that we understand how the people who respond to our survey compare with that of the U.S., as tracked by Census. In order to be able to do this, we have to ask our race and ethnicity questions the same way as the Census Bureau.
Follow these tips to gather key information as you develop and market a successful product. 1. Research products in high demand. If you don't have a product concept in mind yet, gain inspiration ...
Press Releases. GenAI Market Research: 80% of leaders concerned about data privacy and security. New generative AI market research by Coleman Parkes Research Ltd. and SAS, based on a recent survey of 300 US-based GenAI strategy and data analytics decision makers, sheds light on the four key areas of implementation that pose the greatest challenges.
SAS research reveals 93% of US businesses lack a comprehensive governance framework for GenAI. New generative AI market research by Coleman Parkes Research Ltd. and SAS, based on a recent survey of 300 US-based GenAI strategy and data analytics decision makers, sheds light on the four key areas of implementation that pose the greatest challenges.
Damage to farming, infrastructure, productivity, and health from climate change will cost an estimated $38 trillion per year by 2050, German government-backed research finds, a figure almost ...
In the second quarter of 2020, for instance, e-commerce sales totaled $205.3 billion, up 55% from the $132.3 billion recorded a year earlier. In the fourth quarter of 2020, e-commerce accounted for 16.7% of all retail sales, still the record-high share. That share fell back as stores reopened and consumers gradually resumed their old shopping ...
A Blend of Stability and Gradual Changes in the U.S. Rental Market (November 2023 Rental Market Report) Nicole Bachaud • Dec 07 2023.
March 5, 2024. For more than a decade, Pew Research Center has been tracking global patterns in restrictions on religion - both those imposed by governments and hostilities committed by individuals and social groups. Scroll down to explore restrictions in 198 countries and territories, and see how each country's restrictions have changed ...