Find Study Materials for
- Business Studies
- Combined Science
- Computer Science
- Engineering
- English Literature
- Environmental Science
- Human Geography
- Macroeconomics
- Microeconomics
- Social Studies
- Browse all subjects
- Read our Magazine

Create Study Materials
The Lake District National Park is located in Cumbria in Northwest England. It is renowned for its lakes, forests, mountains, glacial features, and famous figures such as Beatrix Potter. The park covers 912 sq. mi/2,362 km 2 and was named a UNESCO World Heritage Site in 2017. What glacial formations can be found in the Lake District? What are the impacts on the Lake District? How can it be managed? Let’s dive into our Lake District Case Study!

Explore our app and discover over 50 million learning materials for free.
- Lake District Case Study
- Explanations
- StudySmarter AI
- Textbook Solutions
- Challenges In The Human Environment
- Changing Economic World
- Coasts Geography
- Diverse Places
- Dynamic Landscapes
- Energy Security
- Climate Change Causes
- Cold Environments
- Depositional Landforms
- Erosional Landforms
- Glacial Depositional Landforms
- Glacial Environment
- Glacial Erosion
- Glacial Landforms
- Glacial Movement
- Glacial Processes
- Glacial System
- Glacier Mass Balance
- Periglacial Landscapes
- Periglacial Processes
- Pleistocene Climate Change
- Global Resource Management
- Globalisation
- Health And Human Rights
- Living With The Physical Environment
- Living World
- Migration and Identity
- Regenerating Places
- River Landscapes
- Superpowers of the World
- Sustainable Urban Development
- Water Cycle
Lerne mit deinen Freunden und bleibe auf dem richtigen Kurs mit deinen persönlichen Lernstatistiken
Nie wieder prokastinieren mit unseren Lernerinnerungen.
The Lake District National Park is located in Cumbria in Northwest England. It is renowned for its lakes, forests, mountains, glacial features, and famous figures such as Beatrix Potter. The park covers 912 sq. mi/2,362 km 2 and was named a UNESCO World Heritage Site in 2017. What glacial formations can be found in the Lake District? What are the impacts on the Lake District? How can it be managed? Let’s dive into our Lake District Case Study!
Lake District case study formations
The Lake District is a glaciated landscape made up of many distinctive glacial formations such as drumlins, corries, arêtes , glacial troughs, and lakes . Let’s take a closer look!
Glacial erosional formations
Helvellyn mountain, located in the Lake District, is one of England’s tallest mountains and is home to several erosional formations such as the Striding Edge arête . What is a glacial erosional landform?
A glacial erosional landform is a landform that has been created during glacial periods through the processes of abrasion and plucking. Examples of glacial erosional landforms include glacial troughs , corries , arêtes, and U-shaped valleys.
Helvellyn mountain, standing at 3,113 ft/949 m above sea level, was formed approximately 450 million years ago and is composed of igneous rock with many of the glacial features formed during the last glacial period over 20,000 years ago. Helvellyn mountain comprises Swirral Edge arête and Striding Edge arête, where the Red Tarn corrie or lake can be found. What is a corrie ?
A corrie or cirque is a steep-sided hollow created on the side of a mountain by a glacier. Often a corrie lake or tarn is formed once the ice has melted.

These glacial features were formed by rotational slip, plucking , and freeze-thaw weathering, which still affects the landscape today. Another formation found in the Lake District is ribbon lakes such as Ullswater. These lakes occupy deep glacial troughs or U-shaped valleys, with Lake Windermere named the largest ribbon lake in the Lake District.

Glacial depositional formations
The Lake District is also home to several glacial depositional landforms , including moraines and drumlins, which form when debris or sediment is left behind by a moving glacier. As a result of deposition, boulder clay has been deposited at the bottom of valleys as drumlins, with the majority located in Swindale. Ground moraines also cover the Lake District in areas such as Bannerdale and Haweswater, despite being mainly covered by vegetation. These moraines were formed during the Younger Dryas period, displaying the extent of the plateau ice fields during this period .
Younger Dryas is a period of extreme cold from around 12,900 to 11,700 BP (before present).

Lake District case study impacts
On average, 15.8 million tourists visit the Lake District each year, bringing in £1.48 million as of 2018. However, despite the benefits that tourism brings to the region, there are many negative impacts too. Let’s explore the impacts below!
Social impacts
Public transportation has improved significantly due to investment in tourism, with the Lake District also offering a beautiful, scenic place for locals and tourists alike to go walking and hiking.
However, about 90% of visitors who visit the Lake District come by car, which causes severe congestion and traffic problems, especially in the summer, with attractions such as the Bowness shopping centre also becoming extremely busy during this period. Another disadvantage is that tourists might not always support local businesses, as they might buy from big supermarkets on the way to the park rather than from local shops.
The housing prices have also increased as 20% of the properties in the Lake District are private or secondary homes. This has also reduced housing availability for the local people, with many of the holiday homes not occupied for most of the year. This forces local people to move out of the area to find affordable housing in the outskirts, such as Kendal.

Economic impacts
Tourism brings in around £1.48 million a year , with tourists visiting sites such as Hill Top, the family home of Beatrix Potter, beside Lake Windermere. This provides jobs for over half of the workforce in the Lake District as tour guides, water sports instructors, and in local shops and cafes. Money from tourism can also be invested in conservation and improving public transport. However, jobs in tourism are often seasonal and may not pay as well, with shops also perhaps catering more to tourists rather than locals.
Environmental impacts
The Lake District is a national park home to many animals, birds, insects, and plants. However, the Lake District is also threatened by many factors, such as increased littering from tourists. Pathway erosion also occurs due to the sheer volume of tourists walking along the paths in the Lake District and especially in the Cat Bells.
Fuel spillages result from ferries and power boating, causing water pollution and affecting local wildlife such as fish and birds. Lake Windermere also allows ferries, power boating, windsurfing, and water sports to occur, with the wash from these faster, damaging vehicles eroding the shore at an alarming rate. Air pollution and congestion cause damage to the environment due to the extreme volume of cars that drive to the Lake District, with vehicles often parked on grass verges also causing damage.

Lake District case study management
Several initiatives have been implemented to minimise damage caused by tourism. Read on to learn more about management in strategies in the area.
Traffic management
Effective road networks must be planned to manage traffic and congestion in the Lake District. This includes placing dual carriages and roads alongside the Lake District to manage traffic and reduce congestion in the town. Heavy lorries can be diverted away from the scenic routes, with traffic also slowed through measures such as cattle grids in the countryside and maximum speed limits.
Public transport
Bus lanes and Park and Ride operate in towns, limiting congestion and encouraging people to park on the outskirts and take a bus to the national parks instead. This will also help to improve air quality.
Management in tourist hotspots
Repairing and reinforcing paths will encourage people to stay on the routes and deter them from walking in protected areas. Roadsides and protected areas can be fenced off to prevent tourists from parking, and car parks can be reinforced to avoid damage and encourage people to park there.
Bins are also provided along walking routes for people to place their rubbish, reducing litter. Signs can also be placed alongside routes encouraging people not to dump their waste.
Housing management
Local authorities should build more affordable housing for local people within the area and perhaps limit holiday homes to provide for the local population.
Envrionmental management
Speed limits can be implemented for cars and boats to reduce environmental damage and pollution. Pedestrians are encouraged to keep to established routes, reducing environmental damage and erosion.
Lake District case study challenges
Despite these management strategies in place, there remain challenges within the Lake District, especially with tourists. For example, visitors can trample crops, leave gates open and disturb wildlife while out walking with dogs in particular, which puts them in conflict with farmers and park rangers. There is also conflict over the speed limit for boats, with many water sports, such as water skiing, relying on high speeds.
Tourists can also conflict with locals due to increased traffic congestion, noise, and air pollution. Mass tourism also results in the erosion of footpaths and littering in beauty hotspots, spoiling the landscape. Secondary homes and increased house prices also remain a significant issue in the Lake District, with local people pushed out to the outskirts.
Lake District case study conservation
Many conservation schemes are in place in the Lake District to protect the landscape and its wildlife. Through the National Trust and local wildlife charities, over 70 rangers look after the Lakes through path repairs, litter picking, and wildlife monitoring. Along with wildlife conservation, historic sites and the famous walls that define and shape the landscape must also be maintained and restored.
Management strategies such as encouraging tourists to stick to the paths and reducing traffic congestion through Park and Ride schemes also help to conserve the landscape and reduce noise and air pollution. The Armathwaite hall estate is also located in the Lake District wildlife park and is home to over 100 species, such as lemurs, zebras, goats, and donkeys.
Lake District Case Study - Key takeaways
- The Lake District comprises glacial erosional landforms such as corries and arêtes and depositional landforms such as drumlins and moraines.
- Positive impacts of tourism and the Lake District include improved public transportation, job opportunities for locals, and bringing in around £1.48 million a year by offering a beautiful location for locals and tourists to explore.
- Negative impacts to the Lake District include congestion, increased house prices, environmental damage, and footpath erosion.
- Management strategies include traffic management, encouraging public transport, increasing accessibility for housing, and repairing footway paths to reduce erosion. Over 70 rangers and volunteers have been conserving the park through litter picks and wall and path restorations.
- Challenges that still threaten the Lake District are conflicts between locals and tourists, such as increased traffic and wildlife disturbance by dogs. Housing availability remains to be a significant conflict.
- Fig. 1 - Helyvellyn mountain in the Lake District (https://commons.wikimedia.org/wiki/File:Helvellyn_Striding_Edge_360_Panorama,_Lake_District_-_June_09.jpg) by David Iliff (https://commons.wikimedia.org/wiki/User:Diliff) Licensed by CC BY-SA 3.0 (https://creativecommons.org/licenses/by-sa/3.0/deed.en)
- Fig. 2 - Lake Windermere (https://commons.wikimedia.org/wiki/File:Lake_windermere_in_2005.jpg) by Edward Taylor (https://commons.wikimedia.org/wiki/User:Jmstylr) Licensed by CC BY-SA 3.0 (https://creativecommons.org/licenses/by-sa/3.0/deed.en)
- Fig. 3 - Drumlins in Trusmadoor, Lake District (https://commons.wikimedia.org/wiki/File:Sheep_on_a_Drumlin_-_geograph.org.uk_-_818555.jpg) by Michael Graham (https://www.geograph.org.uk/profile/3141) Licensed by CC BY-SA 2.0 (https://creativecommons.org/licenses/by-sa/2.0/deed.en)
- Fig. 4 - Holiday home in Grisedale, Lake District (https://commons.wikimedia.org/wiki/File:Holiday_Cottage_Lake_District_-_geograph.org.uk_-_10553.jpg) by Paul Birrell (https://www.geograph.org.uk/profile/322) Licensed by CC BY-SA 2.0 (https://creativecommons.org/licenses/by-sa/2.0/deed.en)
- Fig. 5 - Motorboat on Lake Windermere (https://commons.wikimedia.org/wiki/File:Motor_Boat_on_Lake_Windermere_-_geograph.org.uk_-_2062234.jpg) by Peter Trimming (https://www.geograph.org.uk/profile/34298) Licenced by CC BY-SA 2.0 (https://creativecommons.org/licenses/by-sa/2.0/deed.en)
Frequently Asked Questions about Lake District Case Study
--> what challenges does the lake district face.
The Lake District's challenges include congestion, noise and air pollution, littering, footpath erosion, increased house prices, and conflicts between tourists and farmers, as crops and livestock can be disturbed.
--> How is the Lake District being managed?
The Lake District can be managed through planning effective road networks, maximum speed limits, encouraging tourists to use public transport such as Park and Ride, repairing footpaths and making housing affordable for local people.
--> What makes the Lake District a distinctive landscape?
The Lake District comprises multiple erosional and depositional glacial features such as glacial troughs, corries, arêtes, U-shaped valleys, drumlins, and ground moraines. Helvellyn mountain is a crucial example of Swirral edge arête and Striding edge arête.
--> How did glaciers shape the Lake District?
Through plucking, abrasion, freeze-thaw weathering and glacial deposition, the Lake District was shaped by glaciers during the Younger Dryas period. These processes are carved into the landscape forming ribbon lakes, arêtes and U-shaped valleys that make up the Lake District today.
--> What caused the Lake District?
The Lake District was caused by glaciers during the Younger Dryas period, a period of extreme cold from around 12,900 to 11,700 BP. This resulted in the glacial processes of abrasion, free-thaw weathering and deposition, forming the features that can still be seen today.
Test your knowledge with multiple choice flashcards
TRUE or FALSE: A landform that has been created during glacial periods through abrasion and plucking.
TRUE or FALSE: A corrie is formed when sediment is left behind by a glacier, creating a round-shaped hill
What are some glacial processes?
Your score:

Join the StudySmarter App and learn efficiently with millions of flashcards and more!
Learn with 13 lake district case study flashcards in the free studysmarter app.
Already have an account? Log in
TRUE or FALSE: A landform that has been created during glacial periods through abrasion and plucking.
TRUE or FALSE: A corrie is formed when sediment is left behind by a glacier, creating a round-shaped hill
What are some glacial processes ?
What are some social impacts of the Lake District?
Improvement of public transport
True or False: Tourism provides jobs for the locals as tour guides, water sports instructors, and local shops.
What are some environmental impacts at the Lake District?
Fuel spillages
- Geographical Skills
of the users don't pass the Lake District Case Study quiz! Will you pass the quiz?
How would you like to learn this content?
Free geography cheat sheet!
Everything you need to know on . A perfect summary so you can easily remember everything.
Join over 22 million students in learning with our StudySmarter App
The first learning app that truly has everything you need to ace your exams in one place
- Flashcards & Quizzes
- AI Study Assistant
- Study Planner
- Smart Note-Taking

Sign up to highlight and take notes. It’s 100% free.
This is still free to read, it's not a paywall.
You need to register to keep reading, create a free account to save this explanation..
Save explanations to your personalised space and access them anytime, anywhere!
By signing up, you agree to the Terms and Conditions and the Privacy Policy of StudySmarter.
Entdecke Lernmaterial in der StudySmarter-App
Privacy Overview
Case Study - Lake District
Tourism in glacial landscapes - lake district.
In 2017, 19.1 million tourists visited the Lake District (a Cumbrian National Park) each year. This high level of popularity has had the following impacts:

Economic impacts of tourism in the Lake District
- In 2017, tourists spent £1.4bn in the Lake District.
- In 2017, 19.1 million people visited the Lake District.
- In 2017, 18,565 jobs were created by tourism in the Lake District.
- Lots of people are buying holiday homes in towns like Ambleside in the Lake District. The property prices are so high that many locals are being forced away.
- Windermere Lake Cruises is a business that takes tourists around Lake Windermere.

Social impacts of tourism
- Almost 90% of tourists reach the Lake District by car. In peak tourist season (in the summer), traffic in and out of the Lake District is very bad.
- There is a train line running from London to Oxenholme and from Oxenholme to Windermere, however, the train can be expensive.
- Most local businesses in Ambleside cater to tourists for food, alcohol (pubs), and hiking equipment.
- As many as 55% of homes in the Lake District are rental homes (either holiday homes or rented out to tourists). 17.7% of houses in the Lake District are holiday homes up from 16% in 2013.
- Ambleside is only large enough to have a primary school, but not a secondary school.
- Gosforth is not large enough to have its own GP's surgery.

Environmental impacts of tourism
- Tourists often walk off paths, damaging farmland, disturbing sheep and harming grass verges.
- Catbells and Helvellyn are two popular tourist walks. Paths and routes can be so popular that there is erosion.
- Lake Windermere is a popular place for water sports and cruises, which creates noise pollution and disturbs local wildlife.
Coping With Tourism Impacts in the Lake District
Below are some strategies being used to help cope with the impacts of tourists in Lake District National Park in Cumbria:

Coping with footpath erosion
- The most eroded paths at Catbells and Helvellyn are covered with new earth and the surrounding area can be reseeded.

Coping with traffic
- In Ambleside, there are Controlled Parking Zones in the centre that only allow 1 hour of parking.
- In 2018 and 2019, there was controversy around 4x4 vehicles being allowed to cross green land carrying tourists.

Coping with high property prices
- The ratio of average income to house prices in the Lake District is 9.5:1.
- 17.7% of houses in the Lake District are holiday homes up from 16% in 2013.
- Housing Associations like the South Lakes Housing Association try to support affordable housing.

Coping with pollution from water sports
- Zoning schemes forbid some water sports from specific areas of lakes.
- Lake Windermere has a speed limit.
1 The Challenge of Natural Hazards
1.1 Natural Hazards
1.1.1 Types of Natural Hazards
1.1.2 Hazard Risk
1.1.3 Consequences of Natural Hazards
1.1.4 End of Topic Test - Natural Hazards
1.1.5 Exam-Style Questions - Natural Hazards
1.2 Tectonic Hazards
1.2.1 Tectonic Plates
1.2.2 Tectonic Plates & Convection Currents
1.2.3 Plate Margins
1.2.4 Volcanoes
1.2.5 Effects of Volcanoes
1.2.6 Responses to Volcanic Eruptions
1.2.7 Earthquakes
1.2.8 Earthquakes 2
1.2.9 Responses to Earthquakes
1.2.10 Case Studies: The L'Aquila & Kashmir Earthquakes
1.2.11 Earthquake Case Study: Chile 2010
1.2.12 Earthquake Case Study: Nepal 2015
1.2.13 Living with Tectonic Hazards 1
1.2.14 Living with Tectonic Hazards 2
1.2.15 End of Topic Test - Tectonic Hazards
1.2.16 Exam-Style Questions - Tectonic Hazards
1.2.17 Tectonic Hazards - Statistical Skills
1.3 Weather Hazards
1.3.1 Global Atmospheric Circulation
1.3.2 Surface Winds
1.3.3 UK Weather Hazards
1.3.4 Tropical Storms
1.3.5 Features of Tropical Storms
1.3.6 Impact of Tropical Storms 1
1.3.7 Impact of Tropical Storms 2
1.3.8 Tropical Storms Case Study: Katrina
1.3.9 Tropical Storms Case Study: Haiyan
1.3.10 UK Weather Hazards Case Study: Somerset 2014
1.3.11 End of Topic Test - Weather Hazards
1.3.12 Exam-Style Questions - Weather Hazards
1.3.13 Weather Hazards - Statistical Skills
1.4 Climate Change
1.4.1 Evidence for Climate Change
1.4.2 Causes of Climate Change
1.4.3 Effects of Climate Change
1.4.4 Managing Climate Change
1.4.5 End of Topic Test - Climate Change
1.4.6 Exam-Style Questions - Climate Change
1.4.7 Climate Change - Statistical Skills
2 The Living World
2.1 Ecosystems
2.1.1 Ecosystems
2.1.2 Ecosystem Cascades & Global Ecosystems
2.1.3 Ecosystem Case Study: Freshwater Ponds
2.2 Tropical Rainforests
2.2.1 Tropical Rainforests - Intro & Interdependence
2.2.2 Adaptations
2.2.3 Biodiversity of Tropical Rainforests
2.2.4 Deforestation
2.2.5 Case Study: Deforestation in the Amazon Rainforest
2.2.6 Sustainable Management of Rainforests
2.2.7 Case Study: Malaysian Rainforest
2.2.8 End of Topic Test - Tropical Rainforests
2.2.9 Exam-Style Questions - Tropical Rainforests
2.2.10 Deforestation - Statistical Skills
2.3 Hot Deserts
2.3.1 Overview of Hot Deserts
2.3.2 Biodiversity & Adaptation to Hot Deserts
2.3.3 Case Study: Sahara Desert
2.3.4 Desertification
2.3.5 Case Study: Thar Desert
2.3.6 End of Topic Test - Hot Deserts
2.3.7 Exam-Style Questions - Hot Deserts
2.4 Tundra & Polar Environments
2.4.1 Overview of Cold Environments
2.4.2 Adaptations in Cold Environments
2.4.3 Biodiversity in Cold Environments
2.4.4 Case Study: Alaska
2.4.5 Sustainable Management
2.4.6 Case Study: Svalbard
2.4.7 End of Topic Test - Tundra & Polar Environments
2.4.8 Exam-Style Questions - Cold Environments
3 Physical Landscapes in the UK
3.1 The UK Physical Landscape
3.1.1 The UK Physical Landscape
3.2 Coastal Landscapes in the UK
3.2.1 Types of Wave
3.2.2 Weathering & Mass Movement
3.2.3 Processes of Erosion & Wave-Cut Platforms
3.2.4 Headlands, Bays, Caves, Arches & Stacks
3.2.5 Transportation
3.2.6 Deposition
3.2.7 Spits, Bars & Sand Dunes
3.2.8 Case Study: Landforms on the Dorset Coast
3.2.9 Types of Coastal Management 1
3.2.10 Types of Coastal Management 2
3.2.11 Coastal Management Case Study - Holderness
3.2.12 Coastal Management Case Study: Swanage
3.2.13 Coastal Management Case Study - Lyme Regis
3.2.14 End of Topic Test - Coastal Landscapes in the UK
3.2.15 Exam-Style Questions - Coasts
3.3 River Landscapes in the UK
3.3.1 The River Valley
3.3.2 River Valley Case Study - River Tees
3.3.3 Erosion
3.3.4 Transportation & Deposition
3.3.5 Waterfalls, Gorges & Interlocking Spurs
3.3.6 Meanders & Oxbow Lakes
3.3.7 Floodplains & Levees
3.3.8 Estuaries
3.3.9 Case Study: The River Clyde
3.3.10 River Management
3.3.11 Hard & Soft Flood Defences
3.3.12 River Management Case Study - Boscastle
3.3.13 River Management Case Study - Banbury
3.3.14 End of Topic Test - River Landscapes in the UK
3.3.15 Exam-Style Questions - Rivers
3.4 Glacial Landscapes in the UK
3.4.1 Erosion
3.4.2 Landforms Caused by Erosion
3.4.3 Landforms Caused by Transportation & Deposition
3.4.4 Snowdonia
3.4.5 Land Use in Glaciated Areas
3.4.6 Tourism in Glacial Landscapes
3.4.7 Case Study - Lake District
3.4.8 End of Topic Test - Glacial Landscapes in the UK
3.4.9 Exam-Style Questions - Glacial Landscapes
4 Urban Issues & Challenges
4.1 Urban Issues & Challenges
4.1.1 Urbanisation
4.1.2 Urbanisation Case Study: Lagos
4.1.3 Urbanisation Case Study: Rio de Janeiro
4.1.4 UK Cities
4.1.5 Case Study: Urban Regen Projects - Manchester
4.1.6 Case Study: Urban Change in Liverpool
4.1.7 Case Study: Urban Change in Bristol
4.1.8 Sustainable Urban Life
4.1.9 End of Topic Test - Urban Issues & Challenges
4.1.10 Exam-Style Questions - Urban Issues & Challenges
4.1.11 Urban Issues -Statistical Skills
5 The Changing Economic World
5.1 The Changing Economic World
5.1.1 Measuring Development
5.1.2 Classifying Countries Based on Wealth
5.1.3 The Demographic Transition Model
5.1.4 Physical & Historical Causes of Uneven Development
5.1.5 Economic Causes of Uneven Development
5.1.6 How Can We Reduce the Global Development Gap?
5.1.7 Case Study: Tourism in Kenya
5.1.8 Case Study: Tourism in Jamaica
5.1.9 Case Study: Economic Development in India
5.1.10 Case Study: Aid & Development in India
5.1.11 Case Study: Economic Development in Nigeria
5.1.12 Case Study: Aid & Development in Nigeria
5.1.13 Economic Development in the UK
5.1.14 Economic Development UK: Industry & Rural
5.1.15 Economic Development UK: Transport & North-South
5.1.16 Economic Development UK: Regional & Global
5.1.17 End of Topic Test - The Changing Economic World
5.1.18 Exam-Style Questions - The Changing Economic World
5.1.19 Changing Economic World - Statistical Skills
6 The Challenge of Resource Management
6.1 Resource Management
6.1.1 Global Distribution of Resources
6.1.2 Food in the UK
6.1.3 Water in the UK 1
6.1.4 Water in the UK 2
6.1.5 Energy in the UK
6.1.6 Resource Management - Statistical Skills
6.2.1 Areas of Food Surplus & Food Deficit
6.2.2 Food Supply & Food Insecurity
6.2.3 Increasing Food Supply
6.2.4 Case Study: Thanet Earth
6.2.5 Creating a Sustainable Food Supply
6.2.6 Case Study: Agroforestry in Mali
6.2.7 End of Topic Test - Food
6.2.8 Exam-Style Questions - Food
6.2.9 Food - Statistical Skills
6.3.1 The Global Demand for Water
6.3.2 What Affects the Availability of Water?
6.3.3 Increasing Water Supplies
6.3.4 Case Study: Water Transfer in China
6.3.5 Sustainable Water Supply
6.3.6 Case Study: Kenya's Sand Dams
6.3.7 Case Study: Lesotho Highland Water Project
6.3.8 Case Study: Wakel River Basin Project
6.3.9 Exam-Style Questions - Water
6.3.10 Water - Statistical Skills
6.4.1 Global Demand for Energy
6.4.2 Factors Affecting Energy Supply
6.4.3 Increasing Energy Supply: Renewables
6.4.4 Increasing Energy Supply: Non-Renewables
6.4.5 Carbon Footprints & Energy Conservation
6.4.6 Case Study: Rice Husks in Bihar
6.4.7 Exam-Style Questions - Energy
6.4.8 Energy - Statistical Skills
Jump to other topics

Unlock your full potential with GoStudent tutoring
Affordable 1:1 tutoring from the comfort of your home
Tutors are matched to your specific learning needs
30+ school subjects covered
Tourism in Glacial Landscapes
End of Topic Test - Glacial Landscapes in the UK
AQA GCSE Geography
Lake District Case Study: Management Strategies
The Lake District is a major tourist attraction in the UK, visited by more than 16 million tourists every year. This is due to its natural beauty, lakes, hills and activities. These tourists bring many benefits as well as disadvantages to the area, as businesses attempt to capitalise on the naturally formed landscape.
Social Impacts
- The area’s improved public transport networks make it easier for both locals and tourists to explore the natural landscapes of the region.
- However, the high number of tourists can cause traffic jams and overcrowding at popular spots. This is a hassle for both visitors and locals.
- 20% of property in the Lake District is either second homes or holiday let properties. Some of these are owned by residents, who enjoy a healthy income from this. However, many others have problems with it and feel it impacts residents negatively.
- Many second homeowners and holiday cottage owners don’t live there all year, negatively impacting the community aspect of the area.
- Higher property values force locals to move out to areas such as Kendal or Penrith, which further deteriorates the community aspect of the Lake District.
Economic Impacts
- Tourism plays a vital role in the local economy, with 15,000 of the 41,000 people living in the Lake District working in the tourist trade. The trade brings approximately £1.1bn to the local economy.
- Holiday cottages and flats are not occupied all year round, which leads to a dip in population during off-peak seasons in the Lake District, such as winter. This leads to a serious loss of income for local businesses.
- The Lake District is becoming a popular area and property prices are increasing, with the average property value near Lake Windermere sitting at £519,013, an increase of 11% since 2019.
- Some jobs, such as those in activities, temporary retail and hospitality, are in less demand during the winter. This creates job insecurity and threatens individual income.
Environmental Impacts
- Approximately 90% of the 16m tourists that visit every year arrive by car and many of the roads are narrow so traffic jams can be common. This contributes to air pollution.
- Popular hills, such as Cat Bells (one of the easiest climbs), experience more hikers, which leads to quite serious erosion from footfall.
- The large volume of tourists can lead to increased littering, which harms local ecosystems.
- Water sports on Lake Windermere create excessive amounts of wash from powerboats and speed boats. The wash erodes the shore at a greater rate than normal.
Management Strategies
Local government works with the Lake District National Park and Cumbria Tourism to implement strategies to help combat some of the more negative aspects of tourism in the area.
Traffic Management
One of the key aims of recent transport initiatives is to get people out of their cars. This is to bring down traffic jams and reduce pollution.
The Lake District National Park promotes the use of trains to access the Lake District, which can be accessed on the West Coast mainline, connecting to London and Glasgow. The National Park also provides coaches and minibus tours within the Lake District that visit popular sites such as Hawkshead, Grizedale, and Tarn Hows. Meanwhile, hiking and cycling are promoted as a healthy and proactive way to visit the Lake District without harming the environment.
Additionally, strategies have been put in place to alleviate the pressure on small roads, which were not intended to cope with the high amount of traffic they receive. Dual carriageways such as the A591 have been constructed to move traffic in and out efficiently and quickly. Heavy goods vehicles take less popular and less touristy routes where possible, to avoid clogging up scenic routes and causing further traffic problems.
Sustainable Tourism Initiatives
In 2008 the ‘Low Carbon Lake District’ initiative was launched, working with businesses and communities to reduce emissions. The initiative works with the Zero Carbon Cumbria Partnership, with the aim of achieving zero carbon emissions in Cumbria by 2037. Businesses are supported in working in more sustainable ways to reduce emissions. The Lake District managed to reduce emissions by 25% within four years through the work of the initiative.
Bins are now featured more prominently by major attractions in the area. This, combined with a rollout of more anti-littering signs and education on the impact we have on our environment, has helped to reduce littering.
Speed limits for boats are enforced in most areas of the Lake District; for example, Lake Windermere implemented a 10 mph limit in 2005. This is to prevent the wash from eroding the banks of the lakes. However, the speed limit in most areas is now 10 knots (11.5mph).
Conservation and Protection
In 2001, Fix the Fells was created by a partnership of the National Trust, Natural England, Lake District National Park, Cumbria County Council and other important bodies. The organisation was created to secure funding to help repair and prevent damage from footfall on the hills. It relies on donations but also receives significant funding from individual and large corporate donors, including the National Lottery.
There are areas designated as protected areas within the Lake District. The government restricts development in areas of natural beauty or environmental significance, designated as Sites of Special Scientific Interest (SSSI). This is to safeguard fragile ecosystems and unique habitats.
The Lake District received international recognition as a UNESCO World Heritage Site in 2017. As a result, the Lake District National Park Partnership is under increasing pressure to ensure that the natural environment is sustained and protected from developers.
Footpaths are carefully maintained, not only for aesthetic reasons but also for safety and environmental conservation. Regular assessments ensure that the paths are safe for the high volume of visitors. This minimises the risk of accidents due to uneven surfaces, erosion or other hazards. Environmentally, well-maintained paths help to concentrate foot traffic in designated areas, reducing the spread of erosion and protecting surrounding vegetation and wildlife habitats.

Hi there! Want to study 2x more effectively?
Sign up now for exclusive access to interactive quizzes, audio lessons and more educational tools..
Sign me up!
- Revision Notes
- Unlimited Quizzes
- Audio Content
- Progress Tracking
- No Advertisements
Last updated: December 27, 2022
Please read these terms and conditions carefully before using our services.
Definitions
For these Terms and Conditions:
- Affiliate means an entity that controls, is controlled by or is under common control with a party, where “control” means ownership of 50% or more of the shares, equity interest or other securities entitled to vote for the election of directors or other managing authority.
- Account means a unique account created for you to access our services or some of our services.
- Country refers to the United Kingdom
- Company refers to Shalom Education Ltd, 86 London Road, (Kingsland Church), Colchester, Essex, CO3 9DW, and may be referred to as ‘we’, ‘us’, ‘our’, or ‘Shalom Education’ in this agreement.
- Device means any device that can access the Service, such as a computer, a mobile phone or a digital tablet.
- Feedback means feedback, innovations or suggestions sent by You regarding the attributes, performance or features of our service.
- Free Trial refers to a limited period of time that may be free when purchasing a subscription.
- Orders mean a request by you to purchase services from us.
- Promotions refer to contests, sweepstakes or other promotions offered by us through the website.
- Services refer to our website, resources and tutoring service.
- Subscriptions refer to the services or access to the service offered on a subscription basis by the company to you.
- Terms and Conditions (also referred to as “Terms”) mean these Terms and Conditions that form the entire agreement between you and Shalom Education Ltd regarding the use of the services we offer.
- Third-party Social Media Service means any services or content (including data, information, products or services) provided by a third party that may be displayed, included or made available on the website.
- Website refers to Shalom-education.com, accessible from https://www.shalom-education.com
- You means the individual accessing or using our services, or the company, or other legal entity on behalf of which such individual is accessing or using our services.
- Tutor refers to an individual who teaches a single pupil or a small group of students who have registered with Shalom Education Ltd.
- Tutee refers to a student or a pupil who has registered for tutoring with Shalom Education Ltd, which is administered through our tutoring platform.
Acknowledgement
Thank you for choosing Shalom Education Tuition for your educational needs. These terms and conditions outline the rules and regulations for the use of our services, and the agreement that will govern your relationship with us.
By accessing or using our services, you accept and agree to be bound by these terms and conditions, and our privacy policy , which describes our policies and procedures for the collection, use, and disclosure of your personal information when you use our website.
It is important that you read both documents carefully before using our services, as they outline your rights and obligations as a user of our services. If you do not agree to these terms and conditions or our privacy policy, please do not use our services. We hope you have a positive and educational experience with Shalom Education Tuition.
Signing up for Tutoring or Membership Accounts
By signing up for tutoring or membership accounts through the website, you confirm that you have the legal ability to enter into a binding contract.
Your information
When you place an order, we may ask you to provide certain information, such as your name, email, phone number, credit card details, and billing address.
You confirm that you have the right to use the payment method you choose, and that the information you provide is accurate and complete. By submitting your information, you give us permission to share it with payment processing third parties to complete your order.
Order cancellation
We reserve the right to cancel your order at any time for various reasons, including but not limited to:
- Unavailability of services (e.g. no tutors available)
- Errors in the description or prices of services
- Errors in your order
- Suspected fraud or illegal activity
Cancelling your order
Any services that you purchase can only be returned in accordance with these terms and conditions. Our Returns Policy forms a part of these Terms and Conditions.
In general, you have the right to cancel your order and receive a full refund within 14 days of placing it. However, you cannot cancel an order for services that are made to your specifications or are clearly personalised, or for services that you have already received in part.
Money-Back Guarantee: If you are not satisfied with the quality of your tutoring session, you may be eligible for a full or partial refund or credit. To request a refund or credit, please contact us within 24 hours after the end of the session and provide a detailed explanation of your dissatisfaction. We will review your request and, if approved, will issue a refund or credit to your account.
- Please note that refunds or credits may not be available for all types of tutoring services and may be subject to fees or other charges. For more information, please contact us.
Errors and inaccuracies
We strive to provide accurate and up-to-date information about the service we offer, but we cannot guarantee that everything will be completely accurate and up-to-date at all times. Prices, product images, descriptions, availability, and services may be inaccurate, incomplete, or out of date.
We reserve the right to change or update any information, and to correct errors, inaccuracies, or omissions at any time without prior notice.
Prices policy
We reserve the right to change our prices at any time before accepting your order.
All tutoring services and membership accounts purchased on our website must be paid for in full at the time of purchase, for the required time of use. We accept a variety of payment methods, including credit cards, debit cards, and online payment services like PayPal.
Your payment card may be subject to validation checks and authorisation by your card issuer. If we do not receive the necessary authorisation, we cannot be held responsible for any delays or failure to deliver your order.
Subscriptions
Subscription period.
Our tutoring services are available with a pay-as-you-go option or a subscription option that is billed on a monthly or annual basis. The tutoring account subscription will end at the end of the period. You can choose the subscription option that best suits your needs and cancel at any time.
Our membership accounts are billed monthly or annually and do not automatically renew after the period. You can choose to renew your membership account at the end of the period if you wish to continue your membership.
Subscription cancellations
You can cancel your subscription renewal through your account settings or by contacting us. Please note that you will not receive a refund for fees you have already paid for your current subscription period, and you will be able to access the service until the end of your current subscription period.
We need accurate and complete billing information from you, including your full name, address, postal code, telephone number, and valid payment method. If automatic billing fails, you will not receive tutoring services until a payment is made. If payment is not made within a reasonable time period, your account may be terminated.
Fee changes
We reserve the right to modify the subscription fees at any time. Any change in fees will take effect at the end of your current subscription period.
We will give you reasonable notice of any fee changes so you have the opportunity to cancel your subscription before the changes take effect. If you continue to use the service after the fee change, you agree to pay the modified amount.
In general, paid subscription fees are non-refundable. However, we may consider certain refund requests on a case-by-case basis and grant them at our discretion.
We may offer free trials of our subscriptions at our discretion. You may be asked to provide billing information to sign up for a free trial. If you do provide billing information, you will not be charged until the free trial period ends.
On the last day of the free trial, unless you have cancelled your subscription, you will be automatically charged the applicable subscription fees for the plan you have chosen. We reserve the right to modify or cancel free trial offers at any time without notice.
From time to time, we may offer promotions through the Service, such as discounts, special offers, or contests. These promotions may be governed by separate rules and regulations.
If you choose to participate in a promotion, please review the applicable rules and our privacy policy carefully. In the event of a conflict between the promotion rules and these terms and conditions, the promotion rules will take precedence.
Please note that any promotion may be modified or discontinued at any time, and we reserve the right to disqualify any participant who violates the rules or engages in fraudulent or dishonest behaviour. By participating in a promotion, you agree to be bound by the applicable rules and our decisions, which are final and binding in all matters related to the promotion.
User Accounts
In order to access certain features of our services, you may be required to create an account. When you create an account, you agree to provide accurate, complete, and current information about yourself as prompted by the account registration process. If you provide any false, inaccurate, outdated, or incomplete information, or if we have reasonable grounds to suspect that you have done so, we reserve the right to suspend or terminate your account.
You are solely responsible for maintaining the confidentiality of your account and password, and you agree to accept responsibility for all activities that occur under your account. If you believe that your account has been compromised or that there has been any unauthorised access to it, you must notify us immediately.
You may not use a username that is already in use by another user, that belongs to another person or entity without appropriate authorisation, or that is offensive, vulgar, or obscene. We reserve the right to remove or reclaim any username that we determine, in our sole discretion, to be inappropriate, infringing, or otherwise in violation of these terms and conditions.
Tutor Agreements
As a tutor working with Shalom Education, you agree to the following terms and conditions:
Tutor relationships
- You are at least eighteen years of age and have the necessary qualifications and/or experience to provide tuition in the subjects specified on your CV.
- You will not make any agreements with a tutee, any member of the tutee’s family, or the tutee’s guardian that are intended to circumvent the relationship between our service and the tutee and to benefit you at our expense. This includes the exchange of private information (e.g. phone numbers, emails or social media accounts etc).
- You will not, during the period of any tutoring session with a tutee and for a period of six months from the conclusion of the last tutoring session, give any tuition services to that tutee.
- You will use our platform as your only means of communication with tutees, and any other methods are strictly prohibited.
- You will not be abusive towards a tutee or their nominee on our website or any other place.
- You are expected to maintain a professional and respectful relationship with tutees at all times.
- You will not engage in any inappropriate or illegal behaviour while working with tutees, including but not limited to harassment or discrimination.
- You are expected to follow all applicable laws and regulations while providing tutoring services.
Tutor responsibilities
- You will not complete any coursework, essays, or other assignments on behalf of the tutee. However, you can offer support.
- You will be punctual and communicate with us if you are running late or need to reschedule a lesson.
- You are expected to provide high-quality tutoring services to tutees, including preparing appropriate lesson plans.
- You will be responsible for ensuring that you have the necessary resources and equipment to provide effective tutoring services, such as a reliable internet connection and computer if tutoring online.
- You will be expected to keep confidential any personal or sensitive information that you may learn about a tutee while working with them.
Tutor compensation
- You will not request or accept any payments from a tutee, or their nominee.
- The company reserves the right to withhold payment to tutors if it believes lessons are being booked outside our platform.
- The company will pay you a fee for your tutoring services according to the rates agreed between you and the company.
- The company will be responsible for collecting payment from the tutee.
- If you are self-employed, we expect you to provide us with your UTR number and you are expected to pay your own tax to HMRC
Tutor termination
- As a tutor working with the company, you may terminate your relationship with a tutee at any time by providing reasonable notice.
- The company may also terminate your relationship with a tutee at any time, for any reason, such as if the tutee is no longer in need of tutoring services or if the tutee expresses dissatisfaction with your services.
- The company may terminate your use of its service if you breach any of the terms and conditions outlined in this agreement.
- The company may also terminate your use of its service if it determines that you are no longer fit to provide tutoring services or if it receives multiple complaints about your performance.
Tutee Agreements
As a tutee using our service, you agree to the following terms and conditions:
- If you are under 18 years of age, you must have consent from a parent or guardian to register and that parent/guardian must enter into an agreement with Shalom Education to provide tuition services.
- You must contact a tutor through the Shalom Education tutoring platform. Any other means of communication is prohibited.
- You agree not to publish any abusive comments about a tutor or another tutee on the Shalom Education website or any other place. This includes defamatory or derogatory comments.
- You must not request a tutor to complete your coursework, essays, or other assignments given to you in your various schools but can request for support towards that.
- You agree not to make any agreement or arrangement with a tutor which is intended to circumvent the relationship between Shalom Education and the Tutor.
Expectations
- Lessons will be held at the frequency and duration agreed upon with us.
- Shalom Education will provide any necessary materials or resources for the lessons.
- You are expected to be punctual for lessons and to provide adequate notice for cancellations or rescheduling.
- You are expected to provide any necessary materials or resources for the lessons (e.g. pens, pencils or a protractor).
Responsibilities
- If you cancel a lesson less than 12 hours before the lesson is due to commence, you may be charged a cancellation fee of 50% of the lesson fee. If you cancel a lesson less than 2 hours before the scheduled start time of a lesson, you will be charged the full lesson fee.
Dispute Resolution
- If you have any concerns or issues with your tutoring experience, please contact us at [email protected] as soon as possible. We will work with you and your tutor to try to resolve any disputes or issues in a fair and reasonable manner.
Termination
- You may terminate your lessons with a tutor at any time by providing reasonable notice, as specified in your contract with us.
By using our service, you acknowledge that you have read and understand this agreement and agree to be bound by its terms. If you have any questions or concerns, please do not hesitate to contact us.
Copyright Policy
We respect the intellectual property rights of others and expect our users to do the same. It is our policy to respond to any claim that content posted on our service infringes the copyright or other intellectual property rights of any person.
If you are a copyright owner or authorised on behalf of one and you believe that your copyrighted work has been copied in a way that constitutes copyright infringement, please provide our copyright agent with the following information:
- An electronic or physical signature of the person authorised to act on behalf of the owner of the copyright’s interests.
- A description of the copyrighted work that you claim has been infringed, including the URL (web page address) of the location where the copyrighted work exists or a copy of the copyrighted work.
- Identification of the URL or other specific location on our service where the material that you claim is infringing is located.
- Your address, telephone number, and email address.
- A statement by you that you have a good faith belief that the disputed use is not authorized by the copyright owner, its agent, or the law.
- A statement by you, made under penalty of perjury, that the information in your notice is accurate and that you are the copyright owner or are authorised to act on the copyright owner’s behalf.
You may be held accountable for damages (including costs and attorneys’ fees) for misrepresenting that any content is infringing your copyright.
Upon receipt of a notification, we will take whatever action, in our sole discretion, we deem appropriate, including removal of the challenged content from our service. If you believe that your content has been removed in error, please contact us at [email protected] .
Intellectual Property
The original content on our services (excluding content provided by you or other users), features, and functionality are and will remain the exclusive property of Shalom Education Ltd and its licensors. This includes, but is not limited to, text, graphics, images, logos, software, and other materials on our website and any proprietary technology used in the operation of our services.
Our service is protected by copyright, trademark, and other laws of both the United Kingdom and foreign countries. Our trademarks and trade dress may not be used in connection with any product or service without the prior written consent of Shalom Education Ltd. All other trademarks not owned by Shalom Education Ltd that appear on our service are the property of their respective owners.
By using our service, you acknowledge and agree that any intellectual property rights, including copyrights, trademarks, patents, and trade secrets, in the content and materials provided by Shalom Education Ltd or accessed through our service are the sole property of Shalom Education Ltd or the respective owners of such rights. You agree not to use, reproduce, modify, distribute, or create derivative works of such content and materials without the express written permission of Shalom Education Ltd or the respective owners of such rights.
You are responsible for protecting your own intellectual property rights and for obtaining any necessary licenses or permissions from the owners of any third-party intellectual property that you may use in connection with your use of our service. Shalom Education Ltd will not be liable for any claims or damages arising from your use of intellectual property that infringes the rights of others.
If you believe that your intellectual property rights have been violated on our service, please contact us at [email protected] .
Your Feedback to Us
By submitting any feedback or suggestions to the company, you agree to assign to the company all rights, titles, and interests in such feedback or suggestions. If for any reason such assignment is ineffective, you agree to grant the company a non-exclusive, perpetual, irrevocable, royalty-free, worldwide right and license to use, reproduce, disclose, sublicense, distribute, modify, and exploit such feedback or suggestions without restriction.
You acknowledge that the company may use your feedback or suggestions for any purpose, including to improve the company’s products or services, and that the company is under no obligation to compensate you for your feedback or suggestions.
Links to Other Websites
Our Service may contain links to third-party websites or services that are not owned or controlled by Shalom Education Ltd. These links are provided for your convenience only and do not imply endorsement by our business of the linked website or service. We have no control over and assume no responsibility for the content, privacy policies, or practices of any third-party websites or services.
By using our Service, you acknowledge and agree that the use of any third-party websites or services is at your own risk. Shalom Education Ltd does not endorse or guarantee the accuracy or reliability of any content or materials on third-party websites or services, and we are not responsible for any errors or omissions.
In no event will Shalom Education Ltd be liable for any damage or loss caused or alleged to be caused by or in connection with the use of or reliance on any content, goods, or services available on or through any third-party websites or services. This limitation of liability applies to all claims.
We recommend that you carefully read the terms and conditions and privacy policies of any third-party websites or services that you visit, as they may differ from the terms and policies of our own services. If you have any concerns or questions about a third-party website or service linked from our service, we encourage you to contact the site or service directly for more information.
Shalom Education Ltd reserves the right to terminate or suspend your account at any time, without prior notice or liability, for any reason whatsoever, including but not limited to breach of these terms and conditions, fraudulent or illegal activity, or any other conduct that we deem inappropriate or harmful to our business or other users.
Upon termination, your right to use our services will immediately cease, and any outstanding balances or fees owed to Shalom Education Ltd must be paid in full. If you wish to terminate your account, you may simply stop using our services and contact us to request the closure of your account.
Any personal information or user-generated content associated with your account will be retained in accordance with our privacy policy, unless otherwise required by law.
You acknowledge and agree that Shalom Education Ltd will not be liable to you or any third party for any termination of your access to our services. You further agree that any rights or obligations that survive the termination of your account, such as indemnification or confidentiality obligations, will remain in effect.
“AS IS” and “AS AVAILABLE” Disclaimer
The service is provided to you “As is” and “As available” and with all faults and defects without warranty of any kind. While we make every effort to ensure the accuracy and reliability of our services, we cannot guarantee that they will be error-free or uninterrupted.
To the maximum extent permitted by applicable law, our business and its affiliates and licensors and service providers disclaim all warranties, expressed or implied, including but not limited to warranties of merchantability, fitness for a particular purpose, title and non-infringement. We do not make any representations or warranties that our services will meet your requirements, achieve any intended results, be compatible with any other software or services, operate without interruption, or be error-free.
We do not guarantee the accuracy, completeness, reliability, or timeliness of the information, content, or materials provided through our services.
We do not guarantee that our services or any content or materials provided through our services will be free from viruses, malware, or other harmful components. It is your responsibility to protect your device and system from such threats, and we recommend that you use appropriate security measures and virus protection software.
Some jurisdictions do not allow the exclusion of certain types of warranties or limitations on the applicable statutory rights of a consumer, so some or all of the above exclusions and limitations may not apply to you. In such cases, the exclusions and limitations set forth in this section shall be applied to the greatest extent enforceable under applicable law.
By using our services, you acknowledge and agree that your use is at your own risk, and that you are solely responsible for any damage or loss that may result from your use of our services.
Governing Law and Jurisdiction
These terms and your use of the service shall be governed by and construed in accordance with the laws of the country, excluding its conflicts of law rules. Any disputes arising out of or in connection with these terms or the use of the service shall be resolved through the courts of the country and you hereby consent to the exclusive jurisdiction of such courts.
Disputes Resolution
If you have any concerns or disputes related to the service, you agree to try to resolve the issue informally by contacting us first.
You can try contacting the company through email ([email protected]) or by phone (01206657616) to see if we can come to an agreement or find a solution to your issue. This can be a quick and effective way to address any concerns or issues you may have, without the need for formal legal proceedings.
We will make every effort to address your concerns and reach a mutually satisfactory resolution. If we are unable to resolve the dispute informally, you may choose to bring the matter to alternative dispute resolution through a mediator or arbitrator. Any such alternative dispute resolution proceedings will be conducted in accordance with the laws of the country and will be confidential. You agree that any such dispute will be resolved on an individual basis and that class or collective actions are not permitted.
Severability and Waiver
Severability.
If any provision of these terms and conditions is found to be invalid or unenforceable, that provision will be enforced to the maximum extent possible, and the remaining provisions will remain in full force and effect.
The failure to exercise a right or to require the performance of an obligation under these terms and conditions shall not affect a party’s ability to exercise such right or require such performance at any time in the future. Similarly, the waiver of a breach of these terms and conditions shall not constitute a waiver of any subsequent breach.
Changes to These Terms and Conditions
We may update or change these terms and conditions at any time, at our sole discretion. If we make a material change to these terms, we will provide reasonable notice, such as by posting a notification on our website or through email, at least 30 days before the change takes effect. It is your responsibility to regularly check these terms and conditions for any updates or changes.
By continuing to access or use our Service after any updates or changes to these terms, you agree to be bound by the revised terms. If you do not agree to the updated or changed terms, in whole or in part, please stop using the website and our services.
If you have any questions about these terms and conditions, You can contact us:
- By email: [email protected]
- By visiting this page on our website: https://www.shalom-education.com/contact-us
- By phone number: 01206657616
- Tutor refers to an individual that teaches a single pupil or a small group of students which have registered with Shalom Education Ltd.
- Tutee refers to a student or a pupil that has registered for tutoring with Shalom Education Ltd, which is administered through our tutoring platform.
When you place an order, we may ask you to provide certain information, such as your name, email, phone number, credit card details and billing address.
Username or Email Address
Remember Me
Registration confirmation will be emailed to you.
Lake District
- First Online: 11 May 2020
Cite this chapter

- David J. A. Evans 4
Part of the book series: World Geomorphological Landscapes ((WGLC))
1321 Accesses
The English Lake District is renowned for its glacial erosional landforms that exploited a radial drainage pattern developed on a pre-Neogene tectonically updomed bedrock surface. Accordant summit surfaces have been ascribed to peneplanation , but little is known about longer timescale landscape evolution. Repeated Quaternary glaciation has given rise to a landscape signature indicative of ice sheet inundation, such as the lake-filled overdeepened and U-shaped valleys, as well as the products of more restricted mountain icefields that give rise to an erosional signature representative of average glacial conditions, such as the 158 cirques of the region. Depositional evidence for older glaciations is patchy and occurs only in stratigraphic sequences on the west Cumbrian coastal lowlands and below the MIS 5e Troutbeck Palaeosol near Threlkeld. Although complex depositional sequences record former ice sheet incursion and ice-dammed lake formation during the LGM on the Cumbrian coastal lowlands and western valley mouths of Wasdale and Ennerdale, the most prominent glacial landforms date to the Younger Dryas . Debates have centred on the style of glacierization at this time, with the notion of an “alpine style” of restricted valley head and cirque glaciers being replaced more recently with one of plateau icefields and some satellite cirque glaciers. Non-glacial features include rock slope failures , hillslope deposits and fluvial systems, the activity of which is thought to have been more important during the early stages of the paraglacial cycle, with activity and sediment yields diminishing over time as glacigenic sediment stores become exhausted. Ongoing adjustments of the deglaciated slopes and valley fills are part of what is known as “rejuvenated” and “renewed” paraglacial responses, relating to the crossing of geomorphic stability thresholds in the remaining stored sediments triggered by climate change, extreme meteorological events, neotectonics, or anthropogenic (e.g. agricultural) activity. Ongoing cold climate processes are also manifest in high altitude periglacial features, such as patterned ground , and contribute along with rock mass failure to the accumulation of scree slopes.
- Radial drainage pattern
- Glacial erosion
- Average glacierization style
- Younger Dryas
- Glacial landforms
- Rock slope failure
- Paraglacial landforms
This is a preview of subscription content, log in via an institution to check access.
Access this chapter
- Available as PDF
- Read on any device
- Instant download
- Own it forever
- Available as EPUB and PDF
- Compact, lightweight edition
- Dispatched in 3 to 5 business days
- Free shipping worldwide - see info
- Durable hardcover edition
Tax calculation will be finalised at checkout
Purchases are for personal use only
Institutional subscriptions
Akhurst MC, Chadwick RA, Holliday DW, McCormack M, McMillan AA, Millward D, Young B (1997) The geology of the west cumbria district. Memoir of the British Geological Survey, Sheets 28, 37 and 47
Google Scholar
Ballantyne CK (2002a) A general model of paraglacial landscape response. Holocene 12:371–376
Article Google Scholar
Ballantyne CK (2002b) Paraglacial geomorphology. Quat Sci Rev 21:1935–2017
Ballantyne CK (2003) Paraglacial landsystems. In: Evans DJA (ed) Glacial landsystems. Arnold, London, pp 432–461
Ballantyne CK (2013) Trimlines and palaeonunataks. In: Elias SA, Mock C (eds) Encyclopedia of Quaternary science, vol 1. Elsevier, Amsterdam, pp 918–929
Ballantyne CK, Benn DI (1996) Paraglacial slope adjustment during recent deglaciation and its implications for slope evolution in formerly glaciated environments. In: Anderson MG, Brooks S (eds) Advances in hillslope processes, vol 2. Wiley, Chichester, pp 1173–1195
Ballantyne CK, Wilson P, Gheorghiu D, Rodés À (2013) Enhanced rock-slope failure following ice sheet deglaciation: timing and causes. Earth Surf Process Landf 39:900–913
Bedford A, Jones RT, Lang B, Brooks S, Marshall JD (2004) A Late-glacial chironomid record from Hawes Water, northwest England. J Quat Sci 19:281–290
Belbin S (1985) Long-term landform development in North-west England: the application of the planation concept. In: Johnson RH (ed) The geomorphology of North-west England. Manchester University Press, Manchester, pp 37–58
Bickerdike HL, Evans DJA, Ó Cofaigh C, Stokes CR (2016) The glacial geomorphology of the Loch Lomond Stadial in Britain: a map and geographic information system resource of published evidence. J Maps 12:1178–1186
Bickerdike HL, Ó Cofaigh C, Evans DJA, Stokes CR (2018a) Glacial landsystems, retreat dynamics and controls on Loch Lomond Stadial (Younger Dryas) glaciation in Britain. Boreas 47:202–224
Bickerdike HL, Evans DJA, Stokes CR, Ó Cofaigh C (2018b) The glacial geomorphology of the Loch Lomond (Younger Dryas) Stadial in Britain: a review. J Quat Sci 33:1–54
Boardman J (1980) Evidence for pre-Devensian glaciation in the northeastern Lake District. Nature 286:599–600
Boardman J (1982) Glacial geomorphology of the Keswick area, northern Cumbria. Proc Cumberl Geol Soc 4:115–134
Boardman J (1985) The Troutbeck palaeosol, Cumbria, England. In: Boardman J (ed) Soils and Quaternary landscape evolution. Wiley, Chichester, pp 231–260
Boardman J (1991) Glacial deposits of the English Lake District. In: Ehlers J, Gibbard PL, Rose J (eds) Glacial deposits in Great Britain and Ireland. Balkema, Rotterdam, pp 175–183
Boardman J (1996) Classic landforms of the Lake District. Geographical Association, Sheffield, p 52
Boardman J (1997) The terraces of Mosedale Beck—a review. In: Boardman J (ed) Geomorphology of the Lake District: a field guide. BGRG, Oxford, pp 7–9
Brook MS, Tippett JM (2002) The influence of rock mass strength on the form and evolution of deglaciated valley slopes in the English Lake District. Scott J Geol 38:15–20
Brown VH, Evans DJA, Evans IS (2011) The glacial geomorphology and surficial geology of the south-west English Lake District. J Maps 2011:221–243
Brown VH, Evans DJA, Vieli A, Evans IS (2013) The Younger Dryas in the English Lake District: reconciling geomorphological evidence with numerical model outputs. Boreas 42:1022–1042
Caine TN (1963) The origin of sorted stripes in the Lake District, northern England. Geogr Ann 65A:172–179
Caine TN (1972) The distribution of sorted patterned ground in the English Lake District. Rev Geomorphol Dyn 21:49–56
Carling P (1997) Sedimentology of the 1749 flood deposit. In: Boardman J (ed) Geomorphology of the Lake District: a field guide. BGRG, Oxford, pp 23–29
Chiverrell RC, Smedley RK, Small D, Ballantyne CK, Burke MJ, Callard SL, Clark CD, Duller GAT, Evans DJA, Fabel D, van Landeghem K, Livingstone S, Ó Cofaigh C, Thomas GSP, Roberts DH, Saher M, Scourse JD, Wilson P (2018) Ice margin oscillations during deglaciation of the northern irish sea basin. J Quat Sci 33:739–762
Clark CD, Ely JC, Greenwood SL, Hughes ALC, Meehan R, Barr ID, Bateman MD, Bradwell T, Doole J, Evans DJA, Jordan CJ, Monteys X, Pellicer XM, Sheehy M (2018) BRITICE Glacial Map, version 2: a map and GIS database of glacial landforms of the last British–Irish Ice Sheet. Boreas 47:11–27
Clark R (1992) Quaternary features north of the Kirkstone Pass. In: Dodd M (ed) Lakeland rocks and landscape: a field guide. Cumberland Geological Society, Maryport, pp 88–94
Clark R (1988) Pattern and order in the Lake District landscape. Proc Cumberl Geol Soc 5:17–34
Clark R, Wilson P (1994) Valley moraines in Borrowdale. In: Boardman J, Walden J (eds) Cumbria—field guide. Quaternary Research Association, Oxford, pp 153–156
Clark R, Wilson P (2001) Origin of some slope-foot debris accumulations in the Skiddaw upland, northern Lake District. Proc Yorks Geol Soc 53:303–310
Clark R, Wilson P (2004) A rock avalanche deposit in Burtness Comb, Lake District, northwest England. Geol J 39:419–430
Clark R, Parker AG, Anderson DE, Wilson P (2007) Late Holocene debris cone development and vegetation and land use history in the Pasture Beck valley, Lake District, NW England. Proc Yorks Geol Soc 56:235–243
Curry AM, Ballantyne CK (1999) Paraglacial modification of glacigenic sediments. Geogr Ann 81A:409–419
Davies T, Warburton J, Dunning S, Bubeck A (2013) A large landslide event in a post-glacial landscape: rethinking glacial legacy. Earth Surf Process Landf 38:1261–1268
De Rance CE (1871) On the two glaciations of the lake district. Geol Mag 8:107–117
Dixon EEL (1922) The retreat of the Lake District ice cap in the Ennerdale area, west Cumberland. Summ Prog Geol Surv Great Br Mus Pract Geol 1921:118–125
Dunning SA, Warburton J, Davies TR, Pound M (2015) The Clough Head landslide deposit. In: McDougall DA, Evans DJA (eds) The Quaternary of the Lake District—field guide. Quaternary Research Association, London, pp 137–152
Dykes AP, Bromhead EN, Ibsen M-L (2010) Fault-controlled bedrock landslides in England’s Lake District. In: Malet J-P, Glade T, Casagli N (eds) Mountain risks: bringing science to society. CERG Editions, Strasbourg, pp 37–42
Eastwood T, Dixon EEL, Hollingworth SE, Smith B (1931) The geology of the Whitehaven and Workington district. HMSO, London
Evans DJA, Brown VH, Roberts DH, Innes JB, Bickerdike HL, Vieli A, Wilson P (2015) Wasdale Head. In: McDougall DA, Evans DJA (eds) The Quaternary of the Lake District—field guide. Quaternary Research Association, London, pp 213–238
Evans DJA, Livingstone SJ, Vieli A, Ó Cofaigh C (2009) The palaeoglaciology of the central sector of the British and Irish Ice Sheet: reconciling glacial geomorphology and preliminary ice sheet modelling. Quat Sci Rev 28:739–757
Evans IS (2003) Lakeland cirques, tarns and glaciation. In: Haworth E, de Boer G, Evans IS, Osmaston H, Pennington W, Smith A, Storey P, Ware B (eds) Tarns of the Central Lake District. Brathay, Ambleside, pp 9–19
Evans IS (2015) The Lake District cirque inventory. In: McDougall DA, Evans DJA (eds) The Quaternary of the Lake District—field guide. Quaternary Research Association, London, pp 65–82
Evans IS, Cox NJ (1995) The form of glacial cirques in the English Lake District, Cumbria. Z Geomorphol 39:175–202
Fitzharris BB, Owens IF (1984) Avalanche Tarns. J Glaciol 30:308–312
Gresswell RK (1952) The glacial geomorphology of the southern part of the Lake District. Liverp Manch Geol J 1:57–70
Haworth E, de Boer G, Evans IS, Osmaston H, Pennington W, Smith A, Storey P, Ware B (eds) (2003) Tarns ofthe Central Lake District. Brathay, Ambleside
Hay T (1926) Delta formation in the English Lakes. Geol Mag 63:292–301
Hay T (1928) The shore topography of the English Lakes. Geogr J 72:38–57
Hay T (1936) Stone stripes. Geogr J 87:47–50
Hay T (1942) Physiographical notes from Lakeland. Geogr J 100:165–173
Hay T (1944) Rosthwaite moraines and other Lakeland notes. Geogr J 103:119–124
Hollingworth SE (1931) Glaciation of western Edenside and adjoining areas and the drumlins of the Edenside and Solway Basin. Q J Geol Soc Lond 87:281–359
Hollingworth SE (1934) Some solifluction phenomena in the northern part of the Lake District. Proc Geol Assoc 45:167–188
Hollingworth SE (1936) High level erosional platforms in cumberland and furness. Proceedings of the yorkshire geological society 23:159–177
Hollingworth SE (1951) The influence of glaciation on the topography of the Lake District. J Inst Water Eng 5:485–496
Hubbard A, Bradwell T, Golledge N, Hall A, Patton H, Sugden D, Cooper R, Stoker M (2009) Dynamic cycles, ice-streams and their impact on the extent, chronology and deglaciation of the British–Irish Ice Sheet. Quat Sci Rev 28:758–776
Huddart D (1991) The glacial history and glacial deposits of the north and west Cumbrian lowlands. In: Ehlers J, Gibbard PL, Rose J (eds) Glacial deposits of Great Britain and Ireland. Balkema, Rotterdam, pp 151–167
Huddart D (1994) The late Quaternary glaciogenic sequence: landforms and environments in coastal Cumbria. In: Boardman J, Walden J (eds) Cumbria—field guide. Quaternary Research Association, Oxford, pp 59–77
Huddart D (2002) Wasdale Screes. In: Huddart D, Glasser NF (eds) Quaternary of Northern England. JNCC, Peterborough, pp 334–348
Huddart D, Tooley MJ (1972) Field guide to the Cumberland lowlands. Quaternary Research Association, Cambridge, p 96
Hughes PD, Braithwaite RJ, Fenton CR, Schnabel C (2012) Two Younger Dryas glacier phases in the English Lake District: geomorphological evidence and preliminary 10Be exposure ages. Northwest Geogr 12:10–19
Hutchinson W (1794) The history of the county of Cumberland and of places adjacent. Jollie, Carlisle, pp 194–197
Jarman D (2015) Northern Lake District landscape evolution: the Threlkeld Gap and other enigmas. In: McDougall DA, Evans DJA (eds) The Quaternary of the Lake District—field guide. Quaternary Research Association, London, pp 175–187
Jarman D, Wilson P (2015a) Clough Head-Threlkeld Knotts: a perplexing RSF complex. In: McDougall DA, Evans DJA (eds) The Quaternary of the Lake District—field guide. Quaternary Research Association, London, pp 153–173
Jarman D, Wilson P (2015b) Anomalous terrain at Dove Crags ‘cirqueform’ and Gasgale Gill asymmetric valley, English Lake District, attributed to large-scale rock slope failure of pre-LGM origins. Proc Yorks Geol Soc 60:243–257
Johnson EW, Soper NJ, Burgess IC, Ball DF, Beddoe-Stephens B, Carruthers RM, Fortey NJ, Hirons SR, Merritt JW, Millward D, Molyneux SG, Roberts B, Rushton AWA, Walker AB, Young B (2001) Geology of the country around Ulverston. Memoir of the British Geological Survey Sheet 48 (England and Wales), p 129
Johnson RM, Warburton J (2002) Flooding and geomorphic impacts in a mountain torrent: Raise Beck, central Lake District, England. Earth Surf Process Landf 27:945–969
Johnson RM, Warburton J (2003) Regional assessment of contemporary debris flow activity in Lake District mountain catchments, northern England: occurrence, scale and process. In: Rickenmann D, Chen CL (eds) Debris flow hazards mitigation: mechanics, prediction and assessment. Millpress, Rotterdam, pp 965–976
Jones RT, Marshall JD, Cromwell SF, Bedford A, Richardson N, Bloemendal J, Oldfield F (2002) A high resolution, multiproxy Late-glacial record of climate change and intersystem responses in northwest England. J Quat Sci 17:329–340
Joyce HM, Hardy RJ, Warburton J, Large ARG (2018) Sediment continuity through the upland sediment cascade: geomorphic response of an upland river to an extreme flood event. Geomorphology 317:45–61
Kendall JD (1881) Distribution of boulders in West Cumberland. Trans Cumberl Assoc 5:151–157
Kendall JD (1924) A supposed glacier lake in West Cumberland. Geol Mag 61:541–550
Lamb AL, Ballantyne CK (1998) Palaeonunataks and the altitude of the last ice sheet in the south-west Lake District, England. Proc Geol Assoc 109:305–316
Linton DL (1957) Radiating valleys in glaciated lands. Tijdschrift van het Koninklijke Nederlandsche Aardrijkskundig. Genootschap 74:297–313
Livingstone SJ, Ó Cofaigh C, Evans DJA (2008) Glacial geomorphology of the central sector of the last British–Irish Ice Sheet. J Maps 2008:358–377
Livingstone SJ, Ó Cofaigh C, Evans DJA, Palmer A (2010a) Glaciolacustrine sedimentation in the Solway Lowlands (Cumbria, UK): evidence for a major glacial oscillation during Late Devensian deglaciation. Boreas 39:505–527
Livingstone SJ, Evans DJA, Ó Cofaigh C (2010b) Re-advance of Scottish ice into the Solway Lowlands (Cumbria, UK) during the Main Late Devensian deglaciation. Quat Sci Rev 29:2544–2570
Livingstone SJ, Ó Cofaigh C, Evans DJA (2010c) A major ice drainage pathway of the last British–Irish Ice Sheet: the Tyne Gap, northern England. J Quat Sci 25:354–370
Livingstone SJ, Evans DJA, Ó Cofaigh C (eds) (2010d) The Quaternary of the Solway Lowlands and Pennine Escarpment. Field guide. Quaternary Research Association, p 154
Livingstone SJ, Evans DJA, Ó Cofaigh C, Davies BJ, Merritt JW, Huddart D, Mitchell WA, Roberts DH, Yorke L (2012) Glaciodynamics of the central sector of the last British–Irish Ice Sheet in Northern England. Earth Sci Rev 111:25–55
Manley G (1959) The late-glacial climate of north-west England. Liverp Manch Geol J 2:188–215
Marr JE (1916) The geology of the Lake District and the scenery as influenced by geological structure. Cambridge University Press, Cambridge, p 220
McCarroll D (2006) Average glacial conditions and the glacial landscape of Snowdonia. In: Knight P (ed) Glacier science and environmental change. Blackwell, Oxford, pp 266–268
Chapter Google Scholar
McColl ST (2012) Paraglacial rock-slope stability. Geomorphology 153–154:1–16
McConnell RB (1938) Residual erosion surfaces in mountain ranges. Proc Yorksh Geol Soc 24:76–98
McDougall DA (2001) The geomorphological impact of Loch Lomond (Younger Dryas) Stadial plateau icefields in the central Lake District, northwest England. J Quat Sci 16:531–543
McDougall DA (2013) Glaciation style and the geomorphological record: evidence for Younger Dryas glaciers in the eastern Lake District, northwest England. Quat Sci Rev 73:48–58
McDougall DA, Pearce D (2015) Little Gatesgarthdale (Honister Pass). In: McDougall DA, Evans DJA (eds) The Quaternary of the Lake District—field guide. Quaternary Research Association, London, pp 191–200
McDougall DA, Bickerdike HL, Evans DJA (2015a) Glaciation style and development in the Pasture Beck and Hayeswater valleys. In: McDougall DA, Evans DJA (eds) The Quaternary of the Lake District—field guide. Quaternary Research Association, London, pp 111–128
McDougall DA, Bickerdike HL, Evans DJA, Vieli A (2015b) Glaciation in Deepdale. In: McDougall DA, Evans DJA (eds) The Quaternary of the Lake District—field guide. Quaternary Research Association, London, pp 241–254
Merritt JW, Auton CA (2000) An outline of the lithostratigraphy and depositional history of Quaternary deposits in the Sellafield district, West Cumbria. Proc Yorksh Geol Soc 53:129–154
Mitchell GH (1931) The geomorphology of the eastern part of the Lake District. Proc Liverp Geol Soc 15:322–338
Mitchell SG, Montgomery DR (2006) Influence of a glacial buzzsaw on the height and morphology of the Cascade Range in central Washington State, USA. Quat Res 65:96–107
Monkhouse FJ (1960) British landscapes through maps: the English Lake District. Geographical Association, Sheffield, p 19
NIREX (1997) The Quaternary of the Sellafield area. UK NIREX Ltd.
Oxford SP (1985) Protalus ramparts, protalus rock glaciers and soliflucted till in the northwest part of the English Lake District. In: Boardman J (ed) Field guide to the periglacial landforms of Northern England. Quaternary Research Association, Cambridge, pp 38–46
Parry JT (1960) The erosion surfaces of the southwestern Lake District. Trans Inst Br Geogr 28:39–54
Pearsall WH, Pennington W (1973) The Lake District: a landscape history. Collins, London, p 320
Pennington W (1978) Quaternary geology. In: Moseley EF (ed) The geology of the Lake District, vol 3. Yorkshire Geological Society, Occasional Publications, pp 207–225
Pinson LJW, Vardy ME, Dix JK, Henstock TJ, Bull JM, MacLachlan SE (2013) Deglacial history of glacial lake Windermere, UK: implications for the central British and Irish Ice Sheet. J Quat Sci 28:83–94
Raistrick A (1925) The glaciation of Borrowdale, Cumberland. Proc Yorks Geol Soc 20:155–181
Rea BR, Evans DJA (2003) Plateau icefield landsystems. In: Evans DJA (ed) Glacial landsystems. Arnold, London, pp 407–431
Rea BR, Whalley WB, Evans DJA, Gordon JE, McDougall DA (1998) Plateau icefields: geomorphology and dynamics. J Quat Sci 13:35–54
Reade TM (1900) The present aspects of glacial geology. Proc Liverp Geol Soc 8:13–31
Sissons JB (1980) The Loch Lomond advance in the Lake District, northern England. Trans R Soc Edinb Earth Sci 71:13–27
Smith A (1996) Alluvial fans in the Buttermere-Crummock valley. Proc Cumberl Geol Soc 6:47–62
Smith A (2003) Geology and the tarns of Lakeland. In: Haworth E, de Boer G, Evans IS, Osmaston H, Pennington W, Smith A, Storey P, Ware B (eds) Tarns of the Central Lake District. Brathay, Ambleside, pp 3–6
Smith B (1932) The glacier lakes of Eskdale, Mitterdale and Wasdale, Cumberland: and the retreat of the ice during the main glaciation. Q J Geol Soc Lond 88:57–83
Smith RA (2002) The Bowder Stone, Grange-in-Borrowdale, Cumbria. Proc Cumberl Geol Soc 6:525–539
Smith RF, Boardman J (1989) The use of soil information in the assessment of the incidence and magnitude of historical flood events in upland Britain. In: Beven K, Carling P (eds) Floods: hydrological, sedimentological and geomorphological implications. Wiley, Chichester, pp 185–197
Stone P, Millward D, Young B, Merritt JW, Clarke SM, McCormac M, Lawrence DJD (2010) Northern England. British Regional Geology, 5th edn. British Geological Survey, Nottingham, p 304
Taylor BJ, Burgess IC, Land DH, Mills DAC, Smith DB, Warren MA (1971) Northern England, 4th edn. British Regional Geology. Natural Environment Research Council, Institute of Geological Sciences, HMSO, London, p 121
Trotter FM (1929) The glaciation of East Edenside, the Alston Block and the Carlisle Plain. Q J Geol Soc Lond 85:549–612
Trotter FM, Hollingworth SE, Eastwood T, Rose WCC (1937) Gosforth district. Memoirs of the Geological Survey of Great Britain, Sheet 37. HMSO, London, p 136
Turnbull JM, Davies TRH (2006) A mass movement origin for cirques. Earth Surf Proc Landf 31:1129–1148
Vincent P (1985) Quaternary geomorphology of the southern Lake District and Morecambe Bay area. In: Johnson RH (ed) The geomorphology of North-west England. Manchester University Press, Manchester, pp 159–177
Walker D (1965) The post-glacial period in the Langdale Fells, English Lake District. New Phytol 64:488–510
Walker D (1966) The glaciation of the Langdale Fells. Geol J 5:208–215
Warburton J (1985) Contemporary patterned ground (sorted stripes) in the Lake District. In: Boardman J (ed) Field guide to the periglacial landforms of Northern England. Quat Res Assoc, Cambridge, pp 54–62
Warburton J (1987) Characteristic ratios of width to depth of sorting for sorted stripes in the English Lake District. In: Boardman J (ed) Periglacial processes and landforms in Britain and Ireland. Cambridge University Press, Cambridge, pp 163–171
Warburton J (1997) Patterned ground in the Lake District. In: Boardman J (ed) Geomorphology of the Lake District: a field guide. BGRG, Oxford, pp 107–119
Warburton J, Caine TN (1999) Sorted patterned ground in the English Lake District. Permafr Periglac Proc 10:193–197
Ward JC (1873a) The glaciation of the northern part of the Lake District. Q J Geol Soc 29:422–441
Ward JC (1873b) On rock fissuring. Geol Mag 10:245–248
Webb BC (1990) The buttermere formation (Skiddaw Group) in the robinson area. In: Moseley F (ed) The geology of the lake district. Geologists’ Association Guide No. 2, The Geologists’ Association, London, pp 74–82
Westaway R (2009) Quaternary uplift of northern England. Glob Planet Change 68:357–382
Whalley WB (1997) Protalus ramparts, rock glaciers and protalus lobes in the Lake District. In: Boardman J (ed) Geomorphology of the Lake District: a field guide. BGRG, Oxford, pp 51–61
Whalley WB (2009) On the interpretation of discrete debris accumulations associated with glaciers with special reference to the British Isles. In: Knight J, Harrison S (eds) Periglacial and paraglacial processes and environments, vol 320. Geological Society, London, Special Publications, pp 85–102
Whalley WB (2012) Using discrete debris accumulations to help interpret upland glaciation of the Younger Dryas in the British Isles. In: Piacentini T, Miccadei E (eds) Studies on environmental and applied geomorphology. InTech Europe, Rijeka, pp 1–20
Whalley WB (2015) Discrete debris accumulations in the Lake District and their role in the interpretation of past processes and climate. In: McDougall DA, Evans DJA (eds) The Quaternary of the Lake District—field guide. Quaternary Research Association, London, pp 97–107
Williams GD, Brabham PJ, Eaton GP, Harris C (2001) Devensian glaciotectonic deformation at St Bees, Cumbria: a critical wedge model. J Geol Soc London 158:125–135
Wilson P (1977) The Rosthwaite moraines. Proc Cumberl Geol Soc 3:239–249
Wilson P (2002) Morphology and significance of some Loch Lomond Stadial moraines in the south-central Lake District, England. Proc Geol Assoc 113:9–21
Wilson P (2004) Description and implications of valley moraines in upper Eskdale, Lake District. Proc Geol Assoc 115:55–61
Wilson P (2005) Paraglacial rock-slope failures in Wasdale, western Lake District, England: morphology, styles and significance. Proc Geol Assoc 116:349–361
Wilson P (2010) Lake District mountain landforms. Scotforth Books, Lancaster, p 210
Wilson P (2011a) The last glacier in Dovedale, Lake District. Northwest Geogr 11:7–13
Wilson P (2011b) Lake District hillslopes. Geol Today 27:149–153
Wilson P (2013) The Wast Water screes: how were they formed? Geogr Rev 26:22–24
Wilson P, Clark R (1998) Characteristics and implications of some Loch Lomond Stadial moraine ridges and later landforms, eastern Lake District, northern England. Geol J 33:73–87
Wilson P, Clark R (1999) Further glacier and snowbed sites of inferred loch lomond stadial age in the northern lake district. Proceedings of the Geologists’ Association 110:321–331
Wilson P, Jarman D (2013) The Burtness Comb rock avalanche, English Lake District: a rare case of rock slope failure—glacier interaction. Proc Geol Assoc 124:477–483
Wilson P, Jarman D (2015) Rock slope failure in the Lake District. In: McDougall DA, Evans DJA (eds) The Quaternary of the Lake District—field guide. Quaternary Research Association, London, pp 83–95
Wilson P, Smith A (2006) Geomorphological characteristics and significance of Late Quaternary paraglacial rock–slope failures on Skiddaw Group terrain, Lake District, northwest England. Geogr Ann 88A:237–252
Wilson P, Clark R, Smith A (2004) Rock-slope failures in the Lake District: a preliminary report. Proc Cumberl Geol Soc 7:13–36
Wilson P, Schnabel C, Wilcken KM, Vincent PJ (2013) Surface exposure dating ( 36 Cl and 10 Be) of post-Last Glacial Maximum valley moraines, Lake District, northwest England: some issues and implications. J Quat Sci 28:379–390
Woodhall DG (2000) Geology of the Keswick district. Sheet Description of the British Geological Survey, 1:50,000 Series Sheet 29 Keswick (England and Wales), p 48
Wooldridge SW, Morgan RS (1937) The physical basis of geography. Longmans, Green & Co., London
Download references
Author information
Authors and affiliations.
Department of Geography, Durham University, South Road, Durham, DH1 3LE, UK
David J. A. Evans
You can also search for this author in PubMed Google Scholar
Corresponding author
Correspondence to David J. A. Evans .
Editor information
Editors and affiliations.
School of Geography and the Environment, Oxford University, Oxford, UK
Andrew Goudie
Institute of Geography and Regional Development, University of Wrocław, Wroclaw, Poland
Piotr Migoń
Rights and permissions
Reprints and permissions
Copyright information
© 2020 Springer Nature Switzerland AG
About this chapter
Evans, D.J.A. (2020). Lake District. In: Goudie, A., Migoń, P. (eds) Landscapes and Landforms of England and Wales. World Geomorphological Landscapes. Springer, Cham. https://doi.org/10.1007/978-3-030-38957-4_27
Download citation
DOI : https://doi.org/10.1007/978-3-030-38957-4_27
Published : 11 May 2020
Publisher Name : Springer, Cham
Print ISBN : 978-3-030-38956-7
Online ISBN : 978-3-030-38957-4
eBook Packages : Earth and Environmental Science Earth and Environmental Science (R0)
Share this chapter
Anyone you share the following link with will be able to read this content:
Sorry, a shareable link is not currently available for this article.
Provided by the Springer Nature SharedIt content-sharing initiative
- Publish with us
Policies and ethics
- Find a journal
- Track your research
- Geography Review
- Adventure tourism in the Lake District: a rebranding case study
The Quaternary ice age
Shrinking the education gender gap, adventure tourism in the lake district, a rebranding case study.
The Lake District, together with the rest of Cumbria, is seeking to become the Adventure Capital of the UK by 2018. This article looks at the changes taking place, the impacts and the challenges involved. It is a useful case study of rural rebranding or managing rural change
- Volume 29, 2015/ 2016
- Changing Places/Changing Spaces Making Places/Regenerating Places or Diverse Places
- Glaciated landscapes
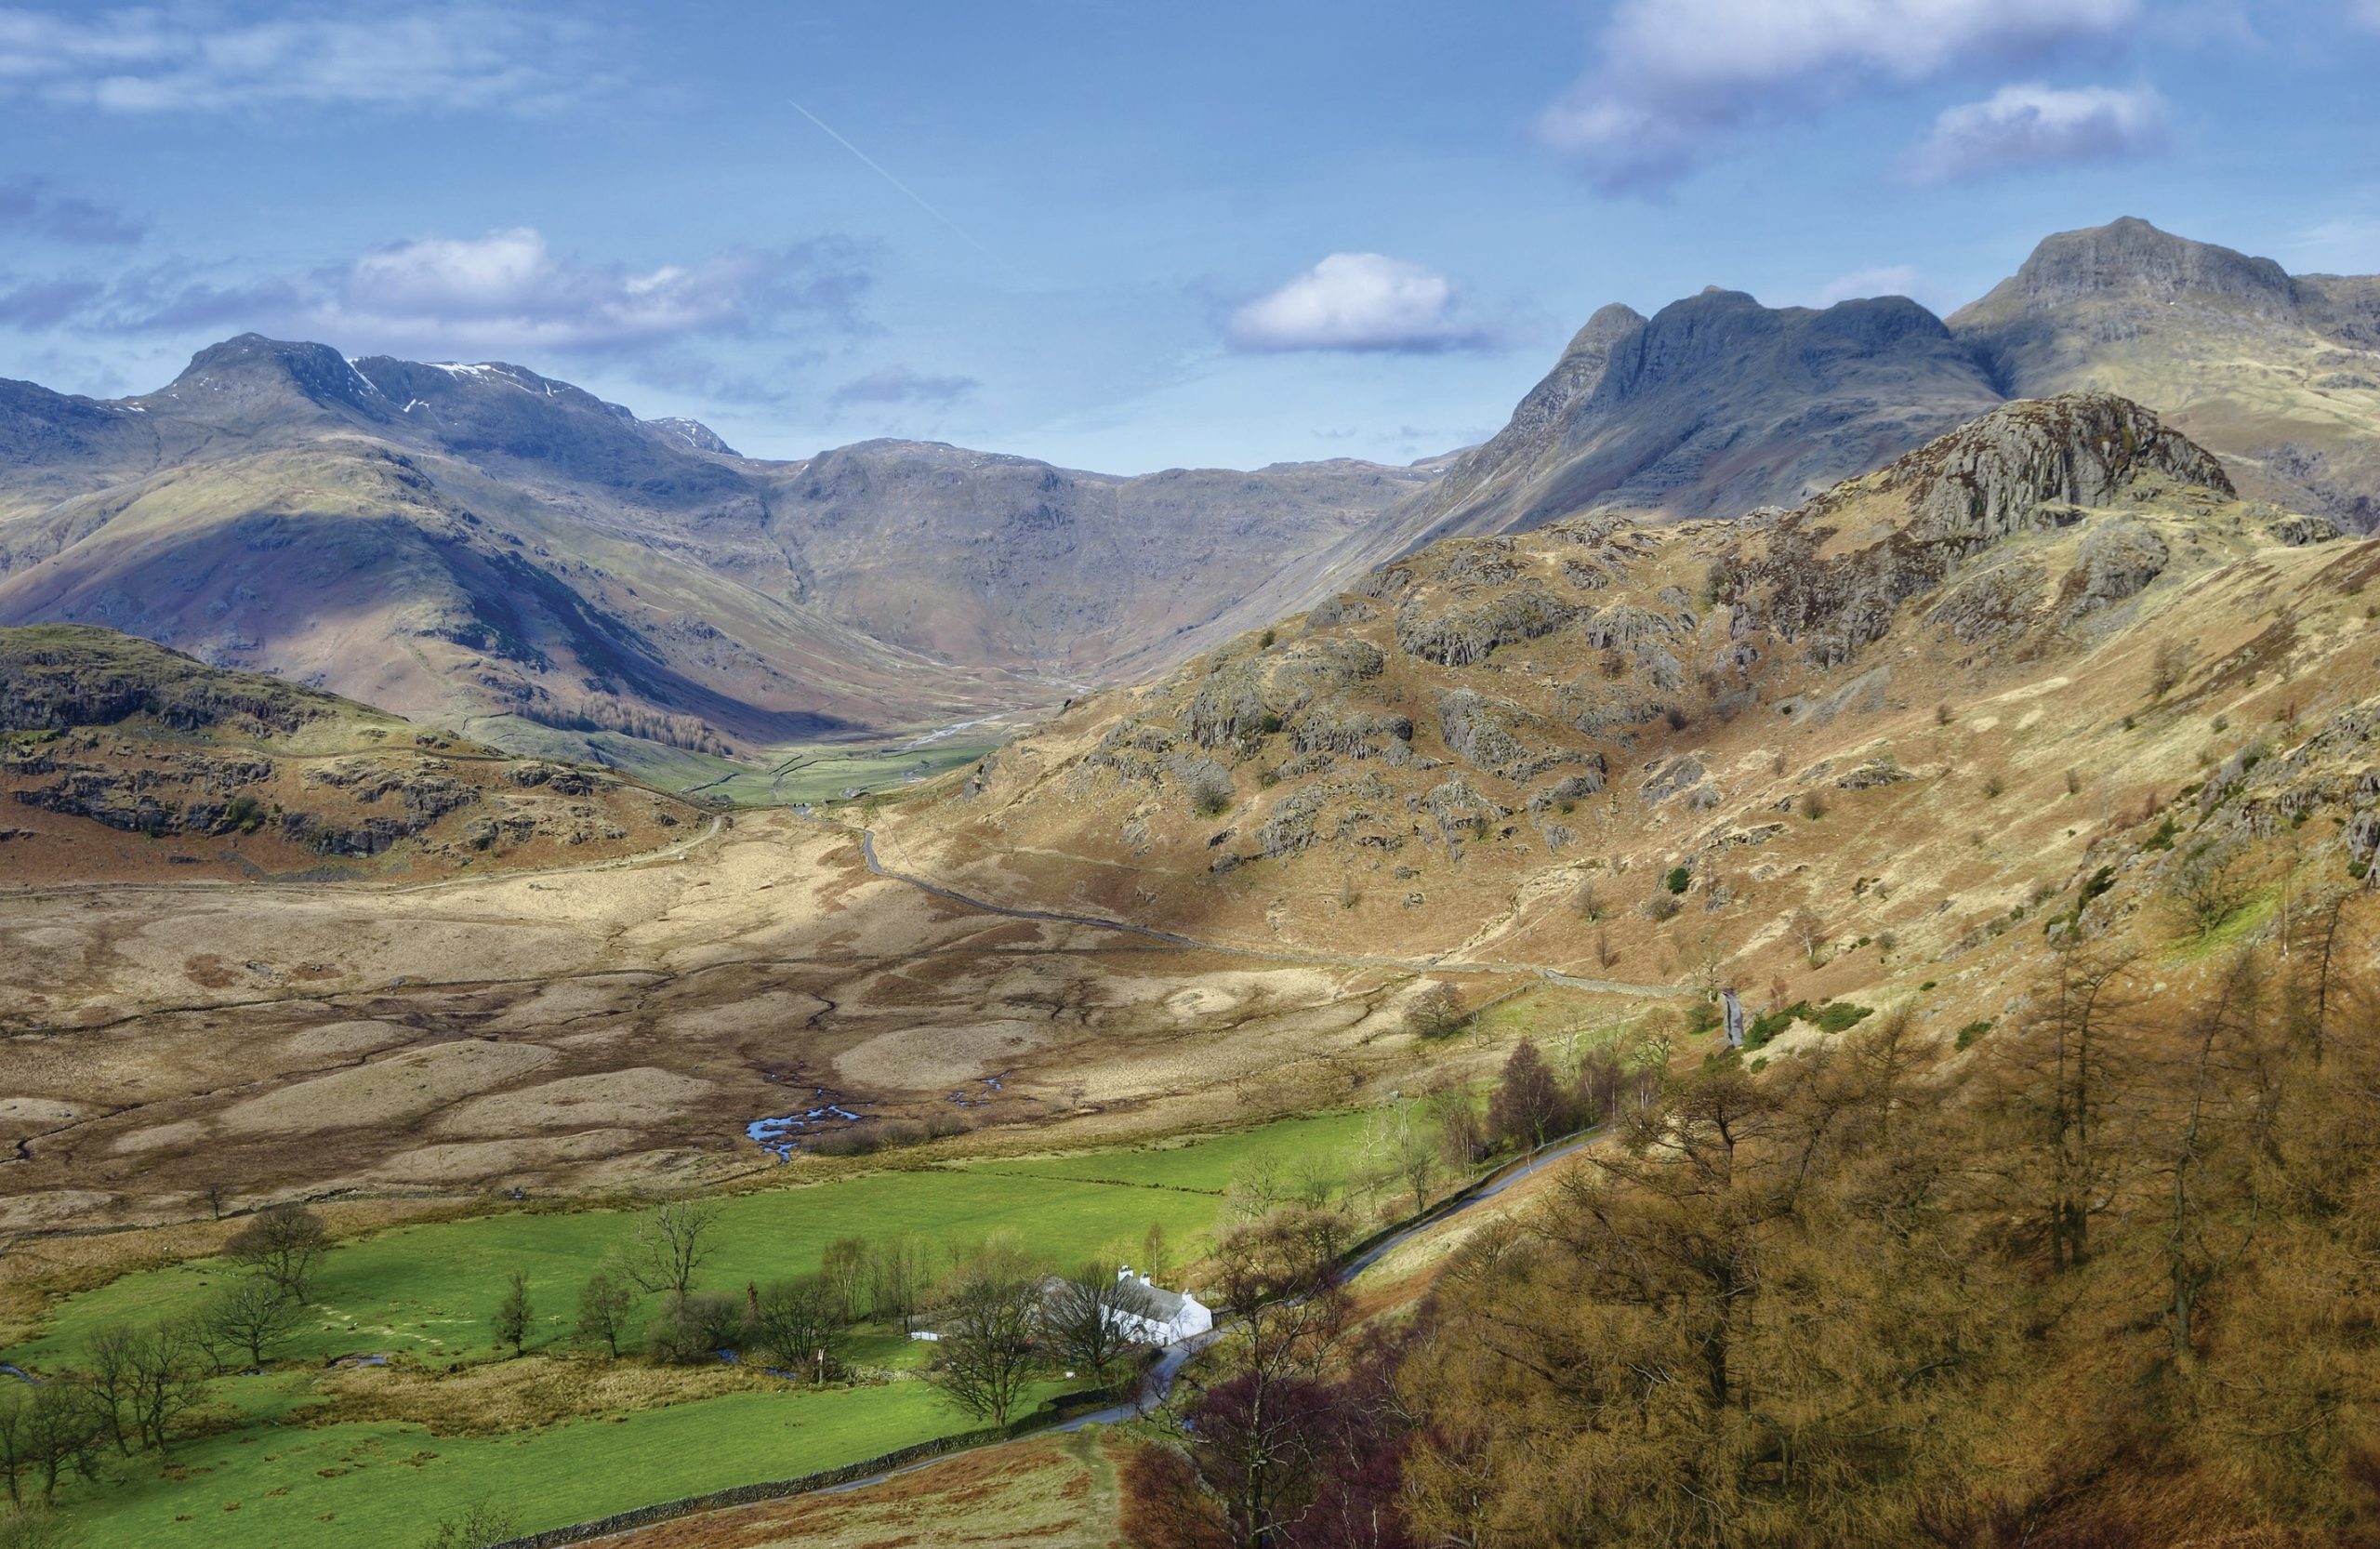
Tourism is a vital part of the economy for rural areas such as the English Lake District. The mountains and lakes of this part of northwest England have attracted walkers and sightseers for centuries, but for tourism to remain vibrant the interests of the next generation of visitors must be considered.
One recent rebranding strategy has been to focus on the growing niche market of adventure tourism. This market is expanding for several reasons:
Your organisation does not have access to this article.
Sign up today to give your students the edge they need to achieve their best grades with subject expertise
Related articles:

Chemistry crossword
Chemistry Review

Intermolecular forces

Magnifying problems in biology
Biological Sciences Review

Thank you for visiting nature.com. You are using a browser version with limited support for CSS. To obtain the best experience, we recommend you use a more up to date browser (or turn off compatibility mode in Internet Explorer). In the meantime, to ensure continued support, we are displaying the site without styles and JavaScript.
- View all journals
- My Account Login
- Explore content
- About the journal
- Publish with us
- Sign up for alerts
- Open access
- Published: 28 March 2024
New water accounting reveals why the Colorado River no longer reaches the sea
- Brian D. Richter ORCID: orcid.org/0000-0001-7216-1397 1 , 2 ,
- Gambhir Lamsal ORCID: orcid.org/0000-0002-2593-8949 3 ,
- Landon Marston ORCID: orcid.org/0000-0001-9116-1691 3 ,
- Sameer Dhakal ORCID: orcid.org/0000-0003-4941-1559 3 ,
- Laljeet Singh Sangha ORCID: orcid.org/0000-0002-0986-1785 4 ,
- Richard R. Rushforth 4 ,
- Dongyang Wei ORCID: orcid.org/0000-0003-0384-4340 5 ,
- Benjamin L. Ruddell 4 ,
- Kyle Frankel Davis ORCID: orcid.org/0000-0003-4504-1407 5 , 6 ,
- Astrid Hernandez-Cruz ORCID: orcid.org/0000-0003-0776-5105 7 ,
- Samuel Sandoval-Solis 8 &
- John C. Schmidt 9
Communications Earth & Environment volume 5 , Article number: 134 ( 2024 ) Cite this article
5252 Accesses
636 Altmetric
Metrics details
- Water resources
Persistent overuse of water supplies from the Colorado River during recent decades has substantially depleted large storage reservoirs and triggered mandatory cutbacks in water use. The river holds critical importance to more than 40 million people and more than two million hectares of cropland. Therefore, a full accounting of where the river’s water goes en route to its delta is necessary. Detailed knowledge of how and where the river’s water is used can aid design of strategies and plans for bringing water use into balance with available supplies. Here we apply authoritative primary data sources and modeled crop and riparian/wetland evapotranspiration estimates to compile a water budget based on average consumptive water use during 2000–2019. Overall water consumption includes both direct human uses in the municipal, commercial, industrial, and agricultural sectors, as well as indirect water losses to reservoir evaporation and water consumed through riparian/wetland evapotranspiration. Irrigated agriculture is responsible for 74% of direct human uses and 52% of overall water consumption. Water consumed for agriculture amounts to three times all other direct uses combined. Cattle feed crops including alfalfa and other grass hays account for 46% of all direct water consumption.
Disappearing cities on US coasts
Leonard O. Ohenhen, Manoochehr Shirzaei, … Robert J. Nicholls

Meta-analysis shows the impacts of ecological restoration on greenhouse gas emissions
Tiehu He, Weixin Ding, … Quanfa Zhang

Historical impacts of grazing on carbon stocks and climate mitigation opportunities
Shuai Ren, César Terrer, … Dan Liu
Introduction
Barely a trickle of water is left of the iconic Colorado River of the American Southwest as it approaches its outlet in the Gulf of California in Mexico after watering many cities and farms along its 2330-kilometer course. There were a few years in the 1980s in which enormous snowfall in the Rocky Mountains produced a deluge of spring snowmelt runoff capable of escaping full capture for human uses, but for most of the past 60 years the river’s water has been fully consumed before reaching its delta 1 , 2 . In fact, the river was overconsumed (i.e., total annual water consumption exceeding runoff supplies) in 16 of 21 years during 2000–2020 3 , requiring large withdrawals of water stored in Lake Mead and Lake Powell to accommodate the deficits. An average annual overdraft of 10% during this period 2 caused these reservoirs– the two largest in the US – to drop to three-quarters empty by the end of 2022 4 , triggering urgent policy decisions on where to cut consumption.
Despite the river’s importance to more than 40 million people and more than two million hectares (>5 million acres) of cropland—producing most of the vegetable produce for American and Canadian plates in wintertime and also feeding many additional people worldwide via exports—a full sectoral and crop-specific accounting of where all that water goes en route to its delta has never been attempted, until now. Detailed knowledge of how and where the river’s water is used can aid design of strategies and plans for bringing water use into balance with available supplies.
There are interesting historical reasons to explain why this full water budget accounting has not been accomplished previously, beginning a full century ago when the apportionment of rights to use the river’s water within the United States was inscribed into the Colorado River Compact of 1922 5 . That Compact was ambiguous and confusing in its allocation of water inflowing to the Colorado River from the Gila River basin in New Mexico and Arizona 6 , even though it accounts for 24% of the drainage area of the Colorado River Basin (Fig. 1 ). Because of intense disagreements over the rights to the Gila and other tributaries entering the Colorado River downstream of the Grand Canyon, the Compact negotiators decided to leave the allocation of those waters rights to a later time so that the Compact could proceed 6 . Arizona’s formal rights to the Gila and other Arizona tributaries were finally affirmed in a US Supreme Court decision in 1963 that also specified the volumes of Colorado River water allocated to California, Arizona, and Nevada 7 . Because the rights to the Gila’s waters lie outside of the Compact allocations, the Gila has not been included in formal accounting of the Colorado River Basin water budget to date 8 . Additionally, the Compact did not specify how much water Mexico—at the river’s downstream end—should receive. Mexico’s share of the river was not formalized until 22 years later, in the 1944 international treaty on “Utilization of the Waters of the Colorado and Tijuana Rivers and of the Rio Grande” (1944 Water Treaty) 9 . As a result of these political circumstances, full accounting for direct water consumption at the sectoral level—in which water use is accounted according to categories such as municipal, industrial, commercial, or agricultural uses—has not previously been compiled for the Gila River basin’s water, and sectoral accounting for Mexico was not published until 2023 10 .

The physical boundary of the Colorado River Basin is outlined in black. Hatched areas outside of the basin boundary receive Colorado River water via inter-basin transfers (also known as ‘exports’). The Gila River basin is situated in the far southern portion of the CRB in Arizona, New Mexico, and Mexico. Map courtesy of Center for Colorado River Studies, Utah State University.
The US Bureau of Reclamation (“Reclamation”)—which owns and operates massive water infrastructure in the Colorado River Basin—has served as the primary accountant of Colorado River water. In 2012, the agency produced a “Colorado River Basin Water Supply and Demand Study” 8 that accounted for both the sectoral uses of water within the basin’s physical boundaries within the US as well as river water exported outside of the basin (Fig. 1 ). But Reclamation did not attempt to account for water generated from the Gila River basin because of that sub-basin’s exclusion from the Colorado River Compact, and it did not attempt to explain how water crossing the border into Mexico is used. The agency estimated riparian vegetation evapotranspiration for the lower Colorado River but not the remainder of the extensive river system. Richter et al. 11 published a water budget for the Colorado River that included sectoral and crop-specific water consumption but it too did not include water used in Mexico, nor reservoir evaporation or riparian evapotranspiration, and it did not account for water exported outside of the Colorado River Basin’s physical boundary as illustrated in Fig. 1 . Given that nearly one-fifth (19%) of the river’s water is exported from the basin or used in Mexico, and that the Gila is a major tributary to the Colorado, this incomplete accounting has led to inaccuracies and misinterpretations of “where the Colorado River’s water goes” and has created uncertainty in discussions based on the numbers. This paper provides fuller accounting of the fate of all river water during 2000–2019, including averaged annual consumption in each of the sub-basins including exports, consumption in major sectors of the economy, consumption in the production of specific types of crops, and water consumed by reservoir evaporation and riparian/wetland evapotranspiration.
Rising awareness of water overuse and prolonged drought has driven intensifying dialog among the seven US states sharing the basin’s waters as well as between the United States, Mexico, and 30 tribal nations within the US. Since 2000, six legal agreements affecting the US states and two international agreements with Mexico have had the effect of reducing water use from the Colorado River 7 :
In 2001, the US Secretary of the Interior issued a set of “Interim Surplus Guidelines” to reduce California’s water use by 14% to bring the state within its allocation as determined in the 1963 US Supreme Court case mentioned previously. A subsequent “Quantification Settlement Agreement” executed in 2003 spelled out details about how California was going to achieve the targeted reduction.
In 2007, the US Secretary of the Interior adopted a set of “Colorado River Interim Guidelines for Lower Basin Shortages and the Coordinated Operations for Lake Powell and Lake Mead” that reduced water deliveries to Arizona and Nevada when Lake Mead drops to specified levels, with increasing cutbacks as levels decline.
In 2012, the US and Mexican federal governments signed an addendum to the 1944 Water Treaty known as Minute 319 that reduced deliveries to Mexico as Lake Mead elevations fall.
In 2017, the US and Mexican federal governments established a “Binational Water Scarcity Contingency Plan” as part of Minute 323 that provides for deeper cuts in deliveries to Mexico under specified low reservoir elevations in Lake Mead.i
In 2019, the three Lower Basin states and the US Secretary of the Interior agreed to commitments under the “Lower Basin Drought Contingency Plan” that further reduced water deliveries beyond the levels set in 2007 and added specifications for deeper cuts as Lake Mead drops to levels lower than anticipated in the 2007 Guidelines.
In 2023, the states of California, Arizona and Nevada committed to further reductions in water use through the year 2026 12 .
With each of the above agreements, overall water consumption has been reduced but many scientists assert that these reductions still fall substantially short of balancing consumptive use with 21st century water supplies 2 , 13 . With all of these agreements—excepting the Interim Surplus Guidelines of 2001—set to expire in 2026, management of the Colorado River’s binational water supply is now at a crucial point, emphasizing the need for comprehensive water budget accounting.
Our tabulation of the Colorado River’s full water consumption budget (Table 1 ) provides accounting for all direct human uses of water as either agricultural or MCI (municipal, commercial, industrial), as well as indirect losses of water to reservoir evaporation and evapotranspiration from riparian or wetland vegetation including in the Salton Sea and in a wetland in Mexico (Cienega de Santa Clara) that receives agricultural return flows from irrigated areas in Arizona. We explicitly note that all estimates represent consumptive use , resulting from the subtraction of return flows from total water withdrawals. Table 2 provides a summary based only on direct human uses and does not include indirect consumption of water. We have provided Tables 1 and 2 in English units in our Supplementary Information as Tables SI-1 and SI-2 . We have lumped municipal, commercial, and industrial (MCI) uses together because these sub-categories of consumption are not consistently differentiated within official water delivery data for cities utilizing Colorado River water. More detail on urban water use by cities dependent on the river is available in Richter 14 , among other studies.
We differentiated water consumption geographically using the ‘accounting units’ mapped in Fig. 2 , which are based on the Colorado River Basin map as revised by Schmidt 15 ; importantly, these accounting units align spatially with Reclamation’s accounting systems for the Upper Basin and Lower Basin as described in our Methods, thereby enabling readers accustomed to Reclamation’s water-use reports to easily comprehend our accounting. We have also accounted for all water consumed within the Colorado River Basin boundaries as well as water exported via inter-basin transfers. Water exported outside of the basin includes 47 individual inter-basin transfer systems (i.e., canals, pipelines, pumps) that in aggregate export ~12% of the river’s water. We note that the Imperial Irrigation District of southern California is often counted as a recipient of exported water, but we have followed the rationale of Schmidt 15 by including it as an interior part of the Lower Basin even though it receives its Colorado River water via the All American Canal (Fig. 2 ).

The water budget estimates presented in Tables 1 and 2 are summarized for each of the seven “accounting units” displayed here.
These results confirm previous findings that irrigated agriculture is the dominant consumer of Colorado River water. Irrigated agriculture accounts for 52% of overall consumption (Table 1 ; Figs. 3 and 4 ) and 74% of direct human consumption (Table 2 ) of water from the Colorado River Basin. As highlighted in Richter et al. 11 , cattle-feed crops (alfalfa and other hay) are the dominant water-consuming crops dependent upon irrigation water from the basin (Tables 1 and 2 ; Figs. 3 and 4 ). Those crops account for 32% of all water consumed from the basin, 46% of all direct water consumption, and 62% of all agricultural water consumed (Table 1 ; Fig. 3 ). The percentage of water consumed by irrigated crops is greatest in Mexico, where they account for 86% of all direct human uses (Table 2 ) and 80% of total water consumed (Table 1 ). Cattle-feed crops consume 90% of all water used by irrigated agriculture within the Upper Basin, where the consumed volume associated with these cattle-feed crops amounts to more than three times what is consumed for municipal, commercial, or industrial uses combined.

All estimates based on 2000–2019 averages. Both agriculture and MCI (municipal, commercial, and industrial) uses are herein referred to as “direct human uses.” “Indirect uses” include both reservoir evaporation as well as evapotranspiration by riparian/wetland vegetation.

Water consumed by each sector in the Colorado River Basin and sub-basins (including exports), based on 2000–2019 averages.
Another important finding is that a substantial volume of water (19%) is consumed in supporting the natural environment through riparian and wetland vegetation evapotranspiration along river courses. This analysis—made possible because of recent mapping of riparian vegetation in the Colorado River Basin 16 —is an important addition to the water budget of the Colorado River Basin, given that the only previous accounting for riparian vegetation consumption has limited to the mainstem of the Colorado River below Hoover Dam and does not include vegetation upstream of Hoover Dam nor vegetation along tributary rivers 17 . Given that many of these habitats and associated species have been lost or became imperiled due to river flow depletion 18 —including the river’s vast delta ecosystem in Mexico—an ecologically sustainable approach to water management would need to allow more water to remain in the river system to support riparian and aquatic ecosystems. Additionally, 11% of all water consumed in the Colorado River Basin is lost through evaporation from reservoirs.
It is also important to note a fairly high degree of inter-annual variability in each sector of water use; for example, the range of values portrayed for the four water budget sectors shown in Fig. 5 equates to 24–47% of their 20-year averages. Also notable is a decrease in water consumed in the Lower Basin between the years 2000 and 2019 for both the MCI (−38%) and agricultural sectors (−15%), which can in part be attributed to the policy agreements summarized previously that have mandated water-use reductions.

Inter-annual variability of water consumption within the Lower and Upper Basins, including water exported from these basins. The average (AVG) values shown are used in the water budgets detailed in Tables 1 and 2 .
The water accounting in Richter et al. 11 received a great deal of media attention including a front-page story in the New York Times 19 . These stories focused primarily on our conclusion that more than half (53%) of water consumed in the Colorado River Basin was attributable to cattle-feed crops (alfalfa and other hays) supporting beef and dairy production. However, that tabulation of the river’s water budget had notable shortcomings, as discussed previously. In this more complete accounting that includes Colorado River water exported outside of the basin’s physical boundary as well as indirect water consumption, we find that irrigated agriculture consumes half (52%) of all Colorado River Basin water, and the portion of direct consumption going to cattle-feed crops dropped from 53% as reported in Richter et al. 11 to 46% in this revised analysis.
These differences are explained by the fact that we now account for all exported water and also include indirect losses of water to reservoir evaporation and riparian/wetland evapotranspiration in our revised accounting, as well as improvements in our estimation of crop-water consumption. However, the punch line of our 2020 paper does not change fundamentally. Irrigated agriculture is the dominant consumer of water from the Colorado River, and 62% of agricultural water consumption goes to alfalfa and grass hay production.
Richter et al. 20 found that alfalfa and grass hay were the largest water consumers in 57% of all sub-basins across the western US, and their production is increasing in many western regions. Alfalfa is favored for its ability to tolerate variable climate conditions, especially its ability to persist under greatly reduced irrigation during droughts and its ability to recover production quickly after full irrigation is resumed, acting as a “shock absorber” for agricultural production under unpredictable drought conditions. The plant is also valued for fixing nitrogen in soils, reducing fertilizer costs. Perhaps most importantly, labor costs are comparatively low because alfalfa is mechanically harvested. Alfalfa is increasing in demand and price as a feed crop in the growing dairy industry of the region 21 . Any efforts to reduce water consumed by alfalfa—either through shifting to alternative lower-water crops or through compensated fallowing 20 —will need to compete with these attributes.
This new accounting provides a more comprehensive and complete understanding of how the Colorado River Basin’s water is consumed. During our study period of 2000–2019, an estimated average of 23.7 billion cubic meters (19.3 million acre-feet) of water was consumed each year before reaching its now-dry delta in Mexico. Schmidt et al. 2 have estimated that a reduction in consumptive use in the Upper and Lower Basins of 3–4 billion cubic meters (2.4–3.2 million acre-feet) per year—equivalent to 22–29% of direct use in those basins—will be necessary to stabilize reservoir levels, and an additional reduction of 1–3 billion cubic meters (~811,000–2.4 million acre-feet) per year will likely be needed by 2050 as climate warming continues to reduce runoff in the Colorado River Basin.
We hope that this new accounting will add clarity and a useful informational foundation to the public dialog and political negotiations over Colorado River Basin water allocations and cutbacks that are presently underway 2 . Because a persistent drought and intensifying aridification in the region has placed both people and river ecosystems in danger of water shortages in recent decades, knowledge of where the water goes will be essential in the design of policies for bringing the basin into a sustainable water supply-demand balance.
The data sources and analytical approaches used in this study are summarized below. Unless otherwise noted, all data were assembled for each year from 2000–2019 and then averaged. We acknowledge some inconsistency in the manner in which water consumption is measured or estimated across the various data sources and sectors used in this study, as discussed below, and each of these different approaches entail some degree of inaccuracy or uncertainty. We also note that technical measurement or estimation approaches change over time, and new approaches can yield differing results. For instance, the Upper Colorado River Commission is exploring new approaches for estimating crop evapotranspiration in the Upper Basin 22 . When new estimates become available we will update our water budget accordingly.
MCI and agricultural water consumption
The primary source of data on aggregate MCI (municipal, commercial, and industrial) and agricultural water consumption from the Upper and Lower Basins was the US Bureau of Reclamation. Water consumed from the Upper Basin is published in Reclamation’s five-year reports entitled “Colorado River—Upper Basin Consumptive Uses and Losses.” 23 These annual data have been compiled into a single spreadsheet used for this study 24 . Because measurements of agricultural diversions and return flows in the Upper Basin are not sufficiently complete to allow direct calculation of consumptive use, theoretical and indirect methods are used as described in the Consumptive Uses and Losses reports 25 . Reclamation performs these estimates for Colorado, Wyoming, and Utah, but the State of New Mexico provides its own estimates that are collaboratively reviewed with Reclamation staff. The consumptive use of water in thermoelectric power generation in the Upper Basin is provided to Reclamation by the power companies managing each generation facility. Reclamation derives estimates of consumptive use for municipal and industrial purposes from the US Geological Survey’s reporting series (published every 5 years) titled “Estimated Use of Water in the United States” at an 8-digit watershed scale 26 .
Use of shallow alluvial groundwater is included in the water accounting compiled by Reclamation but use of deeper groundwater sources—such as in Mexico and the Gila River Basin—is explicitly excluded in their accounting, and in ours. Reclamation staff involved with water accounting for the Upper and Lower Basins assume that groundwater use counted in their data reports is sourced from aquifers that are hydraulically connected to rivers and streams in the CRB (James Prairie, US Bureau of Reclamation, personal communication, 2023); because of this high connectivity, much of the groundwater being consumed is likely being sourced from river capture as discussed in Jasechko et al. 27 and Wiele et al. 28 and is soon recharged during higher river flows.
Water consumed from the Lower Basin (excluding water supplied by the Gila River Basin) is published in Reclamation’s annual reports entitled “Colorado River Accounting and Water Use Report: Arizona, California, and Nevada.” 3 These consumptive use data are based on measured deliveries and return flows for each individual water user. These data are either measured by Reclamation or provided to the agency by individual water users, tribes, states, and federal agencies 29 . When not explicitly stated in Reclamation reports, attribution of water volumes to MCI or agricultural uses was based on information obtained from each water user’s website, information provided directly by the water user, or information on export water use provided in Siddik et al. 30 . Water use by entities using less than 1.23 million cubic meters (1000 acre-feet) per year on average was allocated to MCI and agricultural uses according to the overall MCI-agricultural percentages calculated within each sub-basin indicated in Tables 1 and 2 for users of greater than 1.23 million cubic meters/year.
Disaggregation of water consumption by sector was particularly important and challenging for the Central Arizona Project given that this canal accounts for 21% of all direct water consumption in the Lower Basin. Reclamation accounts for the volumes of annual diversions into the Central Arizona Project canal but the structure serves 1071 water delivery subcontracts. We classified every unique Central Arizona Project subcontract delivery between 2000–2019 by its final water use to derive an estimated split between agricultural and MCI uses. Central Arizona Project subcontract delivery data were obtained from the current and archived versions of the project’s website summaries in addition to being directly obtained from the agency through a public information request. Subcontract deliveries were classified based on the final end use, including long-term and temporary leases of project water. This accounting also includes the storage of water in groundwater basins for later MCI or agricultural use. Additionally, water allocated to Native American agricultural uses that was subsequently leased to cities was classified as an MCI use.
Data for the Gila River basin was obtained from two sources. The Arizona Department of Water Resources has published data for surface water use in five “Active Management Areas” (AMAs) located in the Gila River basin: Prescott AMA, Phoenix AMA, Pinal AMA, Tucson AMA, and Santa Cruz AMA 31 . The water-use data for these AMAs is compiled from annual reports submitted by each water user (contractor) and then reviewed by the Arizona Department of Water Resources. The AMA water-use data are categorized by purpose of use, facilitating our separation into MCI and agricultural uses. These data are additionally categorized by water source; only surface water sourced from the Gila River hydrologic system was counted (deep groundwater use was not). The AMA data were supplemented with data for the upper Gila River basin provided by the University of Arizona 32 . We have assumed that all water supplied by the Gila River Basin is fully consumed, as the river is almost always completely dry in its lower reaches (less than 1% flows out of the basin into the Colorado River, on average 33 ).
Data for Mexico were obtained from Hernandez-Cruz et al. 10 based on estimates for 2008–2015. Agricultural demands were estimated from annual reports of irrigated area and water use published by the Ministry of Agriculture and the evapotranspiration estimates of the principal crops published by the National Institute for Forestry, Animal Husbandry, and Agricultural Research of Mexico 10 . The average annual volume of Colorado River water consumption in Mexico estimated by these researchers is within 1% of the cross-border delivery volume estimated by the Bureau of Reclamation for 2000–2019 in its Colorado River Accounting and Water Use Reports 3 .
Exported water consumption
Annual average inter-basin transfer volumes for each of 46 canals and pipelines exporting water outside of the Upper Basin were obtained from Reclamation’s Consumptive Uses and Losses spreadsheet 34 . Data for the Colorado River Aqueduct in the Lower Basin were obtained from Siddik et al. 30 Data for exported water in Mexico was available from Hernandez-Cruz et al. 10 . We assigned any seepage or evaporation losses from inter-basin transfers to their proportional end uses. All uses of exported water are considered to be consumptive uses with respect to the Colorado River, because none of the water exported out of the basin is returned to the Colorado River Basin.
We relied on data from Siddik et al. (2023) to identify whether the water exported out of the Colorado River Basin was for only MCI or agricultural use. When more than one water use purpose was identified, as well as for all major inter-basin transfers, we used government and inter-basin transfer project websites or information obtained directly from the project operator or water manager to determine the volume of water transferred and the end uses. Major recipients of exported water include the Coachella Valley Water District (California); Metropolitan Water District of Southern California (particularly for San Diego County, California); Northern Colorado Water Conservancy District; City of Denver (Colorado); the Central Utah Project; City of Albuquerque (New Mexico); and the Middle Rio Grande Conservancy District (New Mexico). We did not pursue sectoral water-use information for 17 of the 46 Upper Basin inter-basin transfers due to their relatively low volumes of water transferred by each system (<247,000 cubic meters or 2000 acre-feet), and instead assigned the average MCI or agricultural percentage (72% MCI, 28% agricultural) from all other inter-basin transfers in the Upper Basin. The export volume of these 17 inter-basin transfers sums to 9.76 million cubic meters (7910 acre-feet) per year, equivalent to 1% of the total volume exported from the Upper Basin.
Reservoir evaporation
Evaporation estimates for the Upper Basin and Lower Basin are based upon Reclamation’s HydroData repository 35 . Reclamation’s evaporation estimates are based on the standardized Penman-Monteith equation as described in the “Lower Colorado River Annual Summaries of Evapotranspiration and Evaporation” reports 17 . The Penman-Monteith estimates are based on pan evaporation measurements. Evaporation estimates for the Salt River Project reservoirs in the Gila River basin were provided by the Salt River Project in Arizona (Charlie Ester, personal communication, 2023).
Another consideration with reservoirs is the volume of water that seeps into the banks or sediments surrounding the reservoir when reservoir levels are high, but then drains back into the reservoir as water levels decline 36 . This has the effect of either exacerbating reservoir losses (consumptive use) or offsetting evaporation when bank seepage flows back into a reservoir. The flow of water into and out of reservoir banks is non-trivial; during 1999–2008, an estimated 247 million cubic meters (200,000 acre-feet) of water drained from the canyon walls surrounding Lake Powell into the reservoir each year, providing additional water supply 36 . However, the annual rate of alternating gains or losses has not been sufficiently measured at any of the basin’s reservoirs and therefore is not included in Tables 1 and 2 .
Riparian and wetland vegetation evapotranspiration
We exported the total annual evapotranspiration depth at a 30 meter resolution from OpenET 37 using Google Earth Engine from 2016 to 2019 to align with OpenET’s data availability starting in 2016. Total annual precipitation depths, sourced from gridMET 38 , were resampled to align with the evapotranspiration raster resolution. Subsequently, a conservative estimate of the annual water depth utilized by riparian vegetation from the river was derived by subtracting the annual precipitation raster from the evapotranspiration raster for each year. Positive differentials, indicative of river-derived evapotranspiration, were then multiplied by the riparian vegetation area as identified in the CO-RIP 16 dataset to estimate the total annual volumetric water consumption by riparian vegetation across the Upper, Lower, and Gila River Basins. The annual volumetric water consumption calculated over four years were finally averaged to get riparian vegetation evapotranspiration in the three basins. Because the entire flow of the Colorado River is diverted into the Canal Alimentador Central near the international border, very little riparian evapotranspiration occurs along the river south of the international border in the Mexico basin.
In addition to water consumed by riparian evapotranspiration within the Lower Basin, the Salton Sea receives agricultural drain water from both the Imperial Irrigation District and the Coachella Valley Irrigation District, stormwater drainage from the Coachella Valley, and inflows from the New and Alamo Rivers 39 . Combined inflows to the Sea during 2015–2019 were added to our estimates of riparian/wetland evapotranspiration in the Lower Basin.
Similarly, Mexico receives drainage water from the Wellton–Mohawk bypass drain originating in southern Arizona that empties into the Cienega de Santa Clara (a wetland); this drainage water is included as riparian/wetland evapotranspiration in the Mexico basin.
Crop-specific water consumption
The volumes of total agricultural consumption reported for each sub-basin in Tables 1 and 2 were obtained from the same data sources described above for MCI consumption and exported water. The portion (%) of those agricultural consumption volumes going to each individual crop was then allocated according to percentage estimates of each crop’s water consumption in each accounting unit using methods described in Richter et al. 20 and detailed here.
Monthly crop water requirements during 1981–2019 for 13 individual crops, representing 68.8% of total irrigated area in the US in 2019, were estimated using the AquaCrop-OS model (Table SI- 3 ) 40 . For 17 additional crops representing about 25.4% of the total irrigated area, we used a simple crop growth model following Marston et al. 41 as crop parameters needed to run AquaCrop-OS were not available. A list of the crops included in this study is shown in Table SI- 3 . The crop water requirements used in Richter et al. 11 were based on a simplistic crop growth model, often using seasonal crop coefficients whereas we use AquaCrop-OS 40 , a robust crop growth model, to produce more realistic crop growth and crop water estimates for major crops. AquaCrop-OS is an open-source version of the AquaCrop model 42 , a crop growth model capable of simulating herbaceous crops. Additionally, we leverage detailed local data unique to the US, including planting dates and subcounty irrigated crop areas, to produce estimates at a finer spatial resolution than the previous study. We obtained crop-specific planting dates from USDA 43 progress data at the state level. For crops that did not have USDA crop progress data, we used data from FAO 44 and CUP+ model 45 for planting dates. We used climate data (precipitation, minimum and maximum air temperature, reference ET) from gridMET 38 , soil texture data from ISRIC 46 database and crop parameters from AquaCrop-OS to run the model. The modeled crop water requirement was partitioned into blue and green components following the framework from Hoekestra et al. 47 , assuming that blue and green water consumed on a given day is proportional to the amount of green and blue water soil moisture available on that day. When applying a simple crop growth model, daily gridded (2.5 arc minutes) crop-specific evapotranspiration (ETc) was computed by taking the product of reference evapotranspiration (ETo) and crop coefficient (Kc), where ETo was obtained from gridMET. Crop coefficients were calculated using planting dates and crop coefficient curves from FAO and CUP+ model. Kc was set to zero outside of the growing season. We partitioned the daily ETc into blue and green components by following the methods from ref. 41 It is assumed that the crop water demands are met by irrigation whenever it exceeds effective precipitation (the latter calculated using the USDA Soil Conservation Service method (USDA, 1968 48 ). We obtained county level harvested area from USDA 43 and disaggregated to sub-county level using Cropland Data Layer (CDL) 49 and Landsat-based National Irrigation Dataset (LANID) 50 . The CDL is an annual raster layer that provides crop-specific land cover data, while the LANID provides irrigation status information. The CDL and LANID raster were multiplied and aggregated to 2.5 arc minutes to match the AquaCrop-OS output. We produced a gridded crop area map by using this resulting product as weights to disaggregate county level area. CDL is unavailable before 2008. Therefore, we used land use data from ref. 51 in combination with average CDL map and county level harvested area to produce gridded crop harvested area. We computed volumetric water consumption by multiplying the crop water requirement depth by the corresponding crop harvested area.
Data availability
All data compiled and analyzed in this study are publicly available as cited and linked in our Methods section. Our compilation of these data is also available from Hydroshare at: http://www.hydroshare.org/resource/2098ae29ae704d9aacfd08e030690392 .
Code availability
All model code and software used in this study have been accessed from sources cited in our Methods section. We used AquaCrop-OS (v5.0a), an open source version of AquaCrop crop growth model, to run crop simulations. This model is publicly available at http://www.aquacropos.com/ . For estimating riparian evapotranspiration, we used ArcGIS Pro 3.1.3 on the Google Earth Engine. Riparian vegetation distribution maps were sourced from Dryad at https://doi.org/10.5061/dryad.3g55sv8 .
Stromberg, J. C., Andersen, D. C. & Scott, M. L. Riparian floodplain wetlands of the arid and semiarid southwest In Wetland Habitats of North America: Ecology and Conservation Concern s , Chapter 24, pp. 343–356. (University of California Press, 2012). https://www.ucpress.edu/book/9780520271647/wetland-habitats-of-north-america .
Schmidt, J. C., Yackulic, C. B. & Kuhn, E. The Colorado River water crisis: Its origin and the future. WIREs Water https://doi.org/10.1002/wat2.1672 (2023).
Article Google Scholar
Colorado River Accounting and Water Use Report: Arizona, California, and Nevada. Interior Region 8: Lower Colorado Basin (US Bureau of Reclamation, 2023). Annual reports available under “Water Accounting Reports” at https://www.usbr.gov/lc/region/g4000/wtracct.html .
Water Operations: Historic Data (US Bureau of Reclamation, 2023). https://www.usbr.gov/rsvrWater/HistoricalApp.html .
Colorado River Compact , 1922 . US Bureau of Reclamation. https://www.usbr.gov/lc/region/pao/pdfiles/crcompct.pdf .
Kuhn, E. & Fleck, J. Science Be Dammed:How Ignoring Inconvenient Science Drained the Colorado River (The University of Arizona Press, 2019) https://uapress.arizona.edu/book/science-be-dammed .
Castle, A. & Fleck, J. The Risk of Curtailment under the Colorado River Compact ( https://doi.org/10.2139/ssrn.3483654 (2019).
US Bureau of Reclamation. Colorado River Basin Water Supply and Demand Study: Technical Report C – Water Demand Assessment https://www.usbr.gov/lc/region/programs/crbstudy/finalreport/Technical%20Report%20C%20-%20Water%20Demand%20Assessment/TR-C-Water_Demand_Assessmemt_FINAL.pdf (2012).
Utilization of the Waters of the Colorado and Tijuana Rivers and of the Rio Grande . International Treaty between the United States and Mexico, February 3, 1944. (International Boundary and Waters Commission, 1944). https://www.ibwc.gov/wp-content/uploads/2022/11/1944Treaty.pdf .
Hernández-Cruz, A. et al. Assessing water management strategies under water scarcity in the Mexican portion of the Colorado River Basin. J. Water Resour. Plan. Manag. 149 , 04023042 (2023).
Richter, B. D. et al. Water scarcity and fish imperilment driven by beef production. Nat. Sustain. 3 , 319–328 (2020).
Biden-Harris Administration announces historic Consensus System Conservation Proposal to protect the Colorado River Basin . US Department of the Interior, May 22, 2023. https://www.doi.gov/pressreleases/biden-harris-administration-announces-historic-consensus-system-conservation-proposal .
Wheeler, K. G. et al. What will it take to stabilize the Colorado River? Science 377 , 373–375 (2022).
Article ADS CAS PubMed Google Scholar
Richter, B. D. Decoupling urban water use from population growth in the Colorado River Basin. J. Water Plan. Manag. 149 , 2 (2023).
Google Scholar
Schmidt, J. C. Maps Matter: A few suggested changes to the Colorado River basin base map . Center for Colorado River Studies. (Utah State University, 2022).
Woodward, B. D. et al. Co-Rip: A riparian vegetation and corridor extent dataset for Colorado river basin streams and rivers. ISPRS Int. J. Geo Inform. 7 , 397 (2018).
Article ADS Google Scholar
Lower Colorado River Annual Summaries of Evapotranspiration and Evaporation . (US Bureau of Reclamation, Lower Colorado Region, 2023). https://www.usbr.gov/lc/region/g4000/wtracct.html .
Richter, B. D., Powell, E. M., Lystash, T. & Faggert, M. Protection and restoration of freshwater ecosystems. Chapter 5 in Miller, Kathleen A., Alan F. Hamlet, Douglas S. Kenney, and Kelly T. Redmond (Eds.) Water Policy and Planning in a Variable and Changing Climate . (CRC Press - Taylor & Francis Group, 2016).
Shao, Elena. “The Colorado River is shrinking. See what’s using all the water.” New York Times , May 22, 2023. https://www.nytimes.com/interactive/2023/05/22/climate/colorado-river-water.html .
Richter, B. D., et al. Alleviating water scarcity by optimizing crop mixes. Nat. Water . https://doi.org/10.1038/s44221-023-00155-9 .
Njuki, E. U.S. dairy productivity increased faster in large farms and across southwestern states . U.S. Economic Research Service, US Department of Agriculture, March 22, 2022. https://www.ers.usda.gov/amber-waves/2022/march/u-s-dairy-productivity-increased-faster-in-large-farms-and-across-southwestern-states/ .
Mefford, B. & Prairie J., eds. Assessing Agricultural Consumptive Use in the Upper Colorado River Basin - Phase III Report U.S. Bureau of Reclamation and the Upper Colorado River Commission. http://www.ucrcommission.com/reports-studies/ (2022).
Upper Basin Consumptive Uses and Losses (Bureau of Reclamation). Annual reports available at https://www.usbr.gov/uc/envdocs/plans.html .
Bureau of Reclamation. “Consumptive Uses and Losses spreadsheet 1971–2020” Colorado River Basin Natural Flow and Salt Data, Supporting data for consumptive uses and losses computation. https://www.usbr.gov/lc/region/g4000/NaturalFlow/documentation.html .
Upper Colorado River Basin Consumptive Uses and Losses Report 2016–2020 . US Department of Interior: Bureau of Reclamation. Five year reports available under “Colorado River-Consumptive Uses and Losses Reports” at https://www.usbr.gov/uc/envdocs/plans.html .
Estimated Use of Water in the United States . US Department of Interior: US Geological Survey. Reports available every five years at https://www.usgs.gov/mission-areas/water-resources/science/water-use-united-states .
Jasechko, S. et al. Widespread potential loss of streamflow into underlying aquifers across the USA. Nature 591 , 391–395 (2021).
Wiele, S. M., Leake, S. A., Owen-Joyce, S. J. & and McGuire, E. H. Update of the Accounting Surface Along the Lower Colorado River US Department of the Interior: US Geological Survey Scientific Investigations Report 2008–5113 (2008).
Bruce, B. W., et al. Comparison of U.S. Geological Survey and Bureau of Reclamation water-use reporting in the Colorado River Basin U.S. Geological Survey Scientific Investigations Report 2018–5021 . https://doi.org/10.3133/sir20185021 (2018).
Siddik, M. A. B., Dickson, K. E., Rising, J., Ruddell, B. L. & Marston, L. T. Interbasin water transfers in the United States and Canada. Sci. Data 10 , 27 (2023). Data spreadsheet provided by M.A.B. Siddik.
Article PubMed PubMed Central Google Scholar
Active Management Areas : AMA Annual Supply and Demand Dashboard (Arizona Department of Water Resources, 2023). https://azwater.gov/ama/ama-data .
Lacroix, K. M. et al. Wet water and paper water in the Upper Gila River Watershed https://extension.arizona.edu/sites/extension.arizona.edu/files/pubs/az1708-2016_0.pdf The University of Arizona Cooperative Extension, AZ1708. Data spreadsheet provided by A. Hullinger (2016).
Surface-Water Annual Statistics for the Nation: Gila River at Dome, Arizona . US Geological Survey. Available at https://waterdata.usgs.gov/nwis/annual/?referred_module=sw&site_no=09520500&por_09520500_5810=19975,00060,5810,1905,2024&year_type=C&format=html_table&date_format=YYYY-MM-DD&rdb_compression=file&submitted_form=parameter_selection_list .
Consumptive Uses and Losses spreadsheet 1971–2020 . Bureau of Reclamation, Colorado River Basin Natural Flow and Salt Data, Supporting data for consumptive uses and losses computation. https://www.usbr.gov/lc/region/g4000/NaturalFlow/documentation.html .
HydroData: Reservoir Data . US Bureau of Reclamation. https://www.usbr.gov/uc/water/ .
Myers, T. Loss rates from Lake Powell and their impact on management of the Colorado River. J. Am. Water Resour. Assoc. 49 , 1213–1224 (2013).
Melton, F. S. et al. OpenET: filling a critical data gap in water management for the western United States. J. Am. Water Resour. Assoc. 58 , 971–994 (2022).
Abatzoglou, J. T. Development of gridded surface meteorological data for ecological applications and modelling. Int. J. Climatol. 33 , 121–131 (2013).
Salton Sea Management Program: Long-Range Plan Public Draft (2022). California Natural Resources Agency. https://saltonsea.ca.gov/wp-content/uploads/2022/12/Salton-Sea-Long-Range-Plan-Public-Draft-Dec-2022.pdf .
Foster, T. et al. AquaCrop-OS: an open source version of FAO’s crop water productivity model. Agricul. Water Manag. 181 , 18–22 (2017).
Marston, L. T., et al. Reducing water scarcity by improving water productivity in the United States. Environ. Res. Lett. 15 https://doi.org/10.1088/1748-9326/ab9d39 (2020).
Steduto, P., Hsiao, T. C., Fereres, E. & Raes, D. Crop yield response to water (2012). 1028. Rome: Food and Agriculture Organization of the United Nations.
USDA, National Agricultural Statistics Service. “Quick Stats.” http://quickstats.nass.usda.gov .
Allen, R. G., Pereira, L. S., Raes, D. & Smith, M. FAO Irrigation and drainage paper No. 56 56, (e156. Food and Agriculture Organization of the United Nations, Rome, 1998).
Orange, M. N., Scott Matyac, J. & Snyder, R. L. Consumptive use program (CUP) model. IV Int. Symp. Irrig. Horticult. Crops 664 , 461–468 (2003).
Hengl, T. et al. SoilGrids250m: Global gridded soil information based on machine learning. PLoS One 12 , e0169748 (2017).
Hoekstra, A. Y. Green-blue water accounting in a soil water balance. Adv. Water Resour. 129 , 112–117 (2019).
USDA (US Department of Agriculture). A Method for Estimating Volume and Rate of Runoff in Small Watersheds . SCS-TP-149. Washington DC: Soil Conservation Service (1968).
Johnson, D. M., & Mueller, R. 2010. “Cropland Data Layer.” https://nassgeodata.gmu.edu/CropScape/ .
Xie, Y., Gibbs, H. K. & Lark, T. J. Landsat-based Irrigation Dataset (LANID): 30m resolution maps of irrigation distribution, frequency, and change for the US, 1997–2017. Earth Syst. Sci. Data 13 , 5689–5710 (2021).
Sohl, T. et al. Modeled historical land use and land cover for the conterminous United States. J. Land Use Sci. 11 , 476–499 (2016).
Download references
Acknowledgements
This paper is dedicated to our colleague Jack Schmidt in recognition of his retirement and enormous contributions to the science and management of the Colorado River. The authors thank James Prairie of the US Bureau of Reclamation, Luke Shawcross of the Northern Colorado Water Conservancy District, Charlie Ester of the Salt River Project, and Brian Woodward of the University of California Cooperative Extension for their assistance in accessing data used in this study. The authors also thank Rhett Larson at the Sandra Day O’Connor School of Law at Arizona State University for their review of Arizona water budget data, and the Central Arizona Project for providing delivery data by each subcontract. G.L., L.M., and K.F.D. acknowledge support by the United States Department of Agriculture National Institute of Food and Agriculture grant 2022-67019-37180. L.T.M. acknowledges the support the National Science Foundation grant CBET-2144169 and the Foundation for Food and Agriculture Research Grant No. FF-NIA19-0000000084. R.R.R. acknowledges the support the National Science Foundation grant CBET-2115169.
Author information
Authors and affiliations.
World Wildlife Fund, 1250 24th St NW, Washington, DC, 20037, USA
Brian D. Richter
Sustainable Waters, Crozet, Virginia, 22932, USA
The Charles E.Via, Jr, Department of Civil and Environmental Engineering, Virginia Tech, Blacksburg, VA, 24061, USA
Gambhir Lamsal, Landon Marston & Sameer Dhakal
Northern Arizona University, Flagstaff, AZ, 86011, USA
Laljeet Singh Sangha, Richard R. Rushforth & Benjamin L. Ruddell
Department of Geography and Spatial Sciences, University of Delaware, Newark, DE, 19716, USA
Dongyang Wei & Kyle Frankel Davis
Department of Plant and Soil Sciences, University of Delaware, Newark, DE, 19716, USA
Kyle Frankel Davis
Instituto de Investigaciones Oceanologicas, Universidad Autonoma de Baja California, Ensenada, Baja California, México
Astrid Hernandez-Cruz
Department of Land, Air and Water Resources, Univeristy of California at Davis, Davis, CA, 95616, USA
Samuel Sandoval-Solis
Center for Colorado River Studies, Utah State University, Logan, UT, 84322, USA
John C. Schmidt
You can also search for this author in PubMed Google Scholar
Contributions
B.D.R. designed the study, compiled and analyzed data, wrote the manuscript and supervised co-author contributions. G.L. compiled all crop data, estimated crop evapotranspiration, and prepared figures. S.D. compiled all riparian vegetation data and estimated riparian evapotranspiration. L.S.S. and R.R.R. accessed, compiled, and analyzed data from the Central Arizona Project. D.W. compiled data and prepared figures. A.H.-C. and S.S.-S. compiled and analyzed data for Mexico. J.C.S. compiled and analyzed reservoir evaporation data and edited the manuscript. L.M., B.L.R., and K.F.D. supervised data compilation and analysis and edited the manuscript.
Corresponding author
Correspondence to Brian D. Richter .
Ethics declarations
Competing interests.
The authors declare no competing interests.
Peer review
Peer review information.
Communications Earth & Environment thanks James Booker and Becky Bolinger for their contribution to the peer review of this work. Primary Handling Editors: Aliénor Lavergne and Carolina Ortiz Guerrero. A peer review file is available.
Additional information
Publisher’s note Springer Nature remains neutral with regard to jurisdictional claims in published maps and institutional affiliations.
Supplementary information
Peer review file, supplementary information, rights and permissions.
Open Access This article is licensed under a Creative Commons Attribution 4.0 International License, which permits use, sharing, adaptation, distribution and reproduction in any medium or format, as long as you give appropriate credit to the original author(s) and the source, provide a link to the Creative Commons licence, and indicate if changes were made. The images or other third party material in this article are included in the article’s Creative Commons licence, unless indicated otherwise in a credit line to the material. If material is not included in the article’s Creative Commons licence and your intended use is not permitted by statutory regulation or exceeds the permitted use, you will need to obtain permission directly from the copyright holder. To view a copy of this licence, visit http://creativecommons.org/licenses/by/4.0/ .
Reprints and permissions
About this article
Cite this article.
Richter, B.D., Lamsal, G., Marston, L. et al. New water accounting reveals why the Colorado River no longer reaches the sea. Commun Earth Environ 5 , 134 (2024). https://doi.org/10.1038/s43247-024-01291-0
Download citation
Received : 03 October 2023
Accepted : 27 February 2024
Published : 28 March 2024
DOI : https://doi.org/10.1038/s43247-024-01291-0
Share this article
Anyone you share the following link with will be able to read this content:
Sorry, a shareable link is not currently available for this article.
Provided by the Springer Nature SharedIt content-sharing initiative
By submitting a comment you agree to abide by our Terms and Community Guidelines . If you find something abusive or that does not comply with our terms or guidelines please flag it as inappropriate.
Quick links
- Explore articles by subject
- Guide to authors
- Editorial policies
Sign up for the Nature Briefing newsletter — what matters in science, free to your inbox daily.


Andean alarm: climate crisis increases fears of glacial lake flood in Peru
In 1941, thousands of people died in Huaraz when the natural dam on a lake above the city gave way. Now, melting glaciers are raising the chances of it happening again Photographs by Harriet Barber
L ake Palcacocha is high in the Cordillera Blanca range of the Peruvian Andes, sitting above the city of Huaraz at an altitude of about 4,500 metres. When the lake broke through the extensive moraines, or natural dams, holding it in place on 13 December 1941, it sent nearly 10m cubic metres of water and debris into the narrow valley towards the city, 1,500 metres below.
The result was one of the most devastating glacial lake outburst floods – or “GLOFs” – ever recorded. The force of the water altered the area’s geography for ever, and killed at least 1,800 people, and possibly as many as 5,000 .
Like all such lakes, Palcacocha was formed as a glacier receded, the water filling up the hollowed-out land around it. This process – and the floods that can result – is natural but now, scientists say, the climate crisis is increasing the risk it poses.

Peru’s Cordillera Blanca, the eastern backdrop to Huaraz, has the world’s highest concentration of tropical glaciers. While the Himalayas are considered to pose more significant risks of floods, the large population of Huaraz makes the threat to life in this region far greater.
When disaster struck in 1941, Huaraz had a population of 12,000; it is now a thriving city of 120,000 people. “It’s one of the world’s only examples of a major city sitting right beneath a potential risk of a glacial lake flood,” says Neil Glasser, a geography professor at Aberystwyth University. “That makes Huaraz stand out.”
Memories of the 1941 disaster are still passed down through the generations, and those living on the flood path are acutely aware of the risks.
Olga Rosales-Jamanca, 39, lives in the community of Yarush – about six miles east of Huaraz in the valley leading to Palcacocha. Her grandfather told her stories of how he and his wife fled to higher ground during the 1941 flood.
Her father Alejandro, now 69, can also recall its effects. “Before the flood, all of this area was flat with food for animals,” he says. “But after, everything had changed.”

Olga and Alejandro were born in the farmhouse in which they still live, alongside Alejandro’s wife and Olga’s three children, aged one, 15 and 20. She is painfully aware of how devastating a flood could be to her family.
“It would cause a lot of damage to our properties. It would damage all of my efforts here on the farm. It’s a huge risk,” she says, cradling her youngest daughter, Luz.
“I’ve lived here all my life; I feel like this land is my mother,” she says. “My feelings and all my living experience are involved with this land.”
Down the valley, the densely populated district of Nuevo Florida would be the first part of Huaraz to be hit by a flood. Saúl Luciano Lliuya, a 43-year-old farmer and mountain guide, fears what could happen.
Luciano Lliuya has seen the glaciers and landscape shift due to the climate crisis. “The problem is unpredictable, so I don’t know where my family and I would be if it happened,” he says.
“The older guides told me about the mountains and how they are changing. As a farmer and a guide, I have noticed profound changes.”

For the past nine years, Luciano Lliuya has also been embroiled in a landmark legal case , supported by the development organisation Germanwatch , against the German energy company RWE over its alleged role in contributing to the climate crisis, increasing the risk to his home.
The case, which began in 2015, concerns whether RWE should contribute to mitigation measures. It could set a huge precedent for making polluters pay.
German judges visited Huaraz and the lake in May 2022. The next stage is an oral hearing to get expert opinions on flood risks this year.
RWE says the claim has “no legal basis” and “individual emitters are not liable for universally rooted processes”, such as the climate crisis. Whatever the outcome of the case, Luciano Lliuya hopes at least that it will raise awareness of the issue among authorities in Peru and abroad.
GLOFs can happen in two ways. Glacial lakes form behind moraines – natural dams formed by an accumulation of rock and soil left behind by a moving glacier. As glaciers melt, the water level can gradually increase and create greater pressure on the moraines, causing them to give way. Or an avalanche or earthquake could create a shift in the water level and cause it to tip over the moraine, flooding the area below.
A study published last year in Nature Communications suggested GLOFs threaten 15 million people globally. Last October a GLOF killed 92 people in Sikkim , a north-eastern Indian state bordering Nepal, Bhutan and Tibet.

While the exact cause of the 1941 Huaraz GLOF is unclear, scientists’ understanding of the phenomenon has grown in recent decades.
Ryan Wilson , an expert at Huddersfield University who analysed the lakes for the Peruvian government, says: “We now have a combination of satellite-based analysis, which then informs field-based analysis. Once you whittle it down to a collection of ‘interesting’ lakes, you can monitor them continuously using a satellite, which is something we couldn’t do before.”
Scientists warn that the climate crisis is having a serious impact on GLOFs. “If you look at the vast majority of scientific studies, they’re showing an overwhelming thinning of glaciers globally,” Wilson says. “That’s particularly the case in the Andes and Peru.”

Glasser adds: “It’s undeniable: 99% of the world’s glaciers are receding. I think that’s inevitably a consequence of climate change.”
Wilson says people living downstream of such lakes need to be aware of the dangers. “We’ve got a situation where more lakes have expanded and appeared,” he says. “The key thing is education and making people understand.
“These are very high-magnitude floods that can be suddenly triggered. They can travel kilometres within 20 or 30 minutes, and it’s not much time to react.”
W hile the Peruvian authorities are aware of the risks and have taken steps to mitigate them, local people say more could be done. “A few years ago, the authorities did something to strengthen the lake’s structure, but this year, nothing,” says Rosales-Jamanca.
Inés Yanac, director of the local environmental organisation Wayintsik Perú “our house” in Quechua), says: “People are very worried about the risks of another flood. They are worried about a lack of water if there were a flood and about making the lake much more secure. The water is a vital resource for their animals and crops.”
She adds: “The authorities must solve this problem. There is some alarm system, but it has never been tested.”
Juan Torres Lázaro, of Inaigem, Peru’s glaciology institute, says the system had been tested but had “serious protocol deficiencies”. The regional government was approached for comment but has not replied.
Victor Morales-Moreno, 58, has been monitoring water levels at the lake every two hours for the past nine years. He is critical of how the issue is being managed, saying drainage pipes installed to lower the lake’s level are old and brittle, breaking at the first sign of tension.
Nevertheless, he is more sanguine about the risk. “I’m not worried about another flood because things are under control,” he says.
When an avalanche hit Palcacocha in January , the impact caused a 3-metre-high wave to surge across the lake. Thankfully, it did not cause a GLOF, but Morales-Moreno says all 10 pipes were broken and needed to be replaced. “The pipes are old, and with these high temperatures, they get very dry – they need to be changed.”
Torres Lázaro is now assessing the risk from lakes but it is slow work. Four were completed last year, and another four are scheduled for 2024.
“In 2022, things were calm. But last year and this year, we had two avalanches, which has increased the government’s interest,” he says. “Now, according to the limits, it is considered a risk.”
- Southern frontlines: Latin America and the Caribbean
- Climate crisis
- Greenhouse gas emissions
Most viewed
- 0 Shopping Cart
Geography Case Studies
All of our geography case studies in one place
Coastal Erosion
Use the images below to find out more about each case study.
The Holderness Coast

The Dorset Coast
Happisburgh
Coastal Management
Sandscaping at Bacton, Norfolk
Coastal Realignment Donna Nook
Coastal Realignment Medmerry
Coastal Deposition
Spurn Point
Blakeney Point Spit
Earthquakes
Amatrice Earthquake Case Study
Chile Earthquake 2010
Christchurch Earthquake
Haiti Earthquake
Japan Earthquake 2011
L’Aquila Earthquake
Lombok Indonesia Earthquake 2018
Nepal Earthquake 2015
Sulawesi, Indonesia Earthquake and Tsunami 2018
New Zealand 2016
Malaysia Causes of Deforestation
Malaysia Impacts of Deforestation
Alaska Case Study
Epping Forest Case Study
Sahara Desert Case Study
Svalbard Case Study
Thar Desert Case Study
Western Desert Case Study
Energy Resources
Chambamontera Micro-hydro Scheme
Extreme Weather in the UK
Beast from the East Case Study
Storm Ciera Case Study
Food Resources
Almería, Spain: a large-scale agricultural development
The Indus Basin Irrigation System: a large-scale agricultural development
Sustainable food supplies in a LIC – Bangladesh
Sustainable food supplies in a LIC – Makueni, Kenya
Landforms on the River Tees
Landforms on the River Severn
Indus River Basin (CIE)
River Flooding
Jubilee River Flood Management Scheme
Banbury Flood Management Scheme
Boscastle Floods
Kerala Flood 2018
Wainfleet Floods 2019
The Somerset Levels Flood Case Study
UK Floods Case Study November 2019
River Management
The Three Gorges Dam
Mekong River
The Changing Economic World
How can the growth of tourism reduce the development gap? Jamaica Case Study
How can the growth of tourism reduce the development gap? Tunisia Case Study
India Case Study of Development
Nigeria – A NEE
Torr Quarry
Nissan Sunderland
The London Sustainable Industries Park (London SIP)
Tropical Storms
Beast from the East
Hurricane Andrew
Cyclone Eline
Cyclone Idai Case Study
Typhoon Haiyan 2013
Hurricane Irma 2017
Typhoon Jebi 2018
Hurricane Florence 2018
Typhoon Mangkhut 2018
Urban Issues
Birmingham – Edexcel B
Urban Growth in Brazil – Rio de Janeiro
Urban Growth in India – Mumbai
Urban Growth in Nigeria – Lagos
London – A Case Study of a UK City
Inner City Redevelopment – London Docklands
Sustainable Urban Living – Freiburg
Sustainable Urban Living – East Village
Sustainable Urban Transport Bristol Case Study
Bristol – A major UK city
Volcanic Eruptions
Eyjafjallajokull – 2010
Mount Merapi – 2010
Mount Pinatubo – 1991
Sakurajima Case Study
Nyiragongo Case Study
Water Resources
Hitosa, Ethiopia – A local water supply scheme in an LIC
The South-North Water Transfer Project, China
Wakal River Basin Project
Lesotho Large-Scale Water Transfer Scheme
Share this:
- Click to share on Twitter (Opens in new window)
- Click to share on Facebook (Opens in new window)
- Click to share on Pinterest (Opens in new window)
- Click to email a link to a friend (Opens in new window)
- Click to share on WhatsApp (Opens in new window)
- Click to print (Opens in new window)
Please Support Internet Geography
If you've found the resources on this site useful please consider making a secure donation via PayPal to support the development of the site. The site is self-funded and your support is really appreciated.
Search Internet Geography
Top posts and pages.
Latest Blog Entries
Pin It on Pinterest
- Click to share
- Print Friendly
The largest country in the world at 17,075,400 square kilometres (or 6,592,800 sq mi), Russia has accumulated quite an impressive reputation. Covering more than an eight of the Earth's land area, 142 million people live there making it the ninth largest nation by population . Still known for its impressive days as the expansive Union of Soviet Socialist Republics (USSR), Russia was the world's first and largest constitutionally socialist state. A recognized superpower, the USSR was known for its excellence in both arts and science winning many awards in both fields.
Russia changed drastically after the dissolution of the Soviet Union in 1991, but it continues to be a powerful and important nation. It has one of the world's fastest growing economies and the world's eight largest GDP by nominal GDP. Russia is also one of the five countries which officially recognized nuclear weapons states. In conjunction with this title, Russia is also a permanent member of the United Nations Security Council, the G8, APEC and the SCO, and is a leading member of the Commonwealth of Independent States.
A European city in a country that lies over a vast part of Asia, Moscow holds one-tenth of all Russian residents . The city is located in the western region of Russia and is the capital and epicentre of political, economic, cultural, religious, financial, educational, and transportation happenings. "Muscovites" , as residents are known, tend to be cultured and worldly. This may be due to the many scientific, educational, and artistic institutions that are based here. An intoxicating mix of the exotic and the familiar, it is the largest city in Europe with the Moscow metropolitan area ranking among the largest urban areas in the world.
The city is situated on the banks of the Moskva River which flows through much of central Russia. Moscow is actually located in a basin for the Volga, Oka, Klyazma, and Moscow rivers. The city of Moscow is 994 sq. km with 49 bridges spanning the rivers and canals that criss-cross the city.
Forests are another part of Moscow's make-up. They coveer over a third of the territory in the region. A variety of animals like elk, wild boar, deer, foxes, weasels, lynx, martens, and birds make their home here.
Located in the UTC+3 time zone , Moscow has a humid continental climate. The summers tend to be warm and humid and the winters are long, cold, and hard. High temperatures occur during the warm months of June, July and August at about 23 °C (73 °F). Heat waves sometimes grip the city anywhere between May to September with temperatures spiking up to 30 °C (86 °F). Winters are harshly chilly with temperatures dropping to approximately 9 °C (15.8 °F). There is consistent snow cover for 3 to 5 months a year, usually from November to March.
Update 10/07/2009
Recommended Partners
Keep more of your money when transferring funds overseas.
If you want to move money abroad, from Russia or to Russia for example, Fexco provides efficient and secure global bank to bank transfers and bespoke payment solutions for both business and personal clients.
Fexco provides a secure international money transfer service online or by telephone with bank beating fx rates and low fees. Specialises in high-value transfers.
Main characteristics
Fexco will help you to keep your overseas money transfer costs to a minimum.
Get an online quote today
When you are ready to make your transfer, John and his team will be available to help you with better rates and an unrivalled service to make sure your funds are delivered securely and speedily.
- What courses for adults can you find abroad?
- How should I tip in restaurants in Europe?
- Schengen Area: Do I need a visa?
- Where is it safe to live/travel as a homosexual?
- What are the most expensive cities to live in?
Download the full digital PDF expat guide in Moscow

- See in one single booklet all the articles for a city guide for expatriates.
- Enjoy full colour photos to illustrate each section.
- Additionnal maps: Region, City view, Neighborhood, Street view.
- Moscow: Looking for a Job in Moscow
- Moscow: EasyExpat.com is looking for networkers/helpers for...
- Moscow: EasyExpat.com recherche des animateurs pour notre...
- Moscow: New à Moscou
- Moscow: Weekend in Moscow: what to do?
- Forums : Moscow
- Find more expat blogs with BlogExpat
- Classifieds in Moscow
- Post a free ad
- Find a job in Moscow
- My Life Abroad - A selection of expat stories
"A fun compulsive read!" J. Matcham, Amazon
"I strongly advise people ready to live abroad to read this book!" Patrice, Amazon
- Advertising
- Privacy Policy
Stay connected
Expat Network

Turn Your Curiosity Into Discovery
Latest facts.

Tips and Tricks to Help You Create a HIPAA Compliant Email

How to Stop Facial Hair Growth in Females Naturally
40 facts about elektrostal.
Written by Lanette Mayes
Modified & Updated: 02 Mar 2024
Reviewed by Jessica Corbett

Elektrostal is a vibrant city located in the Moscow Oblast region of Russia. With a rich history, stunning architecture, and a thriving community, Elektrostal is a city that has much to offer. Whether you are a history buff, nature enthusiast, or simply curious about different cultures, Elektrostal is sure to captivate you.
This article will provide you with 40 fascinating facts about Elektrostal, giving you a better understanding of why this city is worth exploring. From its origins as an industrial hub to its modern-day charm, we will delve into the various aspects that make Elektrostal a unique and must-visit destination.
So, join us as we uncover the hidden treasures of Elektrostal and discover what makes this city a true gem in the heart of Russia.
Key Takeaways:
- Elektrostal, known as the “Motor City of Russia,” is a vibrant and growing city with a rich industrial history, offering diverse cultural experiences and a strong commitment to environmental sustainability.
- With its convenient location near Moscow, Elektrostal provides a picturesque landscape, vibrant nightlife, and a range of recreational activities, making it an ideal destination for residents and visitors alike.
Known as the “Motor City of Russia.”
Elektrostal, a city located in the Moscow Oblast region of Russia, earned the nickname “Motor City” due to its significant involvement in the automotive industry.
Home to the Elektrostal Metallurgical Plant.
Elektrostal is renowned for its metallurgical plant, which has been producing high-quality steel and alloys since its establishment in 1916.
Boasts a rich industrial heritage.
Elektrostal has a long history of industrial development, contributing to the growth and progress of the region.
Founded in 1916.
The city of Elektrostal was founded in 1916 as a result of the construction of the Elektrostal Metallurgical Plant.
Located approximately 50 kilometers east of Moscow.
Elektrostal is situated in close proximity to the Russian capital, making it easily accessible for both residents and visitors.
Known for its vibrant cultural scene.
Elektrostal is home to several cultural institutions, including museums, theaters, and art galleries that showcase the city’s rich artistic heritage.
A popular destination for nature lovers.
Surrounded by picturesque landscapes and forests, Elektrostal offers ample opportunities for outdoor activities such as hiking, camping, and birdwatching.
Hosts the annual Elektrostal City Day celebrations.
Every year, Elektrostal organizes festive events and activities to celebrate its founding, bringing together residents and visitors in a spirit of unity and joy.
Has a population of approximately 160,000 people.
Elektrostal is home to a diverse and vibrant community of around 160,000 residents, contributing to its dynamic atmosphere.
Boasts excellent education facilities.
The city is known for its well-established educational institutions, providing quality education to students of all ages.
A center for scientific research and innovation.
Elektrostal serves as an important hub for scientific research, particularly in the fields of metallurgy, materials science, and engineering.
Surrounded by picturesque lakes.
The city is blessed with numerous beautiful lakes, offering scenic views and recreational opportunities for locals and visitors alike.
Well-connected transportation system.
Elektrostal benefits from an efficient transportation network, including highways, railways, and public transportation options, ensuring convenient travel within and beyond the city.
Famous for its traditional Russian cuisine.
Food enthusiasts can indulge in authentic Russian dishes at numerous restaurants and cafes scattered throughout Elektrostal.
Home to notable architectural landmarks.
Elektrostal boasts impressive architecture, including the Church of the Transfiguration of the Lord and the Elektrostal Palace of Culture.
Offers a wide range of recreational facilities.
Residents and visitors can enjoy various recreational activities, such as sports complexes, swimming pools, and fitness centers, enhancing the overall quality of life.
Provides a high standard of healthcare.
Elektrostal is equipped with modern medical facilities, ensuring residents have access to quality healthcare services.
Home to the Elektrostal History Museum.
The Elektrostal History Museum showcases the city’s fascinating past through exhibitions and displays.
A hub for sports enthusiasts.
Elektrostal is passionate about sports, with numerous stadiums, arenas, and sports clubs offering opportunities for athletes and spectators.
Celebrates diverse cultural festivals.
Throughout the year, Elektrostal hosts a variety of cultural festivals, celebrating different ethnicities, traditions, and art forms.
Electric power played a significant role in its early development.
Elektrostal owes its name and initial growth to the establishment of electric power stations and the utilization of electricity in the industrial sector.
Boasts a thriving economy.
The city’s strong industrial base, coupled with its strategic location near Moscow, has contributed to Elektrostal’s prosperous economic status.
Houses the Elektrostal Drama Theater.
The Elektrostal Drama Theater is a cultural centerpiece, attracting theater enthusiasts from far and wide.
Popular destination for winter sports.
Elektrostal’s proximity to ski resorts and winter sport facilities makes it a favorite destination for skiing, snowboarding, and other winter activities.
Promotes environmental sustainability.
Elektrostal prioritizes environmental protection and sustainability, implementing initiatives to reduce pollution and preserve natural resources.
Home to renowned educational institutions.
Elektrostal is known for its prestigious schools and universities, offering a wide range of academic programs to students.
Committed to cultural preservation.
The city values its cultural heritage and takes active steps to preserve and promote traditional customs, crafts, and arts.
Hosts an annual International Film Festival.
The Elektrostal International Film Festival attracts filmmakers and cinema enthusiasts from around the world, showcasing a diverse range of films.
Encourages entrepreneurship and innovation.
Elektrostal supports aspiring entrepreneurs and fosters a culture of innovation, providing opportunities for startups and business development.
Offers a range of housing options.
Elektrostal provides diverse housing options, including apartments, houses, and residential complexes, catering to different lifestyles and budgets.
Home to notable sports teams.
Elektrostal is proud of its sports legacy, with several successful sports teams competing at regional and national levels.
Boasts a vibrant nightlife scene.
Residents and visitors can enjoy a lively nightlife in Elektrostal, with numerous bars, clubs, and entertainment venues.
Promotes cultural exchange and international relations.
Elektrostal actively engages in international partnerships, cultural exchanges, and diplomatic collaborations to foster global connections.
Surrounded by beautiful nature reserves.
Nearby nature reserves, such as the Barybino Forest and Luchinskoye Lake, offer opportunities for nature enthusiasts to explore and appreciate the region’s biodiversity.
Commemorates historical events.
The city pays tribute to significant historical events through memorials, monuments, and exhibitions, ensuring the preservation of collective memory.
Promotes sports and youth development.
Elektrostal invests in sports infrastructure and programs to encourage youth participation, health, and physical fitness.
Hosts annual cultural and artistic festivals.
Throughout the year, Elektrostal celebrates its cultural diversity through festivals dedicated to music, dance, art, and theater.
Provides a picturesque landscape for photography enthusiasts.
The city’s scenic beauty, architectural landmarks, and natural surroundings make it a paradise for photographers.
Connects to Moscow via a direct train line.
The convenient train connection between Elektrostal and Moscow makes commuting between the two cities effortless.
A city with a bright future.
Elektrostal continues to grow and develop, aiming to become a model city in terms of infrastructure, sustainability, and quality of life for its residents.
In conclusion, Elektrostal is a fascinating city with a rich history and a vibrant present. From its origins as a center of steel production to its modern-day status as a hub for education and industry, Elektrostal has plenty to offer both residents and visitors. With its beautiful parks, cultural attractions, and proximity to Moscow, there is no shortage of things to see and do in this dynamic city. Whether you’re interested in exploring its historical landmarks, enjoying outdoor activities, or immersing yourself in the local culture, Elektrostal has something for everyone. So, next time you find yourself in the Moscow region, don’t miss the opportunity to discover the hidden gems of Elektrostal.
Q: What is the population of Elektrostal?
A: As of the latest data, the population of Elektrostal is approximately XXXX.
Q: How far is Elektrostal from Moscow?
A: Elektrostal is located approximately XX kilometers away from Moscow.
Q: Are there any famous landmarks in Elektrostal?
A: Yes, Elektrostal is home to several notable landmarks, including XXXX and XXXX.
Q: What industries are prominent in Elektrostal?
A: Elektrostal is known for its steel production industry and is also a center for engineering and manufacturing.
Q: Are there any universities or educational institutions in Elektrostal?
A: Yes, Elektrostal is home to XXXX University and several other educational institutions.
Q: What are some popular outdoor activities in Elektrostal?
A: Elektrostal offers several outdoor activities, such as hiking, cycling, and picnicking in its beautiful parks.
Q: Is Elektrostal well-connected in terms of transportation?
A: Yes, Elektrostal has good transportation links, including trains and buses, making it easily accessible from nearby cities.
Q: Are there any annual events or festivals in Elektrostal?
A: Yes, Elektrostal hosts various events and festivals throughout the year, including XXXX and XXXX.
Was this page helpful?
Our commitment to delivering trustworthy and engaging content is at the heart of what we do. Each fact on our site is contributed by real users like you, bringing a wealth of diverse insights and information. To ensure the highest standards of accuracy and reliability, our dedicated editors meticulously review each submission. This process guarantees that the facts we share are not only fascinating but also credible. Trust in our commitment to quality and authenticity as you explore and learn with us.
Share this Fact:
IMAGES
VIDEO
COMMENTS
Case study - the Lake District, England Helvellyn stands is one of England's highest mountain, standing at 949 metres above sea level in the Lake District in north-west England.
Lake District Case Study. Lake District Case Study. The Lake District National Park is located in Cumbria in Northwest England. It is renowned for its lakes, forests, mountains, glacial features, and famous figures such as Beatrix Potter. The park covers 912 sq. mi/2,362 km 2 and was named a UNESCO World Heritage Site in 2017.
Lake District Case study. The Lake District National Park is England's largest park and includes Scafell Pike - its highest mountain, Wastwater - its deepest lake and thriving communities like Keswick and Bowness-on-Windermere. There are 42,400 permanent residents and a huge amount of activities for visitors on offer, including walking ...
Lake District Case Study. The Lake District case study focuses on the management of a popular national park in northwest England. It examines the environmental, social, and economic impacts of tourism and outdoor recreation on the area. The case study also explores strategies for sustainable development and conservation within the region.
In 2017, tourists spent £1.4bn in the Lake District. In 2017, 19.1 million people visited the Lake District. In 2017, 18,565 jobs were created by tourism in the Lake District. Lots of people are buying holiday homes in towns like Ambleside in the Lake District. The property prices are so high that many locals are being forced away.
Historical and Cultural. The Lake District has been occupied since the end of the ice age 10,000 years ago, and evidence of early settlement remains. The land has been farmed for centuries, leaving a distinctive field pattern with drystone walls. Many 19th Century writers and artists, such as John Ruskin, loved the area.
The Lake District National Park in Cumbria, North West England, is a scenic region known for its lakes, mountains and forests, along with features created by glaciers. It was named a UNESCO World Heritage Site in 2017 and holds keys to understanding England's geological history. In this case study, we'll explore the glacial formations found ...
The Lake District is famous for its ribbon lakes and mountains. The region contains numerous examples of corries, tarns and arêtes. The mountain Helvellyn is home to several glacial landforms. The first is Striding Edge, the narrow knife-edged ridge or arête. Striding Edge, an arete in the Lake District. The second is Red Tarn, a lake formed ...
Lake District Case Study: Management Strategies. GCSE Geography Physical Landscapes in the UK Lake District Case Study: Management Strategies. The Lake District is a major tourist attraction in the UK, visited by more than 16 million tourists every year. This is due to its natural beauty, lakes, hills and activities.
The English Lake District has a long-standing reputation for being a classic or textbook example of both a glaciated terrain, specifically an exemplar for alpine style glacial topography with cirques, hanging valleys, aretes, U-shaped valleys and trough heads (Figs. 27.1 and 27.2; Hollingworth 1951; Monkhouse 1960; Pearsall and Pennington 1973; Evans and Cox 1995; Boardman 1996) as well as a ...
A rebranding case study. The Lake District, together with the rest of Cumbria, is seeking to become the Adventure Capital of the UK by 2018. This article looks at the changes taking place, the impacts and the challenges involved. It is a useful case study of rural rebranding or managing rural change. Geography Review.
What is the local household income? £27 000. What percentage of properties are holiday homes? 16%. What percentage of the Lake District's economy comes from tourism? over 50%. Because of the park and ride system in the Lake District, how many fewer miles have been done? 48 million. Study with Quizlet and memorize flashcards containing terms ...
These people can pay more than the locals, so prices rise. 2,292km squared. Area of Lake District National park. 41,400. Population of Lake District. 16.1 million. Number of tourists that visit the Lake District every year. £1.146 billion. Money spent by tourists in the Lake District every year.
In fact, the river was overconsumed (i.e., total annual water consumption exceeding runoff supplies) in 16 of 21 years during 2000-2020 3, requiring large withdrawals of water stored in Lake ...
L ake Palcacocha is high in the Cordillera Blanca range of the Peruvian Andes, sitting above the city of Huaraz at an altitude of about 4,500 metres. When the lake broke through the extensive ...
The Lake District in northwest England became a National Park in 1951. The Lake District is renowned for its mountains, hills (fells) and lakes. Glaciers carved the mountains during the last Ice Age, creating broad valleys and jagged peaks. Current surveys show that 15.8 million visitors come to the Lake District annually.
Noginsk, city, Moscow oblast (region), western Russia, on the Klyazma River east of Moscow. Originally Yamskaya village, it became the town of Bogorodsk in 1781 and was renamed Noginsk in 1930. It is one of the largest Russian textile centres; cotton forms most of its production. Pop. (2006 est.) 116,277. This article was most recently revised ...
In National 4 Geography study the formation of glaciated upland landscape features and the impact they have on land uses and land use conflict. ... Case study - the Lake District; Land use ...
Elektrostal, city, Moscow oblast (province), western Russia.It lies 36 miles (58 km) east of Moscow city. The name, meaning "electric steel," derives from the high-quality-steel industry established there soon after the October Revolution in 1917. During World War II, parts of the heavy-machine-building industry were relocated there from Ukraine, and Elektrostal is now a centre for the ...
Geography Case Studies - A wide selection of geography case studies to support you with GCSE Geography revision, homework and research. Twitter; Facebook; Youtube; 0 Shopping Cart ... Glacial landforms in the Lake District; Economic activities in glaciated upland areas; Glaciation Photo gallery - Goat Fell, Isle of Arran;
The city is situated on the banks of the Moskva River which flows through much of central Russia. Moscow is actually located in a basin for the Volga, Oka, Klyazma, and Moscow rivers. The city of Moscow is 994 sq. km with 49 bridges spanning the rivers and canals that criss-cross the city. Forests are another part of Moscow's make-up.
40 Facts About Elektrostal. Elektrostal is a vibrant city located in the Moscow Oblast region of Russia. With a rich history, stunning architecture, and a thriving community, Elektrostal is a city that has much to offer. Whether you are a history buff, nature enthusiast, or simply curious about different cultures, Elektrostal is sure to ...