
Comparative Research

Although not everyone would agree, comparing is not always bad. Comparing things can also give you a handful of benefits. For instance, there are times in our life where we feel lost. You may not be getting the job that you want or have the sexy body that you have been aiming for a long time now. Then, you happen to cross path with an old friend of yours, who happened to get the job that you always wanted. This scenario may put your self-esteem down, knowing that this friend got what you want, while you didn’t. Or you can choose to look at your friend as an example that your desire is actually attainable. Come up with a plan to achieve your personal development goal . Perhaps, ask for tips from this person or from the people who inspire you. According to the article posted in brit.co , licensed master social worker and therapist Kimberly Hershenson said that comparing yourself to someone successful can be an excellent self-motivation to work on your goals.
Aside from self-improvement, as a researcher, you should know that comparison is an essential method in scientific studies, such as experimental research and descriptive research . Through this method, you can uncover the relationship between two or more variables of your project in the form of comparative analysis .
What is Comparative Research?
Aiming to compare two or more variables of an experiment project, experts usually apply comparative research examples in social sciences to compare countries and cultures across a particular area or the entire world. Despite its proven effectiveness, you should keep it in mind that some states have different disciplines in sharing data. Thus, it would help if you consider the affecting factors in gathering specific information.
Quantitative and Qualitative Research Methods in Comparative Studies
In comparing variables, the statistical and mathematical data collection, and analysis that quantitative research methodology naturally uses to uncover the correlational connection of the variables, can be essential. Additionally, since quantitative research requires a specific research question, this method can help you can quickly come up with one particular comparative research question.
The goal of comparative research is drawing a solution out of the similarities and differences between the focused variables. Through non-experimental or qualitative research , you can include this type of research method in your comparative research design.
13+ Comparative Research Examples
Know more about comparative research by going over the following examples. You can download these zipped documents in PDF and MS Word formats.
1. Comparative Research Report Template

- Google Docs
Size: 113 KB
2. Business Comparative Research Template

Size: 69 KB
3. Comparative Market Research Template

Size: 172 KB
4. Comparative Research Strategies Example

5. Comparative Research in Anthropology Example

Size: 192 KB
6. Sample Comparative Research Example

Size: 516 KB
7. Comparative Area Research Example

8. Comparative Research on Women’s Emplyment Example

Size: 290 KB
9. Basic Comparative Research Example

Size: 19 KB
10. Comparative Research in Medical Treatments Example

11. Comparative Research in Education Example

Size: 455 KB
12. Formal Comparative Research Example

Size: 244 KB
13. Comparative Research Designs Example

Size: 259 KB
14. Casual Comparative Research in DOC

Best Practices in Writing an Essay for Comparative Research in Visual Arts
If you are going to write an essay for a comparative research examples paper, this section is for you. You must know that there are inevitable mistakes that students do in essay writing . To avoid those mistakes, follow the following pointers.
1. Compare the Artworks Not the Artists
One of the mistakes that students do when writing a comparative essay is comparing the artists instead of artworks. Unless your instructor asked you to write a biographical essay, focus your writing on the works of the artists that you choose.
2. Consult to Your Instructor
There is broad coverage of information that you can find on the internet for your project. Some students, however, prefer choosing the images randomly. In doing so, you may not create a successful comparative study. Therefore, we recommend you to discuss your selections with your teacher.
3. Avoid Redundancy
It is common for the students to repeat the ideas that they have listed in the comparison part. Keep it in mind that the spaces for this activity have limitations. Thus, it is crucial to reserve each space for more thoroughly debated ideas.
4. Be Minimal
Unless instructed, it would be practical if you only include a few items(artworks). In this way, you can focus on developing well-argued information for your study.
5. Master the Assessment Method and the Goals of the Project
We get it. You are doing this project because your instructor told you so. However, you can make your study more valuable by understanding the goals of doing the project. Know how you can apply this new learning. You should also know the criteria that your teachers use to assess your output. It will give you a chance to maximize the grade that you can get from this project.
Comparing things is one way to know what to improve in various aspects. Whether you are aiming to attain a personal goal or attempting to find a solution to a certain task, you can accomplish it by knowing how to conduct a comparative study. Use this content as a tool to expand your knowledge about this research methodology .

AI Generator
Text prompt
- Instructive
- Professional
10 Examples of Public speaking
20 Examples of Gas lighting

On Evaluating Curricular Effectiveness: Judging the Quality of K-12 Mathematics Evaluations (2004)
Chapter: 5 comparative studies, 5 comparative studies.
It is deceptively simple to imagine that a curriculum’s effectiveness could be easily determined by a single well-designed study. Such a study would randomly assign students to two treatment groups, one using the experimental materials and the other using a widely established comparative program. The students would be taught the entire curriculum, and a test administered at the end of instruction would provide unequivocal results that would permit one to identify the more effective treatment.
The truth is that conducting definitive comparative studies is not simple, and many factors make such an approach difficult. Student placement and curricular choice are decisions that involve multiple groups of decision makers, accrue over time, and are subject to day-to-day conditions of instability, including student mobility, parent preference, teacher assignment, administrator and school board decisions, and the impact of standardized testing. This complex set of institutional policies, school contexts, and individual personalities makes comparative studies, even quasi-experimental approaches, challenging, and thus demands an honest and feasible assessment of what can be expected of evaluation studies (Usiskin, 1997; Kilpatrick, 2002; Schoenfeld, 2002; Shafer, in press).
Comparative evaluation study is an evolving methodology, and our purpose in conducting this review was to evaluate and learn from the efforts undertaken so far and advise on future efforts. We stipulated the use of comparative studies as follows:
A comparative study was defined as a study in which two (or more) curricular treatments were investigated over a substantial period of time (at least one semester, and more typically an entire school year) and a comparison of various curricular outcomes was examined using statistical tests. A statistical test was required to ensure the robustness of the results relative to the study’s design.
We read and reviewed a set of 95 comparative studies. In this report we describe that database, analyze its results, and draw conclusions about the quality of the evaluation database both as a whole and separated into evaluations supported by the National Science Foundation and commercially generated evaluations. In addition to describing and analyzing this database, we also provide advice to those who might wish to fund or conduct future comparative evaluations of mathematics curricular effectiveness. We have concluded that the process of conducting such evaluations is in its adolescence and could benefit from careful synthesis and advice in order to increase its rigor, feasibility, and credibility. In addition, we took an interdisciplinary approach to the task, noting that various committee members brought different expertise and priorities to the consideration of what constitutes the most essential qualities of rigorous and valid experimental or quasi-experimental design in evaluation. This interdisciplinary approach has led to some interesting observations and innovations in our methodology of evaluation study review.
This chapter is organized as follows:
Study counts disaggregated by program and program type.
Seven critical decision points and identification of at least minimally methodologically adequate studies.
Definition and illustration of each decision point.
A summary of results by student achievement in relation to program types (NSF-supported, University of Chicago School Mathematics Project (UCSMP), and commercially generated) in relation to their reported outcome measures.
A list of alternative hypotheses on effectiveness.
Filters based on the critical decision points.
An analysis of results by subpopulations.
An analysis of results by content strand.
An analysis of interactions among content, equity, and grade levels.
Discussion and summary statements.
In this report, we describe our methodology for review and synthesis so that others might scrutinize our approach and offer criticism on the basis of
our methodology and its connection to the results stated and conclusions drawn. In the spirit of scientific, fair, and open investigation, we welcome others to undertake similar or contrasting approaches and compare and discuss the results. Our work was limited by the short timeline set by the funding agencies resulting from the urgency of the task. Although we made multiple efforts to collect comparative studies, we apologize to any curriculum evaluators if comparative studies were unintentionally omitted from our database.
Of these 95 comparative studies, 65 were studies of NSF-supported curricula, 27 were studies of commercially generated materials, and 3 included two curricula each from one of these two categories. To avoid the problem of double coding, two studies, White et al. (1995) and Zahrt (2001), were coded within studies of NSF-supported curricula because more of the classes studied used the NSF-supported curriculum. These studies were not used in later analyses because they did not meet the requirements for the at least minimally methodologically adequate studies, as described below. The other, Peters (1992), compared two commercially generated curricula, and was coded in that category under the primary program of focus. Therefore, of the 95 comparative studies, 67 studies were coded as NSF-supported curricula and 28 were coded as commercially generated materials.
The 11 evaluation studies of the UCSMP secondary program that we reviewed, not including White et al. and Zahrt as previously mentioned, benefit from the maturity of the program, while demonstrating an orientation to both establishing effectiveness and improving a product line. For these reasons, at times we will present the summary of UCSMP’s data separately.
The Saxon materials also present a somewhat different profile from the other commercially generated materials because many of the evaluations of these materials were conducted in the 1980s and the materials were originally developed with a rather atypical program theory. Saxon (1981) designed its algebra materials to combine distributed practice with incremental development. We selected the Saxon materials as a middle grades commercially generated program, and limited its review to middle school studies from 1989 onward when the first National Council of Teachers of Mathematics (NCTM) Standards (NCTM, 1989) were released. This eliminated concerns that the materials or the conditions of educational practice have been altered during the intervening time period. The Saxon materials explicitly do not draw from the NCTM Standards nor did they receive support from the NSF; thus they truly represent a commercial venture. As a result, we categorized the Saxon studies within the group of studies of commercial materials.
At times in this report, we describe characteristics of the database by
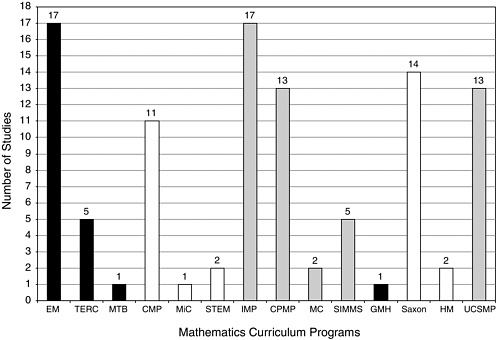
FIGURE 5-1 The distribution of comparative studies across programs. Programs are coded by grade band: black bars = elementary, white bars = middle grades, and gray bars = secondary. In this figure, there are six studies that involved two programs and one study that involved three programs.
NOTE: Five programs (MathScape, MMAP, MMOW/ARISE, Addison-Wesley, and Harcourt) are not shown above since no comparative studies were reviewed.
particular curricular program evaluations, in which case all 19 programs are listed separately. At other times, when we seek to inform ourselves on policy-related issues of funding and evaluating curricular materials, we use the NSF-supported, commercially generated, and UCSMP distinctions. We remind the reader of the artificial aspects of this distinction because at the present time, 18 of the 19 curricula are published commercially. In order to track the question of historical inception and policy implications, a distinction is drawn between the three categories. Figure 5-1 shows the distribution of comparative studies across the 14 programs.
The first result the committee wishes to report is the uneven distribution of studies across the curricula programs. There were 67 coded studies of the NSF curricula, 11 studies of UCSMP, and 17 studies of the commercial publishers. The 14 evaluation studies conducted on the Saxon materials compose the bulk of these 17-non-UCSMP and non-NSF-supported curricular evaluation studies. As these results suggest, we know more about the
evaluations of the NSF-supported curricula and UCSMP than about the evaluations of the commercial programs. We suggest that three factors account for this uneven distribution of studies. First, evaluations have been funded by the NSF both as a part of the original call, and as follow-up to the work in the case of three supplemental awards to two of the curricula programs. Second, most NSF-supported programs and UCSMP were developed at university sites where there is access to the resources of graduate students and research staff. Finally, there was some reported reluctance on the part of commercial companies to release studies that could affect perceptions of competitive advantage. As Figure 5-1 shows, there were quite a few comparative studies of Everyday Mathematics (EM), Connected Mathematics Project (CMP), Contemporary Mathematics in Context (Core-Plus Mathematics Project [CPMP]), Interactive Mathematics Program (IMP), UCSMP, and Saxon.
In the programs with many studies, we note that a significant number of studies were generated by a core set of authors. In some cases, the evaluation reports follow a relatively uniform structure applied to single schools, generating multiple studies or following cohorts over years. Others use a standardized evaluation approach to evaluate sequential courses. Any reports duplicating exactly the same sample, outcome measures, or forms of analysis were eliminated. For example, one study of Mathematics Trailblazers (Carter et al., 2002) reanalyzed the data from the larger ARC Implementation Center study (Sconiers et al., 2002), so it was not included separately. Synthesis studies referencing a variety of evaluation reports are summarized in Chapter 6 , but relevant individual studies that were referenced in them were sought out and included in this comparative review.
Other less formal comparative studies are conducted regularly at the school or district level, but such studies were not included in this review unless we could obtain formal reports of their results, and the studies met the criteria outlined for inclusion in our database. In our conclusions, we address the issue of how to collect such data more systematically at the district or state level in order to subject the data to the standards of scholarly peer review and make it more systematically and fairly a part of the national database on curricular effectiveness.
A standard for evaluation of any social program requires that an impact assessment is warranted only if two conditions are met: (1) the curricular program is clearly specified, and (2) the intervention is well implemented. Absent this assurance, one must have a means of ensuring or measuring treatment integrity in order to make causal inferences. Rossi et al. (1999, p. 238) warned that:
two prerequisites [must exist] for assessing the impact of an intervention. First, the program’s objectives must be sufficiently well articulated to make
it possible to specify credible measures of the expected outcomes, or the evaluator must be able to establish such a set of measurable outcomes. Second, the intervention should be sufficiently well implemented that there is no question that its critical elements have been delivered to appropriate targets. It would be a waste of time, effort, and resources to attempt to estimate the impact of a program that lacks measurable outcomes or that has not been properly implemented. An important implication of this last consideration is that interventions should be evaluated for impact only when they have been in place long enough to have ironed out implementation problems.
These same conditions apply to evaluation of mathematics curricula. The comparative studies in this report varied in the quality of documentation of these two conditions; however, all addressed them to some degree or another. Initially by reviewing the studies, we were able to identify one general design template, which consisted of seven critical decision points and determined that it could be used to develop a framework for conducting our meta-analysis. The seven critical decision points we identified initially were:
Choice of type of design: experimental or quasi-experimental;
For those studies that do not use random assignment: what methods of establishing comparability of groups were built into the design—this includes student characteristics, teacher characteristics, and the extent to which professional development was involved as part of the definition of a curriculum;
Definition of the appropriate unit of analysis (students, classes, teachers, schools, or districts);
Inclusion of an examination of implementation components;
Definition of the outcome measures and disaggregated results by program;
The choice of statistical tests, including statistical significance levels and effect size; and
Recognition of limitations to generalizability resulting from design choices.
These are critical decisions that affect the quality of an evaluation. We further identified a subset of these evaluation studies that met a set of minimum conditions that we termed at least minimally methodologically adequate studies. Such studies are those with the greatest likelihood of shedding light on the effectiveness of these programs. To be classified as at least minimally methodologically adequate, and therefore to be considered for further analysis, each evaluation study was required to:
Include quantifiably measurable outcomes such as test scores, responses to specified cognitive tasks of mathematical reasoning, performance evaluations, grades, and subsequent course taking; and
Provide adequate information to judge the comparability of samples. In addition, a study must have included at least one of the following additional design elements:
A report of implementation fidelity or professional development activity;
Results disaggregated by content strands or by performance by student subgroups; and/or
Multiple outcome measures or precise theoretical analysis of a measured construct, such as number sense, proof, or proportional reasoning.
Using this rubric, the committee identified a subset of 63 comparative studies to classify as at least minimally methodologically adequate and to analyze in depth to inform the conduct of future evaluations. There are those who would argue that any threat to the validity of a study discredits the findings, thus claiming that until we know everything, we know nothing. Others would claim that from the myriad of studies, examining patterns of effects and patterns of variation, one can learn a great deal, perhaps tentatively, about programs and their possible effects. More importantly, we can learn about methodologies and how to concentrate and focus to increase the likelihood of learning more quickly. As Lipsey (1997, p. 22) wrote:
In the long run, our most useful and informative contribution to program managers and policy makers and even to the evaluation profession itself may be the consolidation of our piecemeal knowledge into broader pictures of the program and policy spaces at issue, rather than individual studies of particular programs.
We do not wish to imply that we devalue studies of student affect or conceptions of mathematics, but decided that unless these indicators were connected to direct indicators of student learning, we would eliminate them from further study. As a result of this sorting, we eliminated 19 studies of NSF-supported curricula and 13 studies of commercially generated curricula. Of these, 4 were eliminated for their sole focus on affect or conceptions, 3 were eliminated for their comparative focus on outcomes other than achievement, such as teacher-related variables, and 19 were eliminated for their failure to meet the minimum additional characteristics specified in the criteria above. In addition, six others were excluded from the studies of commercial materials because they were not conducted within the grade-
level band specified by the committee for the selection of that program. From this point onward, all references can be assumed to refer to at least minimally methodologically adequate unless a study is referenced for illustration, in which case we label it with “EX” to indicate that it is excluded in the summary analyses. Studies labeled “EX” are occasionally referenced because they can provide useful information on certain aspects of curricular evaluation, but not on the overall effectiveness.
The at least minimally methodologically adequate studies reported on a variety of grade levels. Figure 5-2 shows the different grade levels of the studies. At times, the choice of grade levels was dictated by the years in which high-stakes tests were given. Most of the studies reported on multiple grade levels, as shown in Figure 5-2 .
Using the seven critical design elements of at least minimally methodologically adequate studies as a design template, we describe the overall database and discuss the array of choices on critical decision points with examples. Following that, we report on the results on the at least minimally methodologically adequate studies by program type. To do so, the results of each study were coded as either statistically significant or not. Those studies
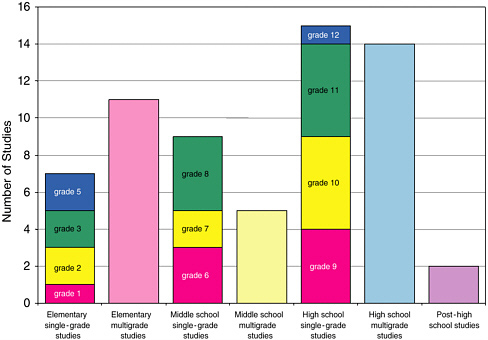
FIGURE 5-2 Single-grade studies by grade and multigrade studies by grade band.
that contained statistically significant results were assigned a percentage of outcomes that are positive (in favor of the treatment curriculum) based on the number of statistically significant comparisons reported relative to the total number of comparisons reported, and a percentage of outcomes that are negative (in favor of the comparative curriculum). The remaining were coded as the percentage of outcomes that are non significant. Then, using seven critical decision points as filters, we identified and examined more closely sets of studies that exhibited the strongest designs, and would therefore be most likely to increase our confidence in the validity of the evaluation. In this last section, we consider alternative hypotheses that could explain the results.
The committee emphasizes that we did not directly evaluate the materials. We present no analysis of results aggregated across studies by naming individual curricular programs because we did not consider the magnitude or rigor of the database for individual programs substantial enough to do so. Nevertheless, there are studies that provide compelling data concerning the effectiveness of the program in a particular context. Furthermore, we do report on individual studies and their results to highlight issues of approach and methodology and to remain within our primary charge, which was to evaluate the evaluations, we do not summarize results of the individual programs.
DESCRIPTION OF COMPARATIVE STUDIES DATABASE ON CRITICAL DECISION POINTS
An experimental or quasi-experimental design.
We separated the studies into experimental and quasiexperimental, and found that 100 percent of the studies were quasiexperimental (Campbell and Stanley, 1966; Cook and Campbell, 1979; and Rossi et al., 1999). 1 Within the quasi-experimental studies, we identified three subcategories of comparative study. In the first case, we identified a study as cross-curricular comparative if it compared the results of curriculum A with curriculum B. A few studies in this category also compared two samples within the curriculum to each other and specified different conditions such as high and low implementation quality.
A second category of a quasi-experimental study involved comparisons that could shed light on effectiveness involving time series studies. These studies compared the performance of a sample of students in a curriculum
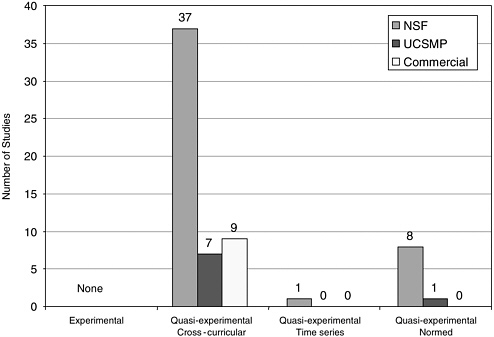
FIGURE 5-3 The number of comparative studies in each category.
under investigation across time, such as in a longitudinal study of the same students over time. A third category of comparative study involved a comparison to some form of externally normed results, such as populations taking state, national, or international tests or prior research assessment from a published study or studies. We categorized these studies and divided them into NSF, UCSMP, and commercial and labeled them by the categories above ( Figure 5-3 ).
In nearly all studies in the comparative group, the titles of experimental curricula were explicitly identified. The only exception to this was the ARC Implementation Center study (Sconiers et al., 2002), where three NSF-supported elementary curricula were examined, but in the results, their effects were pooled. In contrast, in the majority of the cases, the comparison curriculum is referred to simply as “traditional.” In only 22 cases were comparisons made between two identified curricula. Many others surveyed the array of curricula at comparison schools and reported on the most frequently used, but did not identify a single curriculum. This design strategy is used often because other factors were used in selecting comparison groups, and the additional requirement of a single identified curriculum in
these sites would often make it difficult to match. Studies were categorized into specified (including a single or multiple identified curricula) and nonspecified curricula. In the 63 studies, the central group was compared to an NSF-supported curriculum (1), an unnamed traditional curriculum (41), a named traditional curriculum (19), and one of the six commercial curricula (2). To our knowledge, any systematic impact of such a decision on results has not been studied, but we express concern that when a specified curriculum is compared to an unspecified content which is a set of many informal curriculum, the comparison may favor the coherency and consistency of the single curricula, and we consider this possibility subsequently under alternative hypotheses. We believe that a quality study should at least report the array of curricula that comprise the comparative group and include a measure of the frequency of use of each, but a well-defined alternative is more desirable.
If a study was both longitudinal and comparative, then it was coded as comparative. When studies only examined performances of a group over time, such as in some longitudinal studies, it was coded as quasi-experimental normed. In longitudinal studies, the problems created by student mobility were evident. In one study, Carroll (2001), a five-year longitudinal study of Everyday Mathematics, the sample size began with 500 students, 24 classrooms, and 11 schools. By 2nd grade, the longitudinal sample was 343. By 3rd grade, the number of classes increased to 29 while the number of original students decreased to 236 students. At the completion of the study, approximately 170 of the original students were still in the sample. This high rate of attrition from the study suggests that mobility is a major challenge in curricular evaluation, and that the effects of curricular change on mobile students needs to be studied as a potential threat to the validity of the comparison. It is also a challenge in curriculum implementation because students coming into a program do not experience its cumulative, developmental effect.
Longitudinal studies also have unique challenges associated with outcome measures, a study by Romberg et al. (in press) (EX) discussed one approach to this problem. In this study, an external assessment system and a problem-solving assessment system were used. In the External Assessment System, items from the National Assessment of Educational Progress (NAEP) and Third International Mathematics and Science Survey (TIMSS) were balanced across four strands (number, geometry, algebra, probability and statistics), and 20 items of moderate difficulty, called anchor items, were repeated on each grade-specific assessment (p. 8). Because the analyses of the results are currently under way, the evaluators could not provide us with final results of this study, so it is coded as EX.
However, such longitudinal studies can provide substantial evidence of the effects of a curricular program because they may be more sensitive to an
TABLE 5-1 Scores in Percentage Correct by Everyday Mathematics Students and Various Comparison Groups Over a Five-Year Longitudinal Study
accumulation of modest effects and/or can reveal whether the rates of learning change over time within curricular change.
The longitudinal study by Carroll (2001) showed that the effects of curricula may often accrue over time, but measurements of achievement present challenges to drawing such conclusions as the content and grade level change. A variety of measures were used over time to demonstrate growth in relation to comparison groups. The author chose a set of measures used previously in studies involving two Asian samples and an American sample to provide a contrast to the students in EM over time. For 3rd and 4th grades, where the data from the comparison group were not available, the authors selected items from the NAEP to bridge the gap. Table 5-1 summarizes the scores of the different comparative groups over five years. Scores are reported as the mean percentage correct for a series of tests on number computation, number concepts and applications, geometry, measurement, and data analysis.
It is difficult to compare performances on different tests over different groups over time against a single longitudinal group from EM, and it is not possible to determine whether the students’ performance is increasing or whether the changes in the tests at each grade level are producing the results; thus the results from longitudinal studies lacking a control group or use of sophisticated methodological analysis may be suspect and should be interpreted with caution.
In the Hirsch and Schoen (2002) study, based on a sample of 1,457 students, scores on Ability to Do Quantitative Thinking (ITED-Q) a subset of the Iowa Tests of Education Development, students in Core-Plus showed increasing performance over national norms over the three-year time period. The authors describe the content of the ITED-Q test and point out
that “although very little symbolic algebra is required, the ITED-Q is quite demanding for the full range of high school students” (p. 3). They further point out that “[t]his 3-year pattern is consistent, on average, in rural, urban, and suburban schools, for males and females, for various minority groups, and for students for whom English was not their first language” (p. 4). In this case, one sees that studies over time are important as results over shorter periods may mask cumulative effects of consistent and coherent treatments and such studies could also show increases that do not persist when subject to longer trajectories. One approach to longitudinal studies was used by Webb and Dowling in their studies of the Interactive Mathematics Program (Webb and Dowling, 1995a, 1995b, 1995c). These researchers conducted transcript analyses as a means to examine student persistence and success in subsequent course taking.
The third category of quasi-experimental comparative studies measured student outcomes on a particular curricular program and simply compared them to performance on national tests or international tests. When these tests were of good quality and were representative of a genuine sample of a relevant population, such as NAEP reports or TIMSS results, the reports often provided one a reasonable indicator of the effects of the program if combined with a careful description of the sample. Also, sometimes the national tests or state tests used were norm-referenced tests producing national percentiles or grade-level equivalents. The normed studies were considered of weaker quality in establishing effectiveness, but were still considered valid as examples of comparing samples to populations.
For Studies That Do Not Use Random Assignment: What Methods of Establishing Comparability Across Groups Were Built into the Design
The most fundamental question in an evaluation study is whether the treatment has had an effect on the chosen criterion variable. In our context, the treatment is the curriculum materials, and in some cases, related professional development, and the outcome of interest is academic learning. To establish if there is a treatment effect, one must logically rule out as many other explanations as possible for the differences in the outcome variable. There is a long tradition on how this is best done, and the principle from a design point of view is to assure that there are no differences between the treatment conditions (especially in these evaluations, often there are only the new curriculum materials to be evaluated and a control group) either at the outset of the study or during the conduct of the study.
To ensure the first condition, the ideal procedure is the random assignment of the appropriate units to the treatment conditions. The second condition requires that the treatment is administered reliably during the length of the study, and is assured through the careful observation and
control of the situation. Without randomization, there are a host of possible confounding variables that could differ among the treatment conditions and that are related themselves to the outcome variables. Put another way, the treatment effect is a parameter that the study is set up to estimate. Statistically, an estimate that is unbiased is desired. The goal is that its expected value over repeated samplings is equal to the true value of the parameter. Without randomization at the onset of a study, there is no way to assure this property of unbiasness. The variables that differ across treatment conditions and are related to the outcomes are confounding variables, which bias the estimation process.
Only one study we reviewed, Peters (1992), used randomization in the assignment of students to treatments, but that occurred because the study was limited to one teacher teaching two sections and included substantial qualitative methods, so we coded it as quasi-experimental. Others report partially assigning teachers randomly to treatment conditions (Thompson, et al., 2001; Thompson et al., 2003). Two primary reasons seem to account for a lack of use of pure experimental design. To justify the conduct and expense of a randomized field trial, the program must be described adequately and there must be relative assurance that its implementation has occurred over the duration of the experiment (Peterson et al., 1999). Additionally, one must be sure that the outcome measures are appropriate for the range of performances in the groups and valid relative to the curricula under investigation. Seldom can such conditions be assured for all students and teachers and over the duration of a year or more.
A second reason is that random assignment of classrooms to curricular treatment groups typically is not permitted or encouraged under normal school conditions. As one evaluator wrote, “Building or district administrators typically identified teachers who would be in the study and in only a few cases was random assignment of teachers to UCSMP Algebra or comparison classes possible. School scheduling and teacher preference were more important factors to administrators and at the risk of losing potential sites, we did not insist on randomization” (Mathison et al., 1989, p. 11).
The Joint Committee on Standards for Educational Evaluation (1994, p. 165) committee of evaluations recognized the likelihood of limitations on randomization, writing:
The groups being compared are seldom formed by random assignment. Rather, they tend to be natural groupings that are likely to differ in various ways. Analytical methods may be used to adjust for these initial differences, but these methods are based upon a number of assumptions. As it is often difficult to check such assumptions, it is advisable, when time and resources permit, to use several different methods of analysis to determine whether a replicable pattern of results is obtained.
Does the dearth of pure experimentation render the results of the studies reviewed worthless? Bias is not an “either-or” proposition, but it is a quantity of varying degrees. Through careful measurement of the most salient potential confounding variables, precise theoretical description of constructs, and use of these methods of statistical analysis, it is possible to reduce the amount of bias in the estimated treatment effect. Identification of the most likely confounding variables and their measurement and subsequent adjustments can greatly reduce bias and help estimate an effect that is likely to be more reflective of the true value. The theoretical fully specified model is an alternative to randomization by including relevant variables and thus allowing the unbiased estimation of the parameter. The only problem is realizing when the model is fully specified.
We recognized that we can never have enough knowledge to assure a fully specified model, especially in the complex and unstable conditions of schools. However, a key issue in determining the degree of confidence we have in these evaluations is to examine how they have identified, measured, or controlled for such confounding variables. In the next sections, we report on the methods of the evaluators in identifying and adjusting for such potential confounding variables.
One method to eliminate confounding variables is to examine the extent to which the samples investigated are equated either by sample selection or by methods of statistical adjustments. For individual students, there is a large literature suggesting the importance of social class to achievement. In addition, prior achievement of students must be considered. In the comparative studies, investigators first identified participation of districts, schools, or classes that could provide sufficient duration of use of curricular materials (typically two years or more), availability of target classes, or adequate levels of use of program materials. Establishing comparability was a secondary concern.
These two major factors were generally used in establishing the comparability of the sample:
Student population characteristics, such as demographic characteristics of students in terms of race/ethnicity, economic levels, or location type (urban, suburban, or rural).
Performance-level characteristics such as performance on prior tests, pretest performance, percentage passing standardized tests, or related measures (e.g., problem solving, reading).
In general, four methods of comparing groups were used in the studies we examined, and they permit different degrees of confidence in their results. In the first type, a matching class, school, or district was identified.
Studies were coded as this type if specified characteristics were used to select the schools systematically. In some of these studies, the methodology was relatively complex as correlates of performance on the outcome measures were found empirically and matches were created on that basis (Schneider, 2000; Riordan and Noyce, 2001; and Sconiers et al., 2002). For example, in the Sconiers et al. study, where the total sample of more than 100,000 students was drawn from five states and three elementary curricula are reviewed (Everyday Mathematics, Math Trailblazers [MT], and Investigations [IN], a highly systematic method was developed. After defining eligibility as a “reform school,” evaluators conducted separate regression analyses for the five states at each tested grade level to identify the strongest predictors of average school mathematics score. They reported, “reading score and low-income variables … consistently accounted for the greatest percentage of total variance. These variables were given the greatest weight in the matching process. Other variables—such as percent white, school mobility rate, and percent with limited English proficiency (LEP)—accounted for little of the total variance but were typically significant. These variables were given less weight in the matching process” (Sconiers et al., 2002, p. 10). To further provide a fair and complete comparison, adjustments were made based on regression analysis of the scores to minimize bias prior to calculating the difference in scores and reporting effect sizes. In their results the evaluators report, “The combined state-grade effect sizes for math and total are virtually identical and correspond to a percentile change of about 4 percent favoring the reform students” (p. 12).
A second type of matching procedure was used in the UCSMP evaluations. For example, in an evaluation centered on geometry learning, evaluators advertised in NCTM and UCSMP publications, and set conditions for participation from schools using their program in terms of length of use and grade level. After selecting schools with heterogeneous grouping and no tracking, the researchers used a match-pair design where they selected classes from the same school on the basis of mathematics ability. They used a pretest to determine this, and because the pretest consisted of two parts, they adjusted their significance level using the Bonferroni method. 2 Pairs were discarded if the differences in means and variance were significant for all students or for those students completing all measures, or if class sizes became too variable. In the algebra study, there were 20 pairs as a result of the matching, and because they were comparing three experimental conditions—first edition, second edition, and comparison classes—in the com-
parison study relevant to this review, their matching procedure identified 8 pairs. When possible, teachers were assigned randomly to treatment conditions. Most results are presented with the eight identified pairs and an accumulated set of means. The outcomes of this particular study are described below in a discussion of outcome measures (Thompson et al., 2003).
A third method was to measure factors such as prior performance or socio-economic status (SES) based on pretesting, and then to use analysis of covariance or multiple regression in the subsequent analysis to factor in the variance associated with these factors. These studies were coded as “control.” A number of studies of the Saxon curricula used this method. For example, Rentschler (1995) conducted a study of Saxon 76 compared to Silver Burdett with 7th graders in West Virginia. He reported that the groups differed significantly in that the control classes had 65 percent of the students on free and reduced-price lunch programs compared to 55 percent in the experimental conditions. He used scores on California Test of Basic Skills mathematics computation and mathematics concepts and applications as his pretest scores and found significant differences in favor of the experimental group. His posttest scores showed the Saxon experimental group outperformed the control group on both computation and concepts and applications. Using analysis of covariance, the computation difference in favor of the experimental group was statistically significant; however, the difference in concepts and applications was adjusted to show no significant difference at the p < .05 level.
A fourth method was noted in studies that used less rigorous methods of selection of sample and comparison of prior achievement or similar demographics. These studies were coded as “compare.” Typically, there was no explicit procedure to decide if the comparison was good enough. In some of the studies, it appeared that the comparison was not used as a means of selection, but rather as a more informal device to convince the reader of the plausibility of the equivalence of the groups. Clearly, the studies that used a more precise method of selection were more likely to produce results on which one’s confidence in the conclusions is greater.
Definition of Unit of Analysis
A major decision in forming an evaluation design is the unit of analysis. The unit of selection or randomization used to assign elements to treatment and control groups is closely linked to the unit of analysis. As noted in the National Research Council (NRC) report (1992, p. 21):
If one carries out the assignment of treatments at the level of schools, then that is the level that can be justified for causal analysis. To analyze the results at the student level is to introduce a new, nonrandomized level into
the study, and it raises the same issues as does the nonrandomized observational study…. The implications … are twofold. First, it is advisable to use randomization at the level at which units are most naturally manipulated. Second, when the unit of observation is at a “lower” level of aggregation than the unit of randomization, then for many purposes the data need to be aggregated in some appropriate fashion to provide a measure that can be analyzed at the level of assignment. Such aggregation may be as simple as a summary statistic or as complex as a context-specific model for association among lower-level observations.
In many studies, inadequate attention was paid to the fact that the unit of selection would later become the unit of analysis. The unit of analysis, for most curriculum evaluators, needs to be at least the classroom, if not the school or even the district. The units must be independently responding units because instruction is a group process. Students are not independent, the classroom—even if the teachers work together in a school on instruction—is not entirely independent, so the school is the unit. Care needed to be taken to ensure that an adequate numbers of units would be available to have sufficient statistical power to detect important differences.
A curriculum is experienced by students in a group, and this implies that individual student responses and what they learn are correlated. As a result, the appropriate unit of assignment and analysis must at least be defined at the classroom or teacher level. Other researchers (Bryk et al., 1993) suggest that the unit might be better selected at an even higher level of aggregation. The school itself provides a culture in which the curriculum is enacted as it is influenced by the policies and assignments of the principal, by the professional interactions and governance exhibited by the teachers as a group, and by the community in which the school resides. This would imply that the school might be the appropriate unit of analysis. Even further, to the extent that such decisions about curriculum are made at the district level and supported through resources and professional development at that level, the appropriate unit could arguably be the district. On a more practical level, we found that arguments can be made for a variety of decisions on the selection of units, and what is most essential is to make a clear argument for one’s choice, to use the same unit in the analysis as in the sample selection process, and to recognize the potential limits to generalization that result from one’s decisions.
We would argue in all cases that reports of how sites are selected must be explicit in the evaluation report. For example, one set of evaluation studies selected sites by advertisements in a journal distributed by the program and in NCTM journals (UCSMP) (Thompson et al., 2001; Thompson et al., 2003). The samples in their studies tended to be affluent suburban populations and predominantly white populations. Other conditions of inclusion, such as frequency of use also might have influenced this outcome,
but it is important that over a set of studies on effectiveness, all populations of students be adequately sampled. When a study is not randomized, adjustments for these confounding variables should be included. In our analysis of equity, we report on the concerns about representativeness of the overall samples and their impact on the generalizability of the results.
Implementation Components
The complexity of doing research on curricular materials introduces a number of possible confounding variables. Due to the documented complexity of curricular implementation, most comparative study evaluators attempt to monitor implementation in some fashion. A valuable outcome of a well-conducted evaluation is to determine not only if the experimental curriculum could ideally have a positive impact on learning, but whether it can survive or thrive in the conditions of schooling that are so variable across sites. It is essential to know what the treatment was, whether it occurred, and if so, to what degree of intensity, fidelity, duration, and quality. In our model in Chapter 3 , these factors were referred to as “implementation components.” Measuring implementation can be costly for large-scale comparative studies; however, many researchers have shown that variation in implementation is a key factor in determining effectiveness. In coding the comparative studies, we identified three types of components that help to document the character of the treatment: implementation fidelity, professional development treatments, and attention to teacher effects.
Implementation Fidelity
Implementation fidelity is a measure of the basic extent of use of the curricular materials. It does not address issues of instructional quality. In some studies, implementation fidelity is synonymous with “opportunity to learn.” In examining implementation fidelity, a variety of data were reported, including, most frequently, the extent of coverage of the curricular material, the consistency of the instructional approach to content in relation to the program’s theory, reports of pedagogical techniques, and the length of use of the curricula at the sample sites. Other less frequently used approaches documented the calendar of curricular coverage, requested teacher feedback by textbook chapter, conducted student surveys, and gauged homework policies, use of technology, and other particular program elements. Interviews with teachers and students, classroom surveys, and observations were the most frequently used data-gathering techniques. Classroom observations were conducted infrequently in these studies, except in cases when comparative studies were combined with case studies, typically with small numbers of schools and classes where observations
were conducted for long or frequent time periods. In our analysis, we coded only the presence or absence of one or more of these methods.
If the extent of implementation was used in interpreting the results, then we classified the study as having adjusted for implementation differences. Across all 63 at least minimally methodologically adequate studies, 44 percent reported some type of implementation fidelity measure, 3 percent reported and adjusted for it in interpreting their outcome measures, and 53 percent recorded no information on this issue. Differences among studies, by study type (NSF, UCSMP, and commercially generated), showed variation on this issue, with 46 percent of NSF reporting or adjusting for implementation, 75 percent of UCSMP, and only 11 percent of the other studies of commercial materials doing so. Of the commercial, non-UCSMP studies included, only one reported on implementation. Possibly, the evaluators for the NSF and UCSMP Secondary programs recognized more clearly that their programs demanded significant changes in practice that could affect their outcomes and could pose challenges to the teachers assigned to them.
A study by Abrams (1989) (EX) 3 on the use of Saxon algebra by ninth graders showed that concerns for implementation fidelity extend to all curricula, even those like Saxon whose methods may seem more likely to be consistent with common practice. Abrams wrote, “It was not the intent of this study to determine the effectiveness of the Saxon text when used as Saxon suggests, but rather to determine the effect of the text as it is being used in the classroom situations. However, one aspect of the research was to identify how the text is being taught, and how closely teachers adhere to its content and the recommended presentation” (p. 7). Her findings showed that for the 9 teachers and 300 students, treatment effects favoring the traditional group (using Dolciani’s Algebra I textbook, Houghton Mifflin, 1980) were found on the algebra test, the algebra knowledge/skills subtest, and the problem-solving test for this population of teachers (fixed effect). No differences were found between the groups on an algebra understanding/applications subtest, overall attitude toward mathematics, mathematical self-confidence, anxiety about mathematics, or enjoyment of mathematics. She suggests that the lack of differences might be due to the ways in which teachers supplement materials, change test conditions, emphasize
and deemphasize topics, use their own tests, vary the proportion of time spent on development and practice, use calculators and group work, and basically adapt the materials to their own interpretation and method. Many of these practices conflict directly with the recommendations of the authors of the materials.
A study by Briars and Resnick (2000) (EX) in Pittsburgh schools directly confronted issues relevant to professional development and implementation. Evaluators contrasted the performance of students of teachers with high and low implementation quality, and showed the results on two contrasting outcome measures, Iowa Test of Basic Skills (ITBS) and Balanced Assessment. Strong implementers were defined as those who used all of the EM components and provided student-centered instruction by giving students opportunities to explore mathematical ideas, solve problems, and explain their reasoning. Weak implementers were either not using EM or using it so little that the overall instruction in the classrooms was “hardly distinguishable from traditional mathematics instruction” (p. 8). Assignment was based on observations of student behavior in classes, the presence or absence of manipulatives, teacher questionnaires about the programs, and students’ knowledge of classroom routines associated with the program.
From the identification of strong- and weak-implementing teachers, strong- and weak-implementation schools were identified as those with strong- or weak-implementing teachers in 3rd and 4th grades over two consecutive years. The performance of students with 2 years of EM experience in these settings composed the comparative samples. Three pairs of strong- and weak-implementation schools with similar demographics in terms of free and reduced-price lunch (range 76 to 93 percent), student living with only one parent (range 57 to 82 percent), mobility (range 8 to 16 percent), and ethnicity (range 43 to 98 percent African American) were identified. These students’ 1st-grade ITBS scores indicated similarity in prior performance levels. Finally, evaluators predicted that if the effects were due to the curricular implementation and accompanying professional development, the effects on scores should be seen in 1998, after full implementation. Figure 5-4 shows that on the 1998 New Standards exams, placement in strong- and weak-implementation schools strongly affected students’ scores. Over three years, performance in the district on skills, concepts, and problem solving rose, confirming the evaluator’s predictions.
An article by McCaffrey et al. (2001) examining the interactions among instructional practices, curriculum, and student achievement illustrates the point that distinctions are often inadequately linked to measurement tools in their treatment of the terms traditional and reform teaching. In this study, researchers conducted an exploratory factor analysis that led them to create two scales for instructional practice: Reform Practices and Tradi-
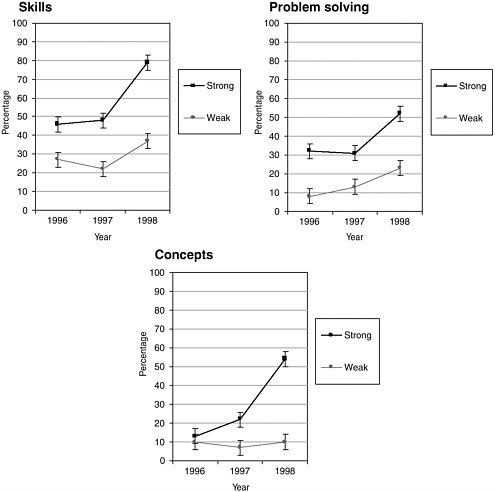
FIGURE 5-4 Percentage of students who met or exceeded the standard. Districtwide grade 4 New Standards Mathematics Reference Examination (NSMRE) performance for 1996, 1997, and 1998 by level of Everyday Mathematics implementation. Percentage of students who achieved the standard. Error bars denote the 99 percent confidence interval for each data point.
SOURCE: Re-created from Briars and Resnick (2000, pp. 19-20).
tional Practices. The reform scale measured the frequency, by means of teacher report, of teacher and student behaviors associated with reform instruction and assessment practices, such as using small-group work, explaining reasoning, representing and using data, writing reflections, or performing tasks in groups. The traditional scale focused on explanations to whole classes, the use of worksheets, practice, and short-answer assessments. There was a –0.32 correlation between scores for integrated curriculum teachers. There was a 0.27 correlation between scores for traditional
curriculum teachers. This shows that it is overly simplistic to think that reform and traditional practices are oppositional. The relationship among a variety of instructional practices is rather more complex as they interact with curriculum and various student populations.
Professional Development
Professional development and teacher effects were separated in our analysis from implementation fidelity. We recognized that professional development could be viewed by the readers of this report in two ways. As indicated in our model, professional development can be considered a program element or component or it can be viewed as part of the implementation process. When viewed as a program element, professional development resources are considered mandatory along with program materials. In relation to evaluation, proponents of considering professional development as a mandatory program element argue that curricular innovations, which involve the introduction of new topics, new types of assessment, or new ways of teaching, must make provision for adequate training, just as with the introduction of any new technology.
For others, the inclusion of professional development in the program elements without a concomitant inclusion of equal amounts of professional development relevant to a comparative treatment interjects a priori disproportionate treatments and biases the results. We hoped for an array of evaluation studies that might shed some empirical light on this dispute, and hence separated professional development from treatment fidelity, coding whether or not studies reported on the amount of professional development provided for the treatment and/or comparison groups. A study was coded as positive if it either reported on the professional development provided on the experimental group or reported the data on both treatments. Across all 63 at least minimally methodologically adequate studies, 27 percent reported some type of professional development measure, 1.5 percent reported and adjusted for it in interpreting their outcome measures, and 71.5 percent recorded no information on the issue.
A study by Collins (2002) (EX) 4 illustrates the critical and controversial role of professional development in evaluation. Collins studied the use of Connected Math over three years, in three middle schools in threat of being classified as low performing in the Massachusetts accountability system. A comparison was made between one school (School A) that engaged
substantively in professional development opportunities accompanying the program and two that did not (Schools B and C). In the CMP school reports (School A) totals between 100 and 136 hours of professional development were recorded for all seven teachers in grades 6 through 8. In School B, 66 hours were reported for two teachers and in School C, 150 hours were reported for eight teachers over three years. Results showed significant differences in the subsequent performance by students at the school with higher participation in professional development (School A) and it became a districtwide top performer; the other two schools remained at risk for low performance. No controls for teacher effects were possible, but the results do suggest the centrality of professional development for successful implementation or possibly suggest that the results were due to professional development rather than curriculum materials. The fact that these two interpretations cannot be separated is a problem when professional development is given to one and not the other. The effect could be due to textbook or professional development or an interaction between the two. Research designs should be adjusted to consider these issues when different conditions of professional development are provided.
Teacher Effects
These studies make it obvious that there are potential confounding factors of teacher effects. Many evaluation studies devoted inadequate attention to the variable of teacher quality. A few studies (Goodrow, 1998; Riordan and Noyce, 2001; Thompson et al., 2001; and Thompson et al., 2003) reported on teacher characteristics such as certification, length of service, experience with curricula, or degrees completed. Those studies that matched classrooms and reported by matched results rather than aggregated results sought ways to acknowledge the large variations among teacher performance and its impact on student outcomes. We coded any effort to report on possible teacher effects as one indicator of quality. Across all 63 at least minimally methodologically adequate studies, 16 percent reported some type of teacher effect measure, 3 percent reported and adjusted for it in interpreting their outcome measures, and 81 percent recorded no information on this issue.
One can see that the potential confounding factors of teacher effects, in terms of the provision of professional development or the measure of teacher effects, are not adequately considered in most evaluation designs. Some studies mention and give a subjective judgment as to the nature of the problem, but this is descriptive at the most. Hardly any of the studies actually do anything analytical, and because these are such important potential confounding variables, this presents a serious challenge to the efficacy of these studies. Figure 5-5 shows how attention to these factors varies
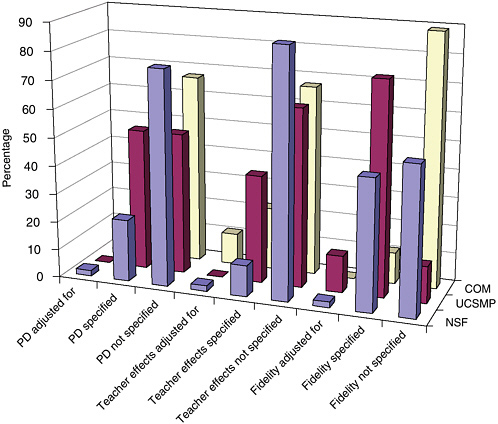
FIGURE 5-5 Treatment of implementation components by program type.
NOTE: PD = professional development.
across program categories among NSF-supported, UCSMP, and studies of commercial materials. In general, evaluations of NSF-supported studies were the most likely to measure these variables; UCSMP had the most standardized use of methods to do so across studies; and commercial material evaluators seldom reported on issues of implementation fidelity.
Identification of a Set of Outcome Measures and Forms of Disaggregation
Using the selected student outcomes identified in the program theory, one must conduct an impact assessment that refers to the design and measurement of student outcomes. In addition to selecting what outcomes should be measured within one’s program theory, one must determine how these outcomes are measured, when those measures are collected, and what
purpose they serve from the perspective of the participants. In the case of curricular evaluation, there are significant issues involved in how these measures are reported. To provide insight into the level of curricular validity, many evaluators prefer to report results by topic, content strand, or item cluster. These reports often present the level of specificity of outcome needed to inform curriculum designers, especially when efforts are made to document patterns of errors, distribution of results across multiple choices, or analyses of student methods. In these cases, whole test scores may mask essential differences in impact among curricula at the level of content topics, reporting only average performance.
On the other hand, many large-scale assessments depend on methods of test equating that rely on whole test scores and make comparative interpretations of different test administrations by content strands of questionable reliability. Furthermore, there are questions such as whether to present only gain scores effect sizes, how to link pretests and posttests, and how to determine the relative curricular sensitivity of various outcome measures.
The findings of comparative studies are reported in terms of the outcome measure(s) collected. To describe the nature of the database with regard to outcome measures and to facilitate our analyses of the studies, we classified each of the included studies on four outcome measure dimensions:
Total score reported;
Disaggregation of content strands, subtest, performance level, SES, or gender;
Outcome measure that was specific to curriculum; and
Use of multiple outcome measures.
Most studies reported a total score, but we did find studies that reported only subtest scores or only scores on an item-by-item basis. For example, in the Ben-Chaim et al. (1998) evaluation study of Connected Math, the authors were interested in students’ proportional reasoning proficiency as a result of use of this curriculum. They asked students from eight seventh-grade classes of CMP and six seventh-grade classes from the control group to solve a variety of tasks categorized as rate and density problems. The authors provide precise descriptions of the cognitive challenges in the items; however, they do not explain if the problems written up were representative of performance on a larger set of items. A special rating form was developed to code responses in three major categories (correct answer, incorrect answer, and no response), with subcategories indicating the quality of the work that accompanied the response. No reports on reliability of coding were given. Performance on standardized tests indicated that control students’ scores were slightly higher than CMP at the beginning of the
year and lower at the end. Twenty-five percent of the experimental group members were interviewed about their approaches to the problems. The CMP students outperformed the control students (53 percent versus 28 percent) overall in providing the correct answers and support work, and 27 percent of the control group gave an incorrect answer or showed incorrect thinking compared to 13 percent of the CMP group. An item-level analysis permitted the researchers to evaluate the actual strategies used by the students. They reported, for example, that 82 percent of CMP students used a “strategy focused on package price, unit price, or a combination of the two; those effective strategies were used by only 56 of 91 control students (62 percent)” (p. 264).
The use of item or content strand-level comparative reports had the advantage that they permitted the evaluators to assess student learning strategies specific to a curriculum’s program theory. For example, at times, evaluators wanted to gauge the effectiveness of using problems different from those on typical standardized tests. In this case, problems were drawn from familiar circumstances but carefully designed to create significant cognitive challenges, and assess how well the informal strategies approach in CMP works in comparison to traditional instruction. The disadvantages of such an approach include the use of only a small number of items and the concerns for reliability in scoring. These studies seem to represent a method of creating hybrid research models that build on the detailed analyses possible using case studies, but still reporting on samples that provide comparative data. It possibly reflects the concerns of some mathematicians and mathematics educators that the effectiveness of materials needs to be evaluated relative to very specific, research-based issues on learning and that these are often inadequately measured by multiple-choice tests. However, a decision not to report total scores led to a trade-off in the reliability and representativeness of the reported data, which must be addressed to increase the objectivity of the reports.
Second, we coded whether outcome data were disaggregated in some way. Disaggregation involved reporting data on dimensions such as content strand, subtest, test item, ethnic group, performance level, SES, and gender. We found disaggregated results particularly helpful in understanding the findings of studies that found main effects, and also in examining patterns across studies. We report the results of the studies’ disaggregation by content strand in our reports of effects. We report the results of the studies’ disaggregation by subgroup in our discussions of generalizability.
Third, we coded whether a study used an outcome measure that the evaluator reported as being sensitive to a particular treatment—this is a subcategory of what was defined in our framework as “curricular validity of measures.” In such studies, the rationale was that readily available measures such as state-mandated tests, norm-referenced standardized tests, and
college entrance examinations do not measure some of the aims of the program under study. A frequently cited instance of this was that “off the shelf” instruments do not measure well students’ ability to apply their mathematical knowledge to problems embedded in complex settings. Thus, some studies constructed a collection of tasks that assessed this ability and collected data on it (Ben-Chaim et al., 1998; Huntley et al., 2000).
Finally, we recorded whether a study used multiple outcome measures. Some studies used a variety of achievement measures and other studies reported on achievement accompanied by measures such as subsequent course taking or various types of affective measures. For example, Carroll (2001, p. 47) reported results on a norm-referenced standardized achievement test as well as a collection of tasks developed in other studies.
A study by Huntley et al. (2000) illustrates how a variety of these techniques were combined in their outcome measures. They developed three assessments. The first emphasized contextualized problem solving based on items from the American Mathematical Association of Two-Year Colleges and others; the second assessment was on context-free symbolic manipulation and a third part requiring collaborative problem solving. To link these measures to the overall evaluation, they articulated an explicit model of cognition based on how one links an applied situation to mathematical activity through processes of formulation and interpretation. Their assessment strategy permitted them to investigate algebraic reasoning as an ability to use algebraic ideas and techniques to (1) mathematize quantitative problem situations, (2) use algebraic principles and procedures to solve equations, and (3) interpret results of reasoning and calculations.
In presenting their data comparing performance on Core-Plus and traditional curriculum, they presented both main effects and comparisons on subscales. Their design of outcome measures permitted them to examine differences in performance with and without context and to conclude with statements such as “This result illustrates that CPMP students perform better than control students when setting up models and solving algebraic problems presented in meaningful contexts while having access to calculators, but CPMP students do not perform as well on formal symbol-manipulation tasks without access to context cues or calculators” (p. 349). The authors go on to present data on the relationship between knowing how to plan or interpret solutions and knowing how to carry them out. The correlations between these variables were weak but significantly different (0.26 for control groups and 0.35 for Core-Plus). The advantage of using multiple measures carefully tied to program theory is that they can permit one to test fine content distinctions that are likely to be the level of adjustments necessary to fine tune and improve curricular programs.
Another interesting approach to the use of outcome measures is found in the UCSMP studies. In many of these studies, evaluators collected infor-
TABLE 5-2 Mean Percentage Correct on the Subject Tests
mation from teachers’ reports and chapter reviews as to whether topics for items on the posttests were taught, calling this an “opportunity to learn” measure. The authors reported results from three types of analyses: (1) total test scores, (2) fair test scores (scores reported by program but only on items on topics taught), and (3) conservative test scores (scores on common items taught in both). Table 5-2 reports on the variations across the multiple- choice test scores for the Geometry study (Thompson et al., 2003) on a standardized test, High School Subject Tests-Geometry Form B , and the UCSMP-constructed Geometry test, and for the Advanced Algebra Study on the UCSMP-constructed Advanced Algebra test (Thompson et al., 2001). The table shows the mean scores for UCSMP classes and comparison classes. In each cell, mean percentage correct is reported first by whole test, then by fair test, and then by conservative test.
The authors explicitly compare the items from the standard Geometry test with the items from the UCSMP test and indicate overlap and difference. They constructed their own test because, in their view, the standard test was not adequately balanced among skills, properties, and real-world uses. The UCSMP test included items on transformations, representations, and applications that were lacking in the national test. Only five items were taught by all teachers; hence in the case of the UCSMP geometry test, there is no report on a conservative test. In the Advanced Algebra evaluation, only a UCSMP-constructed test was viewed as appropriate to cover the treatment of the prior material and alignment to the goals of the new course. These data sets demonstrate the challenge of selecting appropriate outcome measures, the sensitivity of the results to those decisions, and the importance of full disclosure of decision-making processes in order to permit readers to assess the implications of the choices. The methodology utilized sought to ensure that the material in the course was covered adequately by treatment teachers while finding ways to make comparisons that reflected content coverage.
Only one study reported on its outcomes using embedded assessment items employed over the course of the year. In a study of Saxon and UCSMP, Peters (1992) (EX) studied the use of these materials with two classrooms taught by the same teacher. In this small study, he randomly assigned students to treatment groups and then measured their performance on four unit tests composed of items common to both curricula and their progress on the Orleans-Hanna Algebraic Prognosis Test.
Peters’ study showed no significant difference in placement scores between Saxon and UCSMP on the posttest, but did show differences on the embedded assessment. Figure 5-6 (Peters, 1992, p. 75) shows an interesting display of the differences on a “continuum” that shows both the direction and magnitude of the differences and provides a level of concept specificity missing in many reports. This figure and a display ( Figure 5-7 ) in a study by Senk (1991, p. 18) of students’ mean scores on Curriculum A versus Curriculum B with a 10 percent range of differences marked represent two excellent means to communicate the kinds of detailed content outcome information that promises to be informative to curriculum writers, publishers, and school decision makers. In Figure 5-7 , 16 items listed by number were taken from the Second International Mathematics Study. The Functions, Statistics, and Trigonometry sample averaged 41 percent correct on these items whereas the U.S. precalculus sample averaged 38 percent. As shown in the figure, differences of 10 percent or less fall inside the banded area and greater than 10 percent fall outside, producing a display that makes it easy for readers and designers to identify the relative curricular strengths and weaknesses of topics.
While we value detailed outcome measure information, we also recognize the importance of examining curricular impact on students’ standardized test performance. Many developers, but not all, are explicit in rejecting standardized tests as adequate measures of the outcomes of their programs, claiming that these tests focus on skills and manipulations, that they are overly reliant on multiple-choice questions, and that they are often poorly aligned to new content emphases such as probability and statistics, transformations, use of contextual problems and functions, and process skills, such as problem solving, representation, or use of calculators. However, national and state tests are being revised to include more content on these topics and to draw on more advanced reasoning. Furthermore, these high-stakes tests are of major importance in school systems, determining graduation, passing standards, school ratings, and so forth. For this reason, if a curricular program demonstrated positive impact on such measures, we referred to that in Chapter 3 as establishing “curricular alignment with systemic factors.” Adequate performance on these measures is of paramount importance to the survival of reform (to large groups of parents and
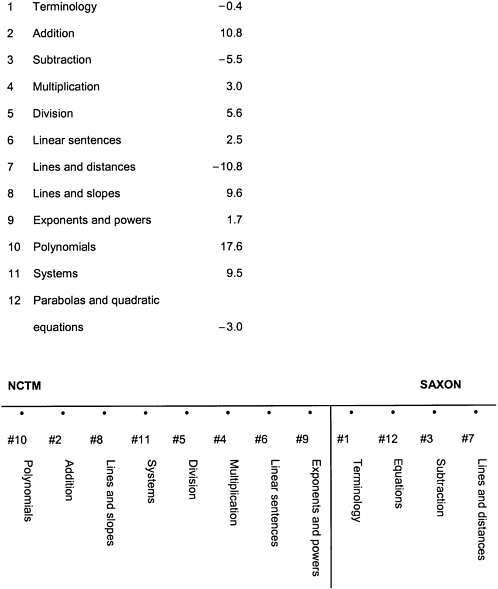
FIGURE 5-6 Continuum of criterion score averages for studied programs.
SOURCE: Peters (1992, p. 75).
school administrators). These examples demonstrate how careful attention to outcomes measures is an essential element of valid evaluation.
In Table 5-3 , we document the number of studies using a variety of types of outcome measures that we used to code the data, and also report on the types of tests used across the studies.
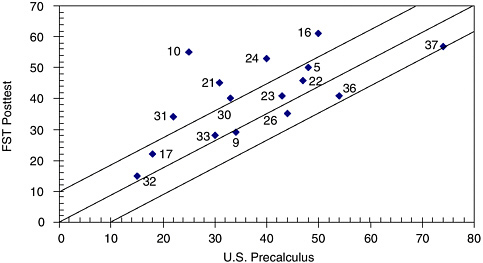
FIGURE 5-7 Achievement (percentage correct) on Second International Mathematics Study (SIMS) items by U.S. precalculus students and functions, statistics, and trigonometry (FST) students.
SOURCE: Re-created from Senk (1991, p. 18).
TABLE 5-3 Number of Studies Using a Variety of Outcome Measures by Program Type
A Choice of Statistical Tests, Including Statistical Significance and Effect Size
In our first review of the studies, we coded what methods of statistical evaluation were used by different evaluators. Most common were t-tests; less frequently one found Analysis of Variance (ANOVA), Analysis of Co-
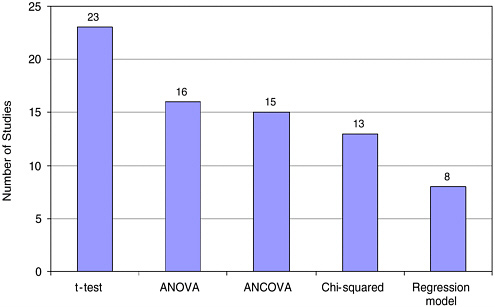
FIGURE 5-8 Statistical tests most frequently used.
variance (ANCOVA), and chi-square tests. In a few cases, results were reported using multiple regression or hierarchical linear modeling. Some used multiple tests; hence the total exceeds 63 ( Figure 5-8 ).
One of the difficult aspects of doing curriculum evaluations concerns using the appropriate unit both in terms of the unit to be randomly assigned in an experimental study and the unit to be used in statistical analysis in either an experimental or quasi-experimental study.
For our purposes, we made the decision that unless the study concerned an intact student population such as the freshman at a single university, where a student comparison was the correct unit, we believed that for statistical tests, the unit should be at least at the classroom level. Judgments were made for each study as to whether the appropriate unit was utilized. This question is an important one because statistical significance is related to sample size, and as a result, studies that inappropriately use the student as the unit of analysis could be concluding significant differences where they are not present. For example, if achievement differences between two curricula are tested in 16 classrooms with 400 students, it will always be easier to show significant differences using scores from those 400 students than using 16 classroom means.
Fifty-seven studies used students as the unit of analysis in at least one test of significance. Three of these were coded as correct because they involved whole populations. In all, 10 studies were coded as using the
TABLE 5-4 Performance on Applied Algebra Problems with Use of Calculators, Part 1
TABLE 5-5 Reanalysis of Algebra Performance Data
correct unit of analysis; hence, 7 studies used teachers or classes, or schools. For some studies where multiple tests were conducted, a judgment was made as to whether the primary conclusions drawn treated the unit of analysis adequately. For example, Huntley et al. (2000) compared the performance of CPMP students with students in a traditional course on a measure of ability to formulate and use algebraic models to answer various questions about relationships among variables. The analysis used students as the unit of analysis and showed a significant difference, as shown in Table 5-4 .
To examine the robustness of this result, we reanalyzed the data using an independent sample t-test and a matched pairs t-test with class means as the unit of analysis in both tests ( Table 5-5 ). As can be seen from the analyses, in neither statistical test was the difference between groups found to be significantly different (p < .05), thus emphasizing the importance of using the correct unit in analyzing the data.
Reanalysis of student-level data using class means will not always result
TABLE 5-6 Mean Percentage Correct on Entire Multiple-Choice Posttest: Second Edition and Non-UCSMP
in a change in finding. Furthermore, using class means as the unit of analysis does not suggest that significant differences will not be found. For example, a study by Thompson et al. (2001) compared the performance of UCSMP students with the performance of students in a more traditional program across several measures of achievement. They found significant differences between UCSMP students and the non-UCSMP students on several measures. Table 5-6 shows results of an analysis of a multiple-choice algebraic posttest using class means as the unit of analysis. Significant differences were found in five of eight separate classroom comparisons, as shown in the table. They also found a significant difference using a matched-pairs t-test on class means.
The lesson to be learned from these reanalyses is that the choice of unit of analysis and the way the data are aggregated can impact study findings in important ways including the extent to which these findings can be generalized. Thus it is imperative that evaluators pay close attention to such considerations as the unit of analysis and the way data are aggregated in the design, implementation, and analysis of their studies.
Second, effect size has become a relatively common and standard way of gauging the practical significance of the findings. Statistical significance only indicates whether the main-level differences between two curricula are large enough to not be due to chance, assuming they come from the same population. When statistical differences are found, the question remains as to whether such differences are large enough to consider. Because any innovation has its costs, the question becomes one of cost-effectiveness: Are the differences in student achievement large enough to warrant the costs of change? Quantifying the practical effect once statistical significance is established is one way to address this issue. There is a statistical literature for doing this, and for the purposes of this review, the committee simply noted whether these studies have estimated such an effect. However, the committee further noted that in conducting meta-analyses across these studies, effect size was likely to be of little value. These studies used an enormous variety of outcome measures, and even using effect size as a means to standardize units across studies is not sensible when the measures in each
study address such a variety of topics, forms of reasoning, content levels, and assessment strategies.
We note very few studies drew upon the advances in methodologies employed in modeling, which include causal modeling, hierarchical linear modeling (Bryk and Raudenbush, 1992; Bryk et al., 1993), and selection bias modeling (Heckman and Hotz, 1989). Although developing detailed specifications for these approaches is beyond the scope of this review, we wish to emphasize that these methodological advances should be considered within future evaluation designs.
Results and Limitations to Generalizability Resulting from Design Constraints
One also must consider what generalizations can be drawn from the results (Campbell and Stanley, 1966; Caporaso and Roos, 1973; and Boruch, 1997). Generalization is a matter of external validity in that it determines to what populations the study results are likely to apply. In designing an evaluation study, one must carefully consider, in the selection of units of analysis, how various characteristics of those units will affect the generalizability of the study. It is common for evaluators to conflate issues of representativeness for the purpose of generalizability (external validity) and comparativeness (the selection of or adjustment for comparative groups [internal validity]). Not all studies must be representative of the population served by mathematics curricula to be internally valid. But, to be generalizable beyond restricted communities, representativeness must be obtained by the random selection of the basic units. Clearly specifying such limitations to generalizability is critical. Furthermore, on the basis of equity considerations, one must be sure that if overall effectiveness is claimed, that the studies have been conducted and analyzed with reference of all relevant subgroups.
Thus, depending on the design of a study, its results may be limited in generalizability to other populations and circumstances. We identified four typical kinds of limitations on the generalizability of studies and coded them to determine, on the whole, how generalizable the results across studies might be.
First, there were studies whose designs were limited by the ability or performance level of the students in the samples. It was not unusual to find that when new curricula were implemented at the secondary level, schools kept in place systems of tracking that assigned the top students to traditional college-bound curriculum sequences. As a result, studies either used comparative groups who were matched demographically but less skilled than the population as a whole, in relation to prior learning, or their results compared samples of less well-prepared students to samples of students
with stronger preparations. Alternatively, some studies reported on the effects of curricula reform on gifted and talented students or on college-attending students. In these cases, the study results would also limit the generalizability of the results to similar populations. Reports using limited samples of students’ ability and prior performance levels were coded as a limitation to the generalizability of the study.
For example, Wasman (2000) conducted a study of one school (six teachers) and examined the students’ development of algebraic reasoning after one (n=100) and two years (n=73) in CMP. In this school, the top 25 percent of the students are counseled to take a more traditional algebra course, so her experimental sample, which was 61 percent white, 35 percent African American, 3 percent Asian, and 1 percent Hispanic, consisted of the lower 75 percent of the students. She reported on the student performance on the Iowa Algebraic Aptitude Test (IAAT) (1992), in the subcategories of interpreting information, translating symbols, finding relationships, and using symbols. Results for Forms 1 and 2 of the test, for the experimental and norm group, are shown in Table 5-7 for 8th graders.
In our coding of outcomes, this study was coded as showing no significant differences, although arguably its results demonstrate a positive set of
TABLE 5-7 Comparing Iowa Algebraic Aptitude Test (IAAT) Mean Scores of the Connected Mathematics Project Forms 1 and 2 to the Normative Group (8th Graders)
outcomes as the treatment group was weaker than the control group. Had the researcher used a prior achievement measure and a different statistical technique, significance might have been demonstrated, although potential teacher effects confound interpretations of results.
A second limitation to generalizability was when comparative studies resided entirely at curriculum pilot site locations, where such sites were developed as a means to conduct formative evaluations of the materials with close contact and advice from teachers. Typically, pilot sites have unusual levels of teacher support, whether it is in the form of daily technical support in the use of materials or technology or increased quantities of professional development. These sites are often selected for study because they have established cooperative agreements with the program developers and other sources of data, such as classroom observations, are already available. We coded whether the study was conducted at a pilot site to signal potential limitations in generalizability of the findings.
Third, studies were also coded as being of limited generalizability if they failed to disaggregate their data by socioeconomic class, race, gender, or some other potentially significant sources of restriction on the claims. We recorded the categories in which disaggregation occurred and compiled their frequency across the studies. Because of the need to open the pipeline to advanced study in mathematics by members of underrepresented groups, we were particularly concerned about gauging the extent to which evaluators factored such variables into their analysis of results and not just in terms of the selection of the sample.
Of the 46 included studies of NSF-supported curricula, 19 disaggregated their data by student subgroup. Nine of 17 studies of commercial materials disaggregated their data. Figure 5-9 shows the number of studies that disaggregated outcomes by race or ethnicity, SES, gender, LEP, special education status, or prior achievement. Studies using multiple categories of disaggregation were counted multiple times by program category.
The last category of restricted generalization occurred in studies of limited sample size. Although such studies may have provided more indepth observations of implementation and reports on professional development factors, the smaller numbers of classrooms and students in the study would limit the extent of generalization that could be drawn from it. Figure 5-10 shows the distribution of sizes of the samples in terms of numbers of students by study type.
Summary of Results by Student Achievement Among Program Types
We present the results of the studies as a means to further investigate their methodological implications. To this end, for each study, we counted across outcome measures the number of findings that were positive, nega-
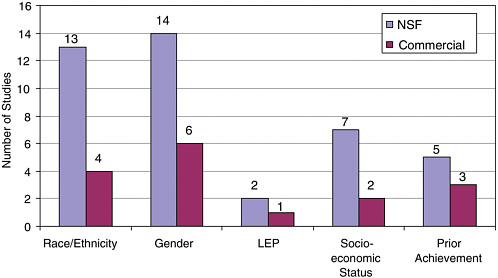
FIGURE 5-9 Disaggregation of subpopulations.
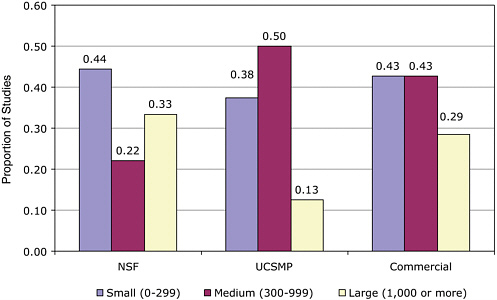
FIGURE 5-10 Proportion of studies by sample size and program.
tive, or indeterminate (no significant difference) and then calculated the proportion of each. We represented the calculation of each study as a triplet (a, b, c) where a indicates the proportion of the results that were positive and statistically significantly stronger than the comparison program, b indicates the proportion that were negative and statistically significantly weaker than the comparison program, and c indicates the proportion that showed no significant difference between the treatment and the comparative group. For studies with a single outcome measure, without disaggregation by content strand, the triplet is always composed of two zeros and a single one. For studies with multiple measures or disaggregation by content strand, the triplet is typically a set of three decimal values that sum to one. For example, a study with one outcome measure in favor of the experimental treatment would be coded (1, 0, 0), while one with multiple measures and mixed results more strongly in favor of the comparative curriculum might be listed as (.20, .50, .30). This triplet would mean that for 20 percent of the comparisons examined, the evaluators reported statistically significant positive results, for 50 percent of the comparisons the results were statistically significant in favor of the comparison group, and for 30 percent of the comparisons no significant difference were found. Overall, the mean score on these distributions was (.54, .07, .40), indicating that across all the studies, 54 percent of the comparisons favored the treatment, 7 percent favored the comparison group, and 40 percent showed no significant difference. Table 5-8 shows the comparison by curricular program types. We present the results by individual program types, because each program type relies on a similar program theory and hence could lead to patterns of results that would be lost in combining the data. If the studies of commercial materials are all grouped together to include UCSMP, their pattern of results is (.38, .11, .51). Again we emphasize that due to our call for increased methodological rigor and the use of multiple methods, this result is not sufficient to establish the curricular effectiveness of these programs as a whole with adequate certainty.
We caution readers that these results are summaries of the results presented across a set of evaluations that meet only the standard of at least
TABLE 5-8 Comparison by Curricular Program Types
minimally methodologically adequate . Calculations of statistical significance of each program’s results were reported by the evaluators; we have made no adjustments for weaknesses in the evaluations such as inappropriate use of units of analysis in calculating statistical significance. Evaluations that consistently used the correct unit of analysis, such as UCSMP, could have fewer reports of significant results as a consequence. Furthermore, these results are not weighted by study size. Within any study, the results pay no attention to comparative effect size or to the established credibility of an outcome measure. Similarly, these results do not take into account differences in the populations sampled, an important consideration in generalizing the results. For example, using the same set of studies as an example, UCSMP studies used volunteer samples who responded to advertisements in their newsletters, resulting in samples with disproportionately Caucasian subjects from wealthier schools compared to national samples. As a result, we would suggest that these results are useful only as baseline data for future evaluation efforts. Our purpose in calculating these results is to permit us to create filters from the critical decision points and test how the results change as one applies more rigorous standards.
Given that none of the studies adequately addressed all of the critical criteria, we do not offer these results as definitive, only suggestive—a hypothesis for further study. In effect, given the limitations of time and support, and the urgency of providing advice related to policy, we offer this filtering approach as an informal meta-analytic technique sufficient to permit us to address our primary task, namely, evaluating the quality of the evaluation studies.
This approach reflects the committee’s view that to deeply understand and improve methodology, it is necessary to scrutinize the results and to determine what inferences they provide about the conduct of future evaluations. Analogous to debates on consequential validity in testing, we argue that to strengthen methodology, one must consider what current methodologies are able (or not able) to produce across an entire series of studies. The remainder of the chapter is focused on considering in detail what claims are made by these studies, and how robust those claims are when subjected to challenge by alternative hypothesis, filtering by tests of increasing rigor, and examining results and patterns across the studies.
Alternative Hypotheses on Effectiveness
In the spirit of scientific rigor, the committee sought to consider rival hypotheses that could explain the data. Given the weaknesses in the designs generally, often these alternative hypotheses cannot be dismissed. However, we believed that only after examining the configuration of results and
alternative hypotheses can the next generation of evaluations be better informed and better designed. We began by generating alternative hypotheses to explain the positive directionality of the results in favor of experimental groups. Alternative hypotheses included the following:
The teachers in the experimental groups tended to be self-selecting early adopters, and thus able to achieve effects not likely in regular populations.
Changes in student outcomes reflect the effects of professional development instruction, or level of classroom support (in pilot sites), and thus inflate the predictions of effectiveness of curricular programs.
Hawthorne effect (Franke and Kaul, 1978) occurs when treatments are compared to everyday practices, due to motivational factors that influence experimental participants.
The consistent difference is due to the coherence and consistency of a single curricular program when compared to multiple programs.
The significance level is only achieved by the use of the wrong unit of analysis to test for significance.
Supplemental materials or new teaching techniques produce the results and not the experimental curricula.
Significant results reflect inadequate outcome measures that focus on a restricted set of activities.
The results are due to evaluator bias because too few evaluators are independent of the program developers.
At the same time, one could argue that the results actually underestimate the performance of these materials and are conservative measures, and their alternative hypotheses also deserve consideration:
Many standardized tests are not sensitive to these curricular approaches, and by eliminating studies focusing on affect, we eliminated a key indicator of the appeal of these curricula to students.
Poor implementation or increased demands on teachers’ knowledge dampens the effects.
Often in the experimental treatment, top-performing students are missing as they are advised to take traditional sequences, rendering the samples unequal.
Materials are not well aligned with universities and colleges because tests for placement and success in early courses focus extensively on algebraic manipulation.
Program implementation has been undercut by negative publicity and the fears of parents concerning change.
There are also a number of possible hypotheses that may be affecting the results in either direction, and we list a few of these:
Examining the role of the teacher in curricular decision making is an important element in effective implementation, and design mandates of evaluation design make this impossible (and the positives and negatives or single- versus dual-track curriculum as in Lundin, 2001).
Local tests that are sensitive to the curricular effects typically are not mandatory and hence may lead to unpredictable performance by students.
Different types and extent of professional development may affect outcomes differentially.
Persistence or attrition may affect the mean scores and are often not considered in the comparative analyses.
One could also generate reasons why the curricular programs produced results showing no significance when one program or the other is actually more effective. This could include high degrees of variability in the results, samples that used the correct unit of analysis but did not obtain consistent participation across enough cases, implementation that did not show enough fidelity to the measures, or outcome measures insensitive to the results. Again, subsequent designs should be better informed by these findings to improve the likelihood that they will produce less ambiguous results and replication of studies could also give more confidence in the findings.
It is beyond the scope of this report to consider each of these alternative hypotheses separately and to seek confirmation or refutation of them. However, in the next section, we describe a set of analyses carried out by the committee that permits us to examine and consider the impact of various critical evaluation design decisions on the patterns of outcomes across sets of studies. A number of analyses shed some light on various alternative hypotheses and may inform the conduct of future evaluations.
Filtering Studies by Critical Decision Points to Increase Rigor
In examining the comparative studies, we identified seven critical decision points that we believed would directly affect the rigor and efficacy of the study design. These decision points were used to create a set of 16 filters. These are listed as the following questions:
Was there a report on comparability relative to SES?
Was there a report on comparability of samples relative to prior knowledge?
Was there a report on treatment fidelity?
Was professional development reported on?
Was the comparative curriculum specified?
Was there any attempt to report on teacher effects?
Was a total test score reported?
Was total test score(s) disaggregated by content strand?
Did the outcome measures match the curriculum?
Were multiple tests used?
Was the appropriate unit of analysis used in their statistical tests?
Did they estimate effect size for the study?
Was the generalizability of their findings limited by use of a restricted range of ability levels?
Was the generalizability of their findings limited by use of pilot sites for their study?
Was the generalizability of their findings limited by not disaggregating their results by subgroup?
Was the generalizability of their findings limited by use of small sample size?
The studies were coded to indicate if they reported having addressed these considerations. In some cases, the decision points were coded dichotomously as present or absent in the studies, and in other cases, the decision points were coded trichotomously, as description presented, absent, or statistically adjusted for in the results. For example, a study may or may not report on the comparability of the samples in terms of race, ethnicity, or socioeconomic status. If a report on SES was given, the study was coded as “present” on this decision; if a report was missing, it was coded as “absent”; and if SES status or ethnicity was used in the analysis to actually adjust outcomes, it was coded as “adjusted for.” For each coding, the table that follows reports the number of studies that met that condition, and then reports on the mean percentage of statistically significant results, and results showing no significant difference for that set of studies. A significance test is run to see if the application of the filter produces changes in the probability that are significantly different. 5
In the cases in which studies are coded into three distinct categories—present, absent, and adjusted for—a second set of filters is applied. First, the studies coded as present or adjusted for are combined and compared to those coded as absent; this is what we refer to as a weak test of the rigor of the study. Second, the studies coded as present or absent are combined and compared to those coded as adjusted for. This is what we refer to as a strong test. For dichotomous codings, there can be as few as three compari-
sons, and for trichotomous codings, there can be nine comparisons with accompanying tests of significance. Trichotomous codes were used for adjustments for SES and prior knowledge, examining treatment fidelity, professional development, teacher effects, and reports on effect sizes. All others were dichotomous.
NSF Studies and the Filters
For example, there were 11 studies of NSF-supported curricula that simply reported on the issues of SES in creating equivalent samples for comparison, and for this subset the mean probabilities of getting positive, negative, or results showing no significant difference were (.47, .10, .43). If no report of SES was supplied (n= 21), those probabilities become (.57, .07, .37), indicating an increase in positive results and a decrease in results showing no significant difference. When an adjustment is made in outcomes based on differences in SES (n=14), the probabilities change to (.72, .00, .28), showing a higher likelihood of positive outcomes. The probabilities that result from filtering should always be compared back to the overall results of (.59, .06, .35) (see Table 5-8 ) so as to permit one to judge the effects of more rigorous methodological constraints. This suggests that a simple report on SES without adjustment is least likely to produce positive outcomes; that is, no report produces the outcomes next most likely to be positive and studies that adjusted for SES tend to have a higher proportion of their comparisons producing positive results.
The second method of applying the filter (the weak test for rigor) for the treatment of the adjustment of SES groups compares the probabilities when a report is either given or adjusted for compared to when no report is offered. The combined percentage of a positive outcome of a study in which SES is reported or adjusted for is (.61, .05, .34), while the percentage for no report remains as reported previously at (.57, .07, .37). A final filter compares the probabilities of the studies in which SES is adjusted for with those that either report it only or do not report it at all. Here we compare the percentage of (.72, .00, .28) to (.53, .08, .37) in what we call a strong test. In each case we compared the probability produced by the whole group to those of the filtered studies and conducted a test of the differences to determine if they were significant. These differences were not significant. These findings indicate that to date, with this set of studies, there is no statistically significant difference in results when one reports or adjusts for changes in SES. It appears that by adjusting for SES, one sees increases in the positive results, and this result deserves a closer examination for its implications should it prove to hold up over larger sets of studies.
We ran tests that report the impact of the filters on the number of studies, the percentage of studies, and the effects described as probabilities
for each of the three study categories, NSF-supported and commercially generated with UCSMP included. We claim that when a pattern of probabilities of results does not change after filtering, one can have more confidence in that pattern. When the pattern of results changes, there is a need for an explanatory hypothesis, and that hypothesis can shed light on experimental design. We propose that this “filtering process” constitutes a test of the robustness of the outcome measures subjected to increasing degrees of rigor by using filtering.
Results of Filtering on Evaluations of NSF-Supported Curricula
For the NSF-supported curricular programs, out of 15 filters, 5 produced a probability that differed significantly at the p<.1 level. The five filters were for treatment fidelity, specification of control group, choosing the appropriate statistical unit, generalizability for ability, and generalizability based on disaggregation by subgroup. For each filter, there were from three to nine comparisons, as we examined how the probabilities of outcomes change as tests were more stringent and across the categories of positive results, negative results, and results with no significant differences. Out of a total of 72 possible tests, only 11 produced a probability that differed significantly at the p < .1 level. With 85 percent of the comparisons showing no significant difference after filtering, we suggest the results of the studies were relatively robust in relation to these tests. At the same time, when rigor is increased for the five filters just listed, the results become generally more ambiguous and signal the need for further research with more careful designs.
Studies of Commercial Materials and the Filters
To ensure enough studies to conduct the analysis (n=17), our filtering analysis of the commercially generated studies included UCSMP (n=8). In this case, there were six filters that produced a probability that differed significantly at the p < .1 level. These were treatment fidelity, disaggregation by content, use of multiple tests, use of effect size, generalizability by ability, and generalizability by sample size. In this case, because there were no studies in some possible categories, there were a total of 57 comparisons, and 9 displayed significant differences in the probabilities after filtering at the p < .1 level. With 84 percent of the comparisons showing no significant difference after filtering, we suggest the results of the studies were relatively robust in relation to these tests. Table 5-9 shows the cases in which significant differences were recorded.
Impact of Treatment Fidelity on Probabilities
A few of these differences are worthy of comment. In the cases of both the NSF-supported and commercially generated curricula evaluation studies, studies that reported treatment fidelity differed significantly from those that did not. In the case of the studies of NSF-supported curricula, it appeared that a report or adjustment on treatment fidelity led to proportions with less positive effects and more results showing no significant differences. We hypothesize that this is partly because larger studies often do not examine actual classroom practices, but can obtain significance more easily due to large sample sizes.
In the studies of commercial materials, the presence or absence of measures of treatment fidelity worked differently. Studies reporting on or adjusting for treatment fidelity tended to have significantly higher probabilities in favor of experimental treatment, less positive effects in fewer of the comparative treatments, and more likelihood of results with no significant differences. We hypothesize, and confirm with a separate analysis, that this is because UCSMP frequently reported on treatment fidelity in their designs while study of Saxon typically did not, and the change represents the preponderance of these different curricular treatments in the studies of commercially generated materials.
Impact of Identification of Curricular Program on Probabilities
The significant differences reported under specificity of curricular comparison also merit discussion for studies of NSF-supported curricula. When the comparison group is not specified, a higher percentage of mean scores in favor of the experimental curricula is reported. In the studies of commercial materials, a failure to name specific curricular comparisons also produced a higher percentage of positive outcomes for the treatment, but the difference was not statistically significant. This suggests the possibility that when a specified curriculum is compared to an unspecified curriculum, reports of impact may be inflated. This finding may suggest that in studies of effectiveness, specifying comparative treatments would provide more rigorous tests of experimental approaches.
When studies of commercial materials disaggregate their results of content strands or use multiple measures, their reports of positive outcomes increase, the negative outcomes decrease, and in one case, the results show no significant differences. Percentage of significant difference was only recorded in one comparison within each one of these filters.
TABLE 5-9 Cases of Significant Differences
Impact of Units of Analysis on Probabilities 6
For the evaluations of the NSF-supported materials, a significant difference was reported on the outcomes for the studies that used the correct unit of analysis compared to those that did not. The percentage for those with the correct unit were (.30, .40, .30) compared to (.63, .01, .36) for those that used the incorrect result. These results suggest that our prediction that using the correct unit of analysis would decrease the percentage of positive outcomes is likely to be correct. It also suggests that the most serious threat to the apparent conclusions of these studies comes from selecting an incorrect unit of analysis. It causes a decrease in favorable results, making the results more ambiguous, but never reverses the direction of the effect. This is a concern that merits major attention in the conduct of further studies.
For the commercially generated studies, most of the ones coded with the correct unit of analysis were UCSMP studies. Because of the small number of studies involved, we could not break out from the overall filtering of studies of commercial materials, but report this issue to assist readers in interpreting the relative patterns of results.
Impact of Generalizability on Probabilities
Both types of studies yielded significant differences for some of the comparisons coded as restrictions to generalizability. Investigating these is important in order to understand the effects of these curricular programs on different subpopulations of students. In the case of the studies of commercially generated materials, significantly different results occurred in the categories of ability and sample size. In the studies of NSF-supported materials, the significant differences occurred in ability and disaggregation by subgroups.
In relation to generalizability, the studies of NSF-supported curricula reported significantly more positive results in favor of the treatment when they included all students. Because studies coded as “limited by ability” were restricted either by focusing only on higher achieving students or on lower achieving students, we sorted these two groups. For higher performing students (n=3), the probabilities of effects were (.11, .67, .22). For lower
performing students (n=2), the probabilities were (.39, .025, .59). The first two comparisons are significantly different at p < .05. These findings are based on only a total of five studies, but they suggest that these programs may be serving the weaker ability students more effectively than the stronger ability students, serving both less well than they serve whole heterogeneous groups. For the studies of commercial materials, there were only three studies that were restricted to limited populations. The results for those three studies were (.23, .41, .32) and for all students (n=14) were (.42, .53, .09). These studies were significantly different at p = .004. All three studies included UCSMP and one also included Saxon and was limited by serving primarily high-performing students. This means both categories of programs are showing weaker results when used with high-ability students.
Finally, the studies on NSF-supported materials were disaggregated by subgroups for 28 studies. A complete analysis of this set follows, but the studies that did not report results disaggregated by subgroup generated probabilities of results of (.48, .09, .43) whereas those that did disaggregate their results reported (.76, 0, .24). These gains in positive effects came from significant losses in reporting no significant differences. Studies of commercial materials also reported a small decrease in likelihood of negative effects for the comparison program when disaggregation by subgroup is reported offset by increases in positive results and results with no significant differences, although these comparisons were not significantly different. A further analysis of this topic follows.
Overall, these results suggest that increased rigor seems to lead in general to less strong outcomes, but never reports of completely contrary results. These results also suggest that in recommending design considerations to evaluators, there should be careful attention to having evaluators include measures of treatment fidelity, considering the impact on all students as well as one particular subgroup; using the correct unit of analysis; and using multiple tests that are also disaggregated by content strand.
Further Analyses
We conducted four further analyses: (1) an analysis of the outcome probabilities by test type; (2) content strands analysis; (3) equity analysis; and (4) an analysis of the interactions of content and equity by grade band. Careful attention to the issues of content strand, equity, and interaction is essential for the advancement of curricular evaluation. Content strand analysis provides the detail that is often lost by reporting overall scores; equity analysis can provide essential information on what subgroups are adequately served by the innovations, and analysis by content and grade level can shed light on the controversies that evolve over time.
Analysis by Test Type
Different studies used varied combinations of outcome measures. Because of the importance of outcome measures on test results, we chose to examine whether the probabilities for the studies changed significantly across different types of outcome measures (national test, local test). The most frequent use of tests across all studies was a combination of national and local tests (n=18 studies), a local test (n=16), and national tests (n=17). Other uses of test combinations were used by three studies or less. The percentages of various outcomes by test type in comparison to all studies are described in Table 5-10 .
These data ( Table 5-11 ) suggest that national tests tend to produce less positive results, and with the resulting gains falling into results showing no significant differences, suggesting that national tests demonstrate less curricular sensitivity and specificity.
TABLE 5-10 Percentage of Outcomes by Test Type
TABLE 5-11 Percentage of Outcomes by Test Type and Program Type
TABLE 5-12 Number of Studies That Disaggregated by Content Strand
Content Strand
Curricular effectiveness is not an all-or-nothing proposition. A curriculum may be effective in some topics and less effective in others. For this reason, it is useful for evaluators to include an analysis of curricular strands and to report on the performance of students on those strands. To examine this issue, we conducted an analysis of the studies that reported their results by content strand. Thirty-eight studies did this; the breakdown is shown in Table 5-12 by type of curricular program and grade band.
To examine the evaluations of these content strands, we began by listing all of the content strands reported across studies as well as the frequency of report by the number of studies at each grade band. These results are shown in Figure 5-11 , which is broken down by content strand, grade level, and program type.
Although there are numerous content strands, some of them were reported on infrequently. To allow the analysis to focus on the key results from these studies, we separated out the most frequently reported on strands, which we call the “major content strands.” We defined these as strands that were examined in at least 10 percent of the studies. The major content strands are marked with an asterisk in the Figure 5-11 . When we conduct analyses across curricular program types or grade levels, we use these to facilitate comparisons.
A second phase of our analysis was to examine the performance of students by content strand in the treatment group in comparison to the control groups. Our analysis was conducted across the major content strands at the level of NSF-supported versus commercially generated, initially by all studies and then by grade band. It appeared that such analysis permitted some patterns to emerge that might prove helpful to future evaluators in considering the overall effectiveness of each approach. To do this, we then coded the number of times any particular strand was measured across all studies that disaggregated by content strand. Then, we coded the proportion of times that this strand was reported as favoring the experimental treatment, favoring the comparative curricula, or showing no significant difference. These data are presented across the major content strands for the NSF-supported curricula ( Figure 5-12 ) and the commercially generated curricula, ( Figure 5-13 ) (except in the case of the elemen-
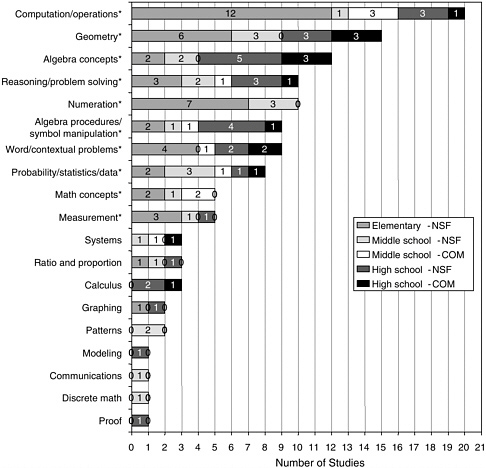
FIGURE 5-11 Study counts for all content strands.
tary curricula where no data were available) in the forms of percentages, with the frequencies listed in the bars.
The presentation of results by strands must be accompanied by the same restrictions as stated previously. These results are based on studies identified as at least minimally methodologically adequate. The quality of the outcome measures in measuring the content strands has not been examined. Their results are coded in relation to the comparison group in the study and are indicated as statistically in favor of the program, as in favor of the comparative program, or as showing no significant differences. The results are combined across studies with no weighting by study size. Their results should be viewed as a means for the identification of topics for potential future study. It is completely possible that a refinement of methodologies may affect the future patterns of results, so the results are to be viewed as tentative and suggestive.
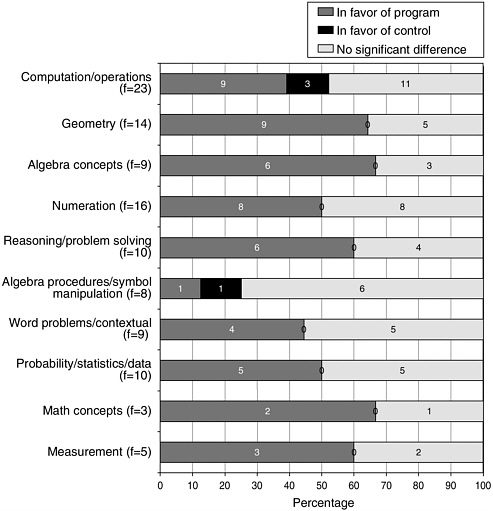
FIGURE 5-12 Major content strand result: All NSF (n=27).
According to these tentative results, future evaluations should examine whether the NSF-supported programs produce sufficient competency among students in the areas of algebraic manipulation and computation. In computation, approximately 40 percent of the results were in favor of the treatment group, no significant differences were reported in approximately 50 percent of the results, and results in favor of the comparison were revealed 10 percent of the time. Interpreting that final proportion of no significant difference is essential. Some would argue that because computation has not been emphasized, findings of no significant differences are acceptable. Others would suggest that such findings indicate weakness, because the development of the materials and accompanying professional development yielded no significant difference in key areas.
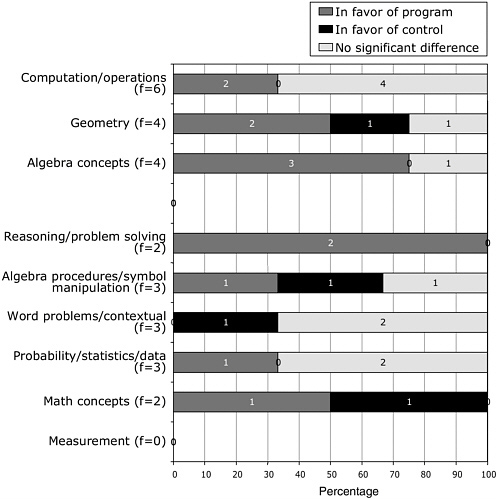
FIGURE 5-13 Major content strand result: All commercial (n=8).
From Figure 5-13 of findings from studies of commercially generated curricula, it appears that mixed results are commonly reported. Thus, in evaluations of commercial materials, lack of significant differences in computations/operations, word problems, and probability and statistics suggest that careful attention should be given to measuring these outcomes in future evaluations.
Overall, the grade band results for the NSF-supported programs—while consistent with the aggregated results—provide more detail. At the elementary level, evaluations of NSF-supported curricula (n=12) report better performance in mathematics concepts, geometry, and reasoning and problem solving, and some weaknesses in computation. No content strand analysis for commercially generated materials was possible. Evaluations
(n=6) at middle grades of NSF-supported curricula showed strength in measurement, geometry, and probability and statistics and some weaknesses in computation. In the studies of commercial materials, evaluations (n=4) reported favorable results in reasoning and problem solving and some unfavorable results in algebraic procedures, contextual problems, and mathematics concepts. Finally, at the high school level, the evaluations (n=9) by content strand for the NSF-supported curricula showed strong favorable results in algebra concepts, reasoning/problem solving, word problems, probability and statistics, and measurement. Results in favor of the control were reported in 25 percent of the algebra procedures and 33 percent of computation measures.
For the studies of commercial materials (n=4), only the geometry results favor the control group 25 percent of the time, with 50 percent having favorable results. Algebra concepts, reasoning, and probability and statistics also produced favorable results.
Equity Analysis of Comparative Studies
When the goal of providing a standards-based curriculum to all students was proposed, most people could recognize its merits: the replacement of dull, repetitive, largely dead-end courses with courses that would lead all students to be able, if desired and earned, to pursue careers in mathematics-reliant fields. It was clear that the NSF-supported projects, a stated goal of which was to provide standards-based courses to all students, called for curricula that would address the problem of too few students persisting in the study of mathematics. For example, as stated in the NSF Request for Proposals (RFP):
Rather than prematurely tracking students by curricular objectives, secondary school mathematics should provide for all students a common core of mainstream mathematics differentiated instructionally by level of abstraction and formalism, depth of treatment and pace (National Science Foundation, 1991, p. 1). In the elementary level solicitation, a similar statement on causes for all students was made (National Science Foundation, 1988, pp. 4-5).
Some, but not enough attention has been paid to the education of students who fall below the average of the class. On the other hand, because the above average students sometimes do not receive a demanding education, it may be incorrectly assumed they are easy to teach (National Science Foundation, 1989, p. 2).
Likewise, with increasing numbers of students in urban schools, and increased demographic diversity, the challenges of equity are equally significant for commercial publishers, who feel increasing pressures to demonstrate the effectiveness of their products in various contexts.
The problem was clearly identified: poorer performance by certain subgroups of students (minorities—non-Asian, LEP students, sometimes females) and a resulting lack of representation of such groups in mathematics-reliant fields. In addition, a secondary problem was acknowledged: Highly talented American students were not being provided adequate challenge and stimulation in comparison with their international counterparts. We relied on the concept of equity in examining the evaluation. Equity was contrasted to equality, where one assumed all students should be treated exactly the same (Secada et al., 1995). Equity was defined as providing opportunities and eliminating barriers so that the membership in a subgroup does not subject one to undue and systematically diminished possibility of success in pursuing mathematical study. Appropriate treatment therefore varies according to the needs of and obstacles facing any subgroup.
Applying the principles of equity to evaluate the progress of curricular programs is a conceptually thorny challenge. What is challenging is how to evaluate curricular programs on their progress toward equity in meeting the needs of a diverse student body. Consider how the following questions provide one with a variety of perspectives on the effectiveness of curricular reform regarding equity:
Does one expect all students to improve performance, thus raising the bar, but possibly not to decrease the gap between traditionally well-served and under-served students?
Does one focus on reducing the gap and devote less attention to overall gains, thus closing the gap but possibly not raising the bar?
Or, does one seek evidence that progress is made on both challenges—seeking progress for all students and arguably faster progress for those most at risk?
Evaluating each of the first two questions independently seems relatively straightforward. When one opts for a combination of these two, the potential for tensions between the two becomes more evident. For example, how can one differentiate between the case in which the gap is closed because talented students are being underchallenged from the case in which the gap is closed because the low-performing students improved their progress at an increased rate? Many believe that nearly all mathematics curricula in this country are insufficiently challenging and rigorous. Therefore achieving modest gains across all ability levels with evidence of accelerated progress by at-risk students may still be criticized for failure to stimulate the top performing student group adequately. Evaluating curricula with regard to this aspect therefore requires judgment and careful methodological attention.
Depending on one’s view of equity, different implications for the collection of data follow. These considerations made examination of the quality of the evaluations as they treated questions of equity challenging for the committee members. Hence we spell out our assumptions as precisely as possible:
Evaluation studies should include representative samples of student demographics, which may require particular attention to the inclusion of underrepresented minority students from lower socioeconomic groups, females, and special needs populations (LEP, learning disabled, gifted and talented students) in the samples. This may require one to solicit participation by particular schools or districts, rather than to follow the patterns of commercial implementation, which may lead to an unrepresentative sample in aggregate.
Analysis of results should always consider the impact of the program on the entire spectrum of the sample to determine whether the overall gains are distributed fairly among differing student groups, and not achieved as improvements in the mean(s) of an identifiable subpopulation(s) alone.
Analysis should examine whether any group of students is systematically less well served by curricular implementation, causing losses or weakening the rate of gains. For example, this could occur if one neglected the continued development of programs for gifted and talented students in mathematics in order to implement programs focused on improving access for underserved youth, or if one improved programs solely for one group of language learners, ignoring the needs of others, or if one’s study systematically failed to report high attrition affecting rates of participation of success or failure.
Analyses should examine whether gaps in scores between significantly disadvantaged or underperforming subgroups and advantaged subgroups are decreasing both in relation to eliminating the development of gaps in the first place and in relation to accelerating improvement for underserved youth relative to their advantaged peers at the upper grades.
In reviewing the outcomes of the studies, the committee reports first on what kinds of attention to these issues were apparent in the database, and second on what kinds of results were produced. Some of the studies used multiple methods to provide readers with information on these issues. In our report on the evaluations, we both provide descriptive information on the approaches used and summarize the results of those studies. Developing more effective methods to monitor the achievement of these objectives may need to go beyond what is reported in this study.
Among the 63 at least minimally methodologically adequate studies, 26 reported on the effects of their programs on subgroups of students. The
TABLE 5-13 Most Common Subgroups Used in the Analyses and the Number of Studies That Reported on That Variable
other 37 reported on the effects of the curricular intervention on means of whole groups and their standard deviations, but did not report on their data in terms of the impact on subpopulations. Of those 26 evaluations, 19 studies were on NSF-supported programs and 7 were on commercially generated materials. Table 5-13 reports the most common subgroups used in the analyses and the number of studies that reported on that variable. Because many studies used multiple categories for disaggregation (ethnicity, SES, and gender), the number of reports is more than double the number of studies. For this reason, we report the study results in terms of the “frequency of reports on a particular subgroup” and distinguish this from what we refer to as “study counts.” The advantage of this approach is that it permits reporting on studies that investigated multiple ways to disaggregate their data. The disadvantage is that in a sense, studies undertaking multiple disaggregations become overrepresented in the data set as a result. A similar distinction and approach were used in our treatment of disaggregation by content strands.
It is apparent from these data that the evaluators of NSF-supported curricula documented more equity-based outcomes, as they reported 43 of the 56 comparisons. However, the same percentage of the NSF-supported evaluations disaggregated their results by subgroup, as did commercially generated evaluations (41 percent in both cases). This is an area where evaluations of curricula could benefit greatly from standardization of ex-
pectation and methodology. Given the importance of the topic of equity, it should be standard practice to include such analyses in evaluation studies.
In summarizing these 26 studies, the first consideration was whether representative samples of students were evaluated. As we have learned from medical studies, if conclusions on effectiveness are drawn without careful attention to representativeness of the sample relative to the whole population, then the generalizations drawn from the results can be seriously flawed. In Chapter 2 we reported that across the studies, approximately 81 percent of the comparative studies and 73 percent of the case studies reported data on school location (urban, suburban, rural, or state/region), with suburban students being the largest percentage in both study types. The proportions of students studied indicated a tendency to undersample urban and rural populations and oversample suburban schools. With a high concentration of minorities and lower SES students in these areas, there are some concerns about the representativeness of the work.
A second consideration was to see whether the achievement effects of curricular interventions were achieved evenly among the various subgroups. Studies answered this question in different ways. Most commonly, evaluators reported on the performance of various subgroups in the treatment conditions as compared to those same subgroups in the comparative condition. They reported outcome scores or gains from pretest to posttest. We refer to these as “between” comparisons.
Other studies reported on the differences among subgroups within an experimental treatment, describing how well one group does in comparison with another group. Again, these reports were done in relation either to outcome measures or to gains from pretest to posttest. Often these reports contained a time element, reporting on how the internal achievement patterns changed over time as a curricular program was used. We refer to these as “within” comparisons.
Some studies reported both between and within comparisons. Others did not report findings by comparing mean scores or gains, but rather created regression equations that predicted the outcomes and examined whether demographic characteristics are related to performance. Six studies (all on NSF-supported curricula) used this approach with variables related to subpopulations. Twelve studies used ANCOVA or Multiple Analysis of Variance (MANOVA) to study disaggregation by subgroup, and two reported on comparative effect sizes. In the studies using statistical tests other than t-tests or Chi-squares, two were evaluations of commercially generated materials and the rest were of NSF-supported materials.
Of the studies that reported on gender (n=19), the NSF-supported ones (n=13) reported five cases in which the females outperformed their counterparts in the controls and one case in which the female-male gap decreased within the experimental treatments across grades. In most cases, the studies
present a mixed picture with some bright spots, with the majority showing no significant difference. One study reported significant improvements for African-American females.
In relation to race, 15 of 16 reports on African Americans showed positive effects in favor of the treatment group for NSF-supported curricula. Two studies reported decreases in the gaps between African Americans and whites or Asians. One of the two evaluations of African Americans, performance reported for the commercially generated materials, showed significant positive results, as mentioned previously.
For Hispanic students, 12 of 15 reports of the NSF-supported materials were significantly positive, with the other 3 showing no significant difference. One study reported a decrease in the gaps in favor of the experimental group. No evaluations of commercially generated materials were reported on Hispanic populations. Other reports on ethnic groups occurred too seldom to generalize.
Students from lower socioeconomic groups fared well, according to reported evaluations of NSF-supported materials (n=8), in that experimental groups outperformed control groups in all but one case. The one study of commercially generated materials that included SES as a variable reported no significant difference. For students with limited English proficiency, of the two evaluations of NSF-supported materials, one reported significantly more positive results for the experimental treatment. Likewise, one study of commercially generated materials yielded a positive result at the elementary level.
We also examined the data for ability differences and found reports by quartiles for a few evaluation studies. In these cases, the evaluations showed results across quartiles in favor of the NSF-supported materials. In one case using the same program, the lower quartiles showed the most improvement, and in the other, the gains were in the middle and upper groups for the Iowa Test of Basic Skills and evenly distributed for the informal assessment.
Summary Statements
After reviewing these studies, the committee observed that examining differences by gender, race, SES, and performance levels should be examined as a regular part of any review of effectiveness. We would recommend that all comparative studies report on both “between” and “within” comparisons so that the audience of an evaluation can simply and easily consider the level of improvement, its distribution across subgroups, and the impact of curricular implementation on any gaps in performance. Each of the major categories—gender, race/ethnicity, SES, and achievement level—contributes a significant and contrasting view of curricular impact. Further-
more, more sophisticated accounts would begin to permit, across studies, finer distinctions to emerge, such as the effect of a program on young African-American women or on first generation Asian students.
In addition, the committee encourages further study and deliberation on the use of more complex approaches to the examination of equity issues. This is particularly important due to the overlaps among these categories, where poverty can show itself as its own variable but also may be highly correlated to prior performance. Hence, the use of one variable can mask differences that should be more directly attributable to another. The committee recommends that a group of measurement and equity specialists confer on the most effective design to advance on these questions.
Finally, it is imperative that evaluation studies systematically include demographically representative student populations and distinguish evaluations that follow the commercial patterns of use from those that seek to establish effectiveness with a diverse student population. Along these lines, it is also important that studies report on the impact data on all substantial ethnic groups, including whites. Many studies, perhaps because whites were the majority population, failed to report on this ethnic group in their analyses. As we saw in one study, where Asian students were from poor homes and first generation, any subgroup can be an at-risk population in some setting, and because gains in means may not necessarily be assumed to translate to gains for all subgroups or necessarily for the majority subgroup. More complete and thorough descriptions and configurations of characteristics of the subgroups being served at any location—with careful attention to interactions—is needed in evaluations.
Interactions Among Content and Equity, by Grade Band
By examining disaggregation by content strand by grade levels, along with disaggregation by diverse subpopulations, the committee began to discover grade band patterns of performance that should be useful in the conduct of future evaluations. Examining each of these issues in isolation can mask some of the overall effects of curricular use. Two examples of such analysis are provided. The first example examines all the evaluations of NSF-supported curricula from the elementary level. The second examines the set of evaluations of NSF-supported curricula at the high school level, and cannot be carried out on evaluations of commercially generated programs because they lack disaggregation by student subgroup.
Example One
At the elementary level, the findings of the review of evaluations of data on effectiveness of NSF-supported curricula report consistent patterns of
benefits to students. Across the studies, it appears that positive results are enhanced when accompanied by adequate professional development and the use of pedagogical methods consistent with those indicated by the curricula. The benefits are most consistently evidenced in the broadening topics of geometry, measurement, probability, and statistics, and in applied problem solving and reasoning. It is important to consider whether the outcome measures in these areas demonstrate a depth of understanding. In early understanding of fractions and algebra, there is some evidence of improvement. Weaknesses are sometimes reported in the areas of computational skills, especially in the routinization of multiplication and division. These assertions are tentative due to the possible flaws in designs but quite consistent across studies, and future evaluations should seek to replicate, modify, or discredit these results.
The way to most efficiently and effectively link informal reasoning and formal algorithms and procedures is an open question. Further research is needed to determine how to most effectively link the gains and flexibility associated with student-generated reasoning to the automaticity and generalizability often associated with mastery of standard algorithms.
The data from these evaluations at the elementary level generally present credible evidence of increased success in engaging minority students and students in poverty based on reported gains that are modestly higher for these students than for the comparative groups. What is less well documented in the studies is the extent to which the curricula counteract the tendencies to see gaps emerge and result in long-term persistence in performance by gender and minority group membership as they move up the grades. However, the evaluations do indicate that these curricula can help, and almost never do harm. Finally, on the question of adequate challenge for advanced and talented students, the data are equivocal. More attention to this issue is needed.
Example Two
The data at the high school level produced the most conflicting results, and in conducting future evaluations, evaluators will need to examine this level more closely. We identify the high school as the crucible for curricular change for three reasons: (1) the transition to postsecondary education puts considerable pressure on these curricula; (2) the criteria outlined in the NSF RFP specify significant changes from traditional practice; and (3) high school freshmen arrive from a myriad of middle school curricular experiences. For the NSF-supported curricula, the RFP required that the programs provide a core curriculum “drawn from statistics/probability, algebra/functions, geometry/trigonometry, and discrete mathematics” (NSF, 1991, p. 2) and use “a full range of tools, including graphing calculators
and computers” (NSF, 1991, p. 2). The NSF RFP also specified the inclusion of “situations from the natural and social sciences and from other parts of the school curriculum as contexts for developing and using mathematics” (NSF, 1991, p. 1). It was during the fourth year that “course options should focus on special mathematical needs of individual students, accommodating not only the curricular demands of the college-bound but also specialized applications supportive of the workplace aspirations of employment-bound students” (NSF, 1991, p. 2). Because this set of requirements comprises a significant departure from conventional practice, the implementation of the high school curricula should be studied in particular detail.
We report on a Systemic Initiative for Montana Mathematics and Science (SIMMS) study by Souhrada (2001) and Brown et al. (1990), in which students were permitted to select traditional, reform, and mixed tracks. It became apparent that the students were quite aware of the choices they faced, as illustrated in the following quote:
The advantage of the traditional courses is that you learn—just math. It’s not applied. You get a lot of math. You may not know where to use it, but you learn a lot…. An advantage in SIMMS is that the kids in SIMMS tell me that they really understand the math. They understand where it comes from and where it is used.
This quote succinctly captures the tensions reported as experienced by students. It suggests that student perceptions are an important source of evidence in conducting evaluations. As we examined these curricular evaluations across the grades, we paid particular attention to the specificity of the outcome measures in relation to curricular objectives. Overall, a review of these studies would lead one to draw the following tentative summary conclusions:
There is some evidence of discontinuity in the articulation between high school and college, resulting from the organization and emphasis of the new curricula. This discontinuity can emerge in scores on college admission tests, placement tests, and first semester grades where nonreform students have shown some advantage on typical college achievement measures.
The most significant areas of disadvantage seem to be in students’ facility with algebraic manipulation, and with formalization, mathematical structure, and proof when isolated from context and denied technological supports. There is some evidence of weakness in computation and numeration, perhaps due to reliance on calculators and varied policies regarding their use at colleges (Kahan, 1999; Huntley et al., 2000).
There is also consistent evidence that the new curricula present
strengths in areas of solving applied problems, the use of technology, new areas of content development such as probability and statistics and functions-based reasoning in the use of graphs, using data in tables, and producing equations to describe situations (Huntley et al., 2000; Hirsch and Schoen, 2002).
Despite early performance on standard outcome measures at the high school level showing equivalent or better performance by reform students (Austin et al., 1997; Merlino and Wolff, 2001), the common standardized outcome measures (Preliminary Scholastic Assessment Test [PSAT] scores or national tests) are too imprecise to determine with more specificity the comparisons between the NSF-supported and comparison approaches, while program-generated measures lack evidence of external validity and objectivity. There is an urgent need for a set of measures that would provide detailed information on specific concepts and conceptual development over time and may require use as embedded as well as summative assessment tools to provide precise enough data on curricular effectiveness.
The data also report some progress in strengthening the performance of underrepresented groups in mathematics relative to their counterparts in the comparative programs (Schoen et al., 1998; Hirsch and Schoen, 2002).
This reported pattern of results should be viewed as very tentative, as there are only a few studies in each of these areas, and most do not adequately control for competing factors, such as the nature of the course received in college. Difficulties in the transition may also be the result of a lack of alignment of measures, especially as placement exams often emphasize algebraic proficiencies. These results are presented only for the purpose of stimulating further evaluation efforts. They further emphasize the need to be certain that such designs examine the level of mathematical reasoning of students, particularly in relation to their knowledge of understanding of the role of proofs and definitions and their facility with algebraic manipulation as we as carefully document the competencies taught in the curricular materials. In our framework, gauging the ease of transition to college study is an issue of examining curricular alignment with systemic factors, and needs to be considered along with those tests that demonstrate a curricular validity of measures. Furthermore, the results raising concerns about college success need replication before secure conclusions are drawn.
Also, it is important that subsequent evaluations also examine curricular effects on students’ interest in mathematics and willingness to persist in its study. Walker (1999) reported that there may be some systematic differences in these behaviors among different curricula and that interest and persistence may help students across a variety of subgroups to survive entry-level hurdles, especially if technical facility with symbol manipulation
can be improved. In the context of declines in advanced study in mathematics by American students (Hawkins, 2003), evaluation of curricular impact on students’ interest, beliefs, persistence, and success are needed.
The committee takes the position that ultimately the question of the impact of different curricula on performance at the collegiate level should be resolved by whether students are adequately prepared to pursue careers in mathematical sciences, broadly defined, and to reason quantitatively about societal and technological issues. It would be a mistake to focus evaluation efforts solely or primarily on performance on entry-level courses, which can clearly function as filters and may overly emphasize procedural competence, but do not necessarily represent what concepts and skills lead to excellence and success in the field.
These tentative patterns of findings indicate that at the high school level, it is necessary to conduct individual evaluations that examine the transition to college carefully in order to gauge the level of success in preparing students for college entry and the successful negotiation of majors. Equally, it is imperative to examine the impact of high school curricula on other possible student trajectories, such as obtaining high school diplomas, moving into worlds of work or through transitional programs leading to technical training, two-year colleges, and so on.
These two analyses of programs by grade-level band, content strand, and equity represent a methodological innovation that could strengthen the empirical database on curricula significantly and provide the level of detail really needed by curriculum designers to improve their programs. In addition, it appears that one could characterize the NSF programs (and not the commercial programs as a group) as representing a particular approach to curriculum, as discussed in Chapter 3 . It is an approach that integrates content strands; relies heavily on the use of situations, applications, and modeling; encourages the use of technology; and has a significant dose of mathematical inquiry. One could ask the question of whether this approach as a whole is “effective.” It is beyond the charge and scope of this report, but is a worthy target of investigation if one uses proper care in design, execution, and analysis. Likewise other approaches to curricular change should be investigated at the aggregate level, using careful and rigorous design.
The committee believes that a diversity of curricular approaches is a strength in an educational system that maintains local and state control of curricular decision making. While “scientifically established as effective” should be an increasingly important consideration in curricular choice, local cultural differences, needs, values, and goals will also properly influence curricular choice. A diverse set of effective curricula would be ideal. Finally, the committee emphasizes once again the importance of basing the studies on measures with established curricular validity and avoiding cor-
ruption of indicators as a result of inappropriate amounts of teaching to the test, so as to be certain that the outcomes are the product of genuine student learning.
CONCLUSIONS FROM THE COMPARATIVE STUDIES
In summary, the committee reviewed a total of 95 comparative studies. There were more NSF-supported program evaluations than commercial ones, and the commercial ones were primarily on Saxon or UCSMP materials. Of the 19 curricular programs reviewed, 23 percent of the NSF-supported and 33 percent of the commercially generated materials selected had programs with no comparative reviews. This finding is particularly disturbing in light of the legislative mandate in No Child Left Behind (U.S. Department of Education, 2001) for scientifically based curricular programs and materials to be used in the schools. It suggests that more explicit protocols for the conduct of evaluation of programs that include comparative studies need to be required and utilized.
Sixty-nine percent of NSF-supported and 61 percent of commercially generated program evaluations met basic conditions to be classified as at least minimally methodologically adequate studies for the evaluation of effectiveness. These studies were ones that met the criteria of including measures of student outcomes on mathematical achievement, reporting a method of establishing comparability among samples and reporting on implementation elements, disaggregating by content strand, or using precise, theoretical analyses of the construct or multiple measures.
Most of these studies had both strengths and weaknesses in their quasi-experimental designs. The committee reviewed the studies and found that evaluators had developed a number of features that merit inclusions in future work. At the same time, many had internal threats to validity that suggest a need for clearer guidelines for the conduct of comparative evaluations.
Many of the strengths and innovations came from the evaluators’ understanding of the program theories behind the curricula, their knowledge of the complexity of practice, and their commitment to measuring valid and significant mathematical ideas. Many of the weaknesses came from inadequate attention to experimental design, insufficient evidence of the independence of evaluators in some studies, and instability and lack of cooperation in interfacing with the conditions of everyday practice.
The committee identified 10 elements of comparative studies needed to establish a basis for determining the effectiveness of a curriculum. We recognize that not all studies will be able to implement successfully all elements, and those experimental design variations will be based largely on study size and location. The list of elements begins with the seven elements
corresponding to the seven critical decisions and adds three additional elements that emerged as a result of our review:
A better balance needs to be achieved between experimental and quasi-experimental studies. The virtual absence of large-scale experimental studies does not provide a way to determine whether the use of quasi-experimental approaches is being systematically biased in unseen ways.
If a quasi-experimental design is selected, it is necessary to establish comparability. When quasi-experimentation is used, it “pertains to studies in which the model to describe effects of secondary variables is not known but assumed” (NRC, 1992, p. 18). This will lead to weaker and potentially suspect causal claims, which should be acknowledged in the evaluation report, but may be necessary in relation to feasibility (Joint Committee on Standards for Educational Evaluation, 1994). In general, to date, studies have assumed prior achievement measures, ethnicity, gender, and SES, are acceptable variables on which to match samples or on which to make statistical adjustments. But there are often other variables in need of such control in such evaluations including opportunity to learn, teacher effectiveness, and implementation (see #4 below).
The selection of a unit of analysis is of critical importance to the design. To the extent possible, it is useful to randomly assign the unit for the different curricula. The number of units of analysis necessary for the study to establish statistical significance depends not on the number of students, but on this unit of analysis. It appears that classrooms and schools are the most likely units of analysis. In addition, the development of increasingly sophisticated means of conducting studies that recognize that the level of the educational system in which experimentation occurs affects research designs.
It is essential to examine the implementation components through a set of variables that include the extent to which the materials are implemented, teaching methods, the use of supplemental materials, professional development resources, teacher background variables, and teacher effects. Gathering these data to gauge the level of implementation fidelity is essential for evaluators to ensure adequate implementation. Studies could also include nested designs to support analysis of variation by implementation components.
Outcome data should include a variety of measures of the highest quality. These measures should vary by question type (open ended, multiple choice), by type of test (international, national, local) and by relation of testing to everyday practice (formative, summative, high stakes), and ensure curricular validity of measures and assess curricular alignment with systemic factors. The use of comparisons among total tests, fair tests, and
conservative tests, as done in the evaluations of UCSMP, permits one to gain insight into teacher effects and to contrast test results by items included. Tests should also include content strands to aid disaggregation, at a level of major content strands (see Figure 5-11 ) and content-specific items relevant to the experimental curricula.
Statistical analysis should be conducted on the appropriate unit of analysis and should include more sophisticated methods of analysis such as ANOVA, ANCOVA, MACOVA, linear regression, and multiple regression analysis as appropriate.
Reports should include clear statements of the limitations to generalization of the study. These should include indications of limitations in populations sampled, sample size, unique population inclusions or exclusions, and levels of use or attrition. Data should also be disaggregated by gender, race/ethnicity, SES, and performance levels to permit readers to see comparative gains across subgroups both between and within studies.
It is useful to report effect sizes. It is also useful to present item-level data across treatment program and show when performances between the two groups are within the 10 percent confidence interval of each other. These two extremes document how crucial it is for curricula developers to garner both precise and generalizable information to inform their revisions.
Careful attention should also be given to the selection of samples of populations for participation. These samples should be representative of the populations to whom one wants to generalize the results. Studies should be clear if they are generalizing to groups who have already selected the materials (prior users) or to populations who might be interested in using the materials (demographically representative).
The control group should use an identified comparative curriculum or curricula to avoid comparisons to unstructured instruction.
In addition to these prototypical decisions to be made in the conduct of comparative studies, the committee suggests that it would be ideal for future studies to consider some of the overall effects of these curricula and to test more directly and rigorously some of the findings and alternative hypotheses. Toward this end, the committee reported the tentative findings of these studies by program type. Although these results are subject to revision, based on the potential weaknesses in design of many of the studies summarized, the form of analysis demonstrated in this chapter provides clear guidance about the kinds of knowledge claims and the level of detail that we need to be able to judge effectiveness. Until we are able to achieve an array of comparative studies that provide valid and reliable information on these issues, we will be vulnerable to decision making based excessively on opinion, limited experience, and preconceptions.
This book reviews the evaluation research literature that has accumulated around 19 K-12 mathematics curricula and breaks new ground in framing an ambitious and rigorous approach to curriculum evaluation that has relevance beyond mathematics. The committee that produced this book consisted of mathematicians, mathematics educators, and methodologists who began with the following charge:
- Evaluate the quality of the evaluations of the thirteen National Science Foundation (NSF)-supported and six commercially generated mathematics curriculum materials;
- Determine whether the available data are sufficient for evaluating the efficacy of these materials, and if not;
- Develop recommendations about the design of a project that could result in the generation of more reliable and valid data for evaluating such materials.
The committee collected, reviewed, and classified almost 700 studies, solicited expert testimony during two workshops, developed an evaluation framework, established dimensions/criteria for three methodologies (content analyses, comparative studies, and case studies), drew conclusions on the corpus of studies, and made recommendations for future research.
Welcome to OpenBook!
You're looking at OpenBook, NAP.edu's online reading room since 1999. Based on feedback from you, our users, we've made some improvements that make it easier than ever to read thousands of publications on our website.
Do you want to take a quick tour of the OpenBook's features?
Show this book's table of contents , where you can jump to any chapter by name.
...or use these buttons to go back to the previous chapter or skip to the next one.
Jump up to the previous page or down to the next one. Also, you can type in a page number and press Enter to go directly to that page in the book.
Switch between the Original Pages , where you can read the report as it appeared in print, and Text Pages for the web version, where you can highlight and search the text.
To search the entire text of this book, type in your search term here and press Enter .
Share a link to this book page on your preferred social network or via email.
View our suggested citation for this chapter.
Ready to take your reading offline? Click here to buy this book in print or download it as a free PDF, if available.
Get Email Updates
Do you enjoy reading reports from the Academies online for free ? Sign up for email notifications and we'll let you know about new publications in your areas of interest when they're released.
Thank you for visiting nature.com. You are using a browser version with limited support for CSS. To obtain the best experience, we recommend you use a more up to date browser (or turn off compatibility mode in Internet Explorer). In the meantime, to ensure continued support, we are displaying the site without styles and JavaScript.
- View all journals
- My Account Login
- Explore content
- About the journal
- Publish with us
- Sign up for alerts
- Open access
- Published: 25 February 2020
Writing impact case studies: a comparative study of high-scoring and low-scoring case studies from REF2014
- Bella Reichard ORCID: orcid.org/0000-0001-5057-4019 1 ,
- Mark S Reed 1 ,
- Jenn Chubb 2 ,
- Ged Hall ORCID: orcid.org/0000-0003-0815-2925 3 ,
- Lucy Jowett ORCID: orcid.org/0000-0001-7536-3429 4 ,
- Alisha Peart 4 &
- Andrea Whittle 1
Palgrave Communications volume 6 , Article number: 31 ( 2020 ) Cite this article
23k Accesses
14 Citations
84 Altmetric
Metrics details
- Language and linguistics
This paper reports on two studies that used qualitative thematic and quantitative linguistic analysis, respectively, to assess the content and language of the largest ever sample of graded research impact case studies, from the UK Research Excellence Framework 2014 (REF). The paper provides the first empirical evidence across disciplinary main panels of statistically significant linguistic differences between high- versus low-scoring case studies, suggesting that implicit rules linked to written style may have contributed to scores alongside the published criteria on the significance, reach and attribution of impact. High-scoring case studies were more likely to provide specific and high-magnitude articulations of significance and reach than low-scoring cases. High-scoring case studies contained attributional phrases which were more likely to attribute research and/or pathways to impact, and they were written more coherently (containing more explicit causal connections between ideas and more logical connectives) than low-scoring cases. High-scoring case studies appear to have conformed to a distinctive new genre of writing, which was clear and direct, and often simplified in its representation of causality between research and impact, and less likely to contain expressions of uncertainty than typically associated with academic writing. High-scoring case studies in two Main Panels were significantly easier to read than low-scoring cases on the Flesch Reading Ease measure, although both high-scoring and low-scoring cases tended to be of “graduate” reading difficulty. The findings of our work enable impact case study authors to better understand the genre and make content and language choices that communicate their impact as effectively as possible. While directly relevant to the assessment of impact in the UK’s Research Excellence Framework, the work also provides insights of relevance to institutions internationally who are designing evaluation frameworks for research impact.
Research impact evaluation and academic discourse
Marta Natalia Wróblewska

Demystifying the process of scholarly peer-review: an autoethnographic investigation of feedback literacy of two award-winning peer reviewers
Sin Wang Chong & Shannon Mason

Aspiring to greater intellectual humility in science
Rink Hoekstra & Simine Vazire
Introduction
Academics are under increasing pressure to engage with non-academic actors to generate “usable” knowledge that benefits society and addresses global challenges (Clark et al., 2016 ; Lemos, 2015 ; Rau et al., 2018 ). This is largely driven by funders and governments that seek to justify the societal value of public funding for research (Reed et al., 2020 ; Smith et al., 2011 ) often characterised as ‘impact’. While this has sometimes been defined narrowly as reflective of the need to demonstrate a return on public investment in research (Mårtensson et al., 2016 ; Tsey et al., 2016 ; Warry, 2006 ), there is also a growing interest in the evaluation of “broader impacts” from research (cf. Bozeman and Youtie, 2017 ; National Science Foundation, 2014 ), including less tangible but arguably equally relevant benefits for society and culture. This shift is exemplified by the assessment of impact in the UK’s Research Excellence Framework (REF) in 2014 and 2021, the system for assessing the quality of research in UK higher education institutions, and in the rise of similar policies and evaluation systems in Australia, Hong Kong, the United States, Horizon Europe, The Netherlands, Sweden, Italy, Spain and elsewhere (Reed et al., 2020 ).
The evaluation of research impact in the UK has been criticised by scholars largely for its association with a ‘market logic’ (Olssen and Peters, 2005 ; Rhoads and Torres, 2005 ). Critics argue that a focus of academic performativity can be seen to “destabilise” professional identities (Chubb and Watermeyer, 2017 ), which in the context of research impact evaluation can further “dehumanise and deprofessionalise” academic performance (Watermeyer, 2019 ), whilst leading to negative unintended consequences (which Derrick et al., 2018 , called “grimpact”). MacDonald ( 2017 ), Chubb and Reed ( 2018 ) and Weinstein et al. ( 2019 ) reported concerns from researchers that the impact agenda may be distorting research priorities, “encourag[ing] less discovery-led research” (Weinstein et al., 2019 , p. 94), though these concerns were questioned by University managers in the same study who were reported to “not have enough evidence to support that REF was driving specific research agendas in either direction” (p. 94), and further questioned by Hill ( 2016 ).
Responses to this critique have been varied. Some have called for civil disobedience (Watermeyer, 2019 ) and organised resistance (Back, 2015 ; MacDonald, 2017 ) against the impact agenda. In a review of Watermeyer ( 2019 ), Reed ( 2019 ) suggested that attitudes towards the neoliberal political roots of the impact agenda may vary according to the (political) values and beliefs of researchers, leading them to pursue impacts that either support or oppose neoliberal political and corporate interests. Some have defended the benefits of research impact evaluation. For example, Weinstein et al. ( 2019 ) found that “a focus on changing the culture outside of academia is broadly valued” by academics and managers. The impact agenda might enhance stakeholder engagement (Hill, 2016 ) and give “new currency” to applied research (Chubb, 2017 ; Watermeyer, 2019 ). Others have highlighted the long-term benefits for society of incentivising research impact, including increased public support and funding for a more accountable, outward-facing research system (Chubb and Reed, 2017 ; Hill, 2016 ; Nesta, 2018 ; Oancea, 2010 , 2014 ; Wilsdon et al., 2015 ).
In the UK REF, research outputs and impact are peer reviewed at disciplinary level in ‘Units of Assessment’ (36 in 2014, 34 in 2021), grouped into four ‘Main Panels’. Impact is assessed through case studies that describe the effects of academic research and are given a score between 1* (“recognised but modest”) and 4* (“outstanding”). The case studies follow a set structure of five sections: 1—Summary of the impact; 2—Underpinning research; 3—References to the research; 4—Details of the impact; 5—Sources to corroborate the impact (HEFCE, 2011 ). The publication of over 6000 impact case studies in 2014 Footnote 1 by Research England (formerly Higher Education Funding Council for England, HEFCE) was unique in terms of its size, and unlike the recent selective publication of high-scoring case studies from Australia’s 2018 Engagement and Impact Assessment, both high-scoring and low-scoring case studies were published. This provides a unique opportunity to evaluate the construction of case studies that were perceived by evaluation panels to have successfully demonstrated impact, as evidenced by a 4* rating, and to compare these to case studies that were judged as less successful.
The analysis of case studies included in this research is based on the definition of impact used in REF2014, as “an effect on, change or benefit to the economy, society, culture, public policy or services, health, the environment or quality of life, beyond academia” (HEFCE, 2011 , p. 26). According to REF2014 guidance, the primary functions of an impact case study were to articulate and evidence the significance and reach of impacts arising from research beyond academia, clearly demonstrating the contribution that research from a given institution contributed to those impacts (HEFCE, 2011 ).
In addition to these explicit criteria driving the evaluation of impact in REF2014, a number of analyses have emphasised the role of implicit criteria and subjectivity in shaping the evaluation of impact. For example, Pidd and Broadbent ( 2015 ) emphasised the implicit role a “strong narrative” plays in high-scoring case studies (p. 575). This was echoed by the fears of one REF2014 panellist interviewed by Watermeyer and Chubb ( 2018 ) who said, “I think with impact it is literally so many words of persuasive narrative” as opposed to “giving any kind of substance” (p. 9). Similarly, Watermeyer and Hedgecoe ( 2016 ), reporting on an internal exercise at Cardiff University to evaluate case studies prior to submission, emphasised that “style and structure” were essential to “sell impact”, and that “case studies that best sold impact were those rewarded with the highest evaluative scores” (p. 651).
Recent research based on interviews with REF2014 panellists has also emphasised the subjectivity of the peer-review process used to evaluate impact. Derrick’s ( 2018 ) research findings based on panellist interviews and participant observation of REF2014 sub-panels argued that scores were strongly influenced by who the evaluators were and how the group assessed impact together. Indeed, a panellist interviewed by Watermeyer and Chubb ( 2018 ) concurred that “the panel had quite an influence on the criteria” (p. 7), including an admission that some types of (more intangible) evidence were more likely to be overlooked than other (more concrete) forms of evidence, “privileg[ing] certain kinds of impact”. Other panellists interviewed spoke of their emotional and intellectual vulnerability in making judgements about an impact criterion that they had little prior experience of assessing (Watermeyer and Chubb, 2018 ). Derrick ( 2018 ) argued that this led many evaluators to base their assessments on more familiar proxies for excellence linked to scientific excellence, which led to biased interpretations and shortcuts that mimicked “groupthink” (p. 193).
This paper will for the first time empirically assess the content and language of the largest possible sample of research impact case studies that received high versus low scores from assessment panels in REF2014. Combining qualitative thematic and quantitative linguistic analysis, we ask:
How do high-scoring versus low-scoring case studies articulate and evidence impacts linked to underpinning research?
Do high-scoring and low-scoring case studies have differences in their linguistic features or styles?
Do high-scoring and low-scoring case studies have lexical differences (words and phrases that are statistically more likely to occur in high- or low-scoring cases) or text-level differences (including reading ease, narrative clarity, use of cohesive devices)?
By answering these questions, our goal is to provide evidence for impact case study authors and their institutions to reflect on in order to optimally balance the content and to use language that communicates their impact as effectively as possible. While directly relevant to the assessment of impact in the UK’s REF, the work also provides insights of relevance to institutions internationally who are designing evaluation frameworks for research impact.
Research design and sample
The datasets were generated by using published institutional REF2014 impact scores to deduce the scores of some impact case studies themselves. Although scores for individual case studies were not made public, we were able to identify case studies that received the top mark of 4* based on the distribution of scores received by some institutions, where the whole submission by an institution in a given Unit of Assessment was awarded the same score. In those 20 Units of Assessment (henceforth UoA) where high-scoring case studies could be identified in this way, we also accessed all case studies known to have scored either 1* or 2* in order to compare the features of high-scoring case studies to those of low-scoring case studies.
We approached our research questions with two separate studies, using quantitative linguistic and qualitative thematic analysis respectively. The thematic analysis, explained in more detail in the section “Qualitative thematic analysis” below, allowed us to find answers to research question 1 (see above). The quantitative linguistic analysis was used to extract and compare typical word combinations for high-scoring and low-scoring case studies, as well as assessing their readability. It mainly addressed research questions 2 and 3.
The quantitative linguistic analysis was based on a sample of all identifiable high-scoring case studies in any UoA ( n = 124) and all identifiable low-scoring impact case studies in those UoAs where high-scoring case studies could be identified ( n = 93). As the linguistic analysis focused on identifying characteristic language choices in running text, only those sections designed to contain predominantly text were included (1—Summary of the impact; 2—Underpinning research; 4—Details of the impact). Figure 1 shows the distribution of case studies across Main Panels in the quantitative analysis. Table 1 summarises the number of words included in the analysis.

Distribution of case studies across Main Panels used for the linguistic analysis sample.
In order to detect patterns of content in high-scoring and low-scoring case studies across all four Main Panels, a sub-sample of case studies was selected for a qualitative thematic analysis. This included 60% of high-scoring case studies and 97% of low-scoring case studies from the quantitative analysis, such that only UoAs were included where both high-scoring and low-scoring case studies are available (as opposed to the quantitative sample, which includes all available high-scoring case studies). Further selection criteria were then designed to create a greater balance in the number of high-scoring and low-scoring case studies across Main Panels. Main Panels A (high) and C (low) were particularly over-represented, so a lower proportion of those case studies were selected and 10 additional high-scoring case studies were considered in Panel B, including institutions where at least 85% of the case studies scored 4* and the remaining scores were 3*. As this added a further UoA, we could also include 14 more low-scoring case studies in Main Panel B. This resulted in a total of 85 high-scoring and 90 low-scoring case studies. Figure 2 shows the distribution of case studies across Main Panels in the thematic analysis, illustrating the greater balance compared to the sample used in the quantitative analysis. The majority (75%) of the case studies analysed are included in both samples (Table 2 ).

Distribution of case studies across Main Panels used for the thematic analysis sample.
Quantitative linguistic analysis
Quantitative linguistic analysis can be used to make recurring patterns in language use visible and to assess their significance. We treated the dataset of impact case studies as a text collection (the ‘corpus’) divided into two sections, namely high-scoring and low-scoring case studies (the two ‘sub-corpora’), in order to explore the lexical profile and the readability of the case studies.
One way to explore the lexical profile of groups of texts is to generate frequency-based word lists and compare these to word lists from a reference corpus to determine which words are characteristic of the corpus of interest (“keywords”, cf. Scott, 1997 ). Another way is to extract word combinations that are particularly frequent. Such word combinations, called “lexical bundles”, are “extended collocations” (Hyland, 2008 , p. 41) that appear across a set range of texts (Esfandiari and Barbary, 2017 ). We merged these two approaches in order to uncover meanings that could not be made visible through the analysis of single-word frequencies, comparing lexical bundles from each sub-corpus to the other. Lexical bundles of 2–4 words were extracted with AntConc (specialist software developed by Anthony, 2014 ) firstly from the corpus of all high-scoring case studies and then separately from the sub-corpora of high-scoring case studies in Main Panel A, C and D. Footnote 2 The corresponding lists were extracted from low-scoring case studies overall and separated by panel. The lists of lexical bundles for each of the high-scoring corpus parts were then compared to the corresponding low-scoring parts (High-Overall vs. Low-Overall, High-Main Panel A vs. Low-Main Panel A, etc.) to detect statistically significant over-use and under-use in one set of texts relative to another.
Two statistical measures were used in the analysis of lexical bundles. Log Likelihood was used as a measure of the statistical significance of frequency differences (Rayson and Garside, 2000 ), with a value of >3.84 corresponding to p < 0.05. This measure had the advantage, compared to the more frequently used chi-square test, of not assuming a normal distribution of data (McEnery et al., 2006 ). The Log Ratio (Hardie, 2014 ) was used as a measure of effect size, which quantifies the scale, rather than the statistical significance, of frequency differences between two datasets. The Log Ratio is technically the binary log of the relative risk, and a value of >0.5 or <−0.5 is considered meaningful in corpus linguistics (Hardie, 2014 ), with values further removed from 0 reflecting a bigger difference in the relative frequencies found in each corpus. There is currently no agreed standard effect size measure for keywords (Brezina, 2018 , p. 85) and the Log Ratio was chosen because it is straightforward to interpret. Each lexical bundle that met the ‘keyness’ threshold (Log Likelihood > 3.84 in the case of expected values > 12, with higher significance levels needed for expected values < 13—see Rayson et al., 2004 , p. 8) was then assigned a code according to its predominant meaning in the texts, as reflected in the contexts captured in the concordance lines extracted from the corpus.
In the thematic analysis, it appeared that high-scoring case studies were easier to read. In order to quantify the readability of the texts, we therefore analysed them using the Coh-Metrix online tool (www.cohmetrix.com, v3.0) developed by McNamara et al. ( 2014 ). This tool provides 106 descriptive indices of language features, including 8 principal component scores developed from combinations of the other indices (Graesser et al., 2011 ). We selected these principal component scores as comprehensive measures of “reading ease” because they assess multiple characteristics of the text, up to whole-text discourse level (McNamara et al., 2014 , p. 78). This was supplemented by the traditional and more wide-spread Flesch Reading Ease score of readability measuring the lengths of words and sentences, which are highly correlated with reading speed (Haberlandt and Graesser, 1985 ). The selected measures were compared across corpus sections using t -tests to evaluate significance. The effect size was measured using Cohen’s D , following Brezina ( 2018 , p. 190), where D > 0.3 indicates a small, D > 0.5 a medium, and D > 0.8 a high effect size. As with the analysis of lexical bundles, comparisons were made between high- and low-scoring case studies in each of Main Panels A, C and D, as well as between all high-scoring and all low-scoring case studies across Main Panels.
Qualitative thematic analysis
While a quantitative analysis as described above can make differences in the use of certain words visible, it does not capture the narrative or content of the texts under investigation. In order to identify common features of high-scoring and low-scoring case studies, thematic analysis was chosen to complement the quantitative analysis by identifying patterns and inferring meaning from qualitative data (Auerbach and Silverstein, 2003 ; Braun and Clarke, 2006 ; Saldana, 2009 ). To familiarise themselves with the data and for inter-coder reliability, two research team members read a selection of REF2014 impact case studies from different Main Panels, before generating initial codes for each of the five sections of the impact case study template. These were discussed with the full research team, comprising three academic and three professional services staff who had all read multiple case studies themselves. They were piloted prior to defining a final set of themes and questions against which the data was coded (based on the six-step process outlined by Braun and Clarke, 2006 ) (Table 3 ). An additional category was used to code stylistic features, to triangulate elements of the quantitative analysis (e.g. readability) and to include additional stylistic features difficult to assess in quantitative terms (e.g. effective use of testimonials). In addition to this, 10 different types of impact were coded for, based on Reed’s ( 2018 ) typology: capacity and preparedness, awareness and understanding, policy, attitudinal change, behaviour change and other forms of decision-making, other social, economic, environmental, health and wellbeing, and cultural impacts. There was room for coders to include additional insights arising in each section of the case study that had not been captured in the coding system; and there was room to summarise other key factors they thought might account for high or low scores.
Coders summarised case study content pertaining to each code, for example by listing examples of effective or poor use of structure and formatting as they arose in each case study. Coders also quoted the original material next to their summaries so that their interpretation could be assessed during subsequent analysis. This initial coding of case study text was conducted by six coders, with intercoder reliability (based on 10% of the sample) assessed at over 90%. Subsequent thematic analysis within the codes was conducted by two of the co-authors. This involved categorising coded material into themes as a way of assigning meaning to features that occurred across multiple case studies (e.g. categorising types of corroborating evidence typically used in high-scoring versus low-scoring case studies).
Results and discussion
In this section, we integrate findings from the quantitative linguistic study and the qualitative analysis of low-scoring versus high-scoring case studies. The results are discussed under four headings based on the key findings that emerged from both analyses. Taken together, these findings provide the most comprehensive evidence to date of the characteristics of a top-rated (4*) impact case study in REF2014.
Highly-rated case studies provided specific, high-magnitude and well-evidenced articulations of significance and reach
One finding from our qualitative thematic analysis was that 84% of high-scoring cases articulated benefits to specific groups and provided evidence of their significance and reach, compared to 32% of low-scoring cases which typically focused instead on the pathway to impact, for example describing dissemination of research findings and engagement with stakeholders and publics without citing the benefits arising from dissemination or engagement. One way of conceptualising this difference is using the content/process distinction: whereas low-scoring cases tended to focus on the process through which impact was sought (i.e. the pathway used), the high-scoring cases tended to focus on the content of the impact itself (i.e. what change or improvement occurred as a result of the research).
Examples of global reach were evidenced across high-scoring case studies from all panels (including Panel D for Arts and Humanities research), but were less often claimed or evidenced in low-scoring case studies. Where reach was more limited geographically, many high-scoring case studies used context to create robust arguments that their reach was impressive in that context, describing reach for example in social or cultural terms or arguing for the importance of reaching a narrow but hard-to-reach or otherwise important target group.
Table 4 provides examples of evidence from high-scoring cases and low-scoring cases that were used to show significance and reach of impacts in REF2014.
Findings from the quantitative linguistic analysis in Table 5 show how high-scoring impact case studies contained more phrases that specified reach (e.g. “in England and”, “in the US”), compared to low-scoring case studies that used the more generic term “international”, leaving the reader in doubt about the actual reach. They also include more phrases that implicitly specified the significance of the impact (e.g. “the government’s” or “to the House of Commons”), compared to low-scoring cases which provided more generic phrases, such as “policy and practice”, rather than detailing specific policies or practices that had been changed.
The quantitative linguistics analysis also identified a number of words and phrases pertaining to engagement and pathways, which were intended to deliver impact but did not actually specify impact (Table 6 ). A number of phrases contained the word “dissemination”, and there were several words and phrases specifying types of engagement that could be considered more one-way dissemination than consultative or co-productive (cf. Reed et al.’s ( 2018 ) engagement typology), e.g. “the book” and “the event”. The focus on dissemination supports the finding from the qualitative thematic analysis that low-scoring case tended to focus more on pathways or routes than on impact. Although it is not possible to infer this directly from the data, it is possible that this may represent a deeper epistemological position underpinning some case studies, where impact generation was seen as one-way knowledge or technology transfer, and research findings were perceived as something that could be given unchanged to publics and stakeholders through dissemination activities, with the assumption that this would be understood as intended and lead to impact.
It is worth noting that none of the four UK countries appear significantly more often in either high-scoring or low-scoring case studies (outside of the phrase “in England and”). Wales ( n = 50), Scotland ( n = 71) and Northern Ireland ( n = 32) appear slightly more often in high-scoring case studies, but the difference is not significant (England: n = 162). An additional factor to take into account is that our dataset includes only submissions that are either high-scoring or low-scoring, and the geographical spread of the submitting institutions was not a factor in selecting texts. There was a balanced number of high-scoring and low-scoring case studies in the sample from English, Scottish and Welsh universities, but no guaranteed low-scoring submissions from Northern Irish institutions. The REF2014 guidance made it clear that impacts in each UK country would be evaluated equally in comparison to each other, the UK and other countries. While the quantitative analysis of case studies from our sample only found a statistically significant difference for the phrase “in England and”, this, combined with the slightly higher number of phrases containing the other countries of the UK in high-scoring case studies, might indicate that this panel guidance was implemented as instructed.
Figures 3 – 5 shows which types of impact could be identified in high-scoring or low-scoring case studies, respectively, in the qualitative thematic analysis (based on Reed’s ( 2018 ) typology of impacts). Note that percentages do not add up to 100% because it was possible for each case study to claim more than one type of impact (high-scoring impact case studies described on average 2.8 impacts, compared to an average of 1.8 impacts described by low-scoring case studies) Footnote 3 . Figure 3 shows the number of impacts per type as a percentage of the total number of impacts claimed in high-scoring versus low-scoring case studies. This shows that high-scoring case studies were more likely to claim health/wellbeing and policy impacts, whereas low-scoring case studies were more likely to claim understanding/awareness impacts. Looking at this by Main Panel, over 50% of high-scoring case studies in Main Panel A claimed health/wellbeing, policy and understanding/awareness impacts (Fig. 4 ), whereas over 50% of low-scoring case studies in Main Panel A claimed capacity building impacts (Fig. 5 ). There were relatively high numbers of economic and policy claimed in both high-scoring and low-scoring case studies in Main Panels B and C, respectively, with no impact type dominating strongly in Main Panel D (Figs. 4 and 5 ).

Number of impacts claimed in high- versus low-scoring case studies by impact type.

Percentage of high-scoring case studies that claimed different types of impact.

Percentage of low-scoring case studies that claimed different types of impact.
Highly-rated case studies used distinct features to establish links between research (cause) and impact (effect)
Findings from the quantitative linguistic analysis show that high-scoring case studies were significantly more likely to include attributional phrases like “cited in”, “used to” and “resulting in”, compared to low-scoring case studies (Table 7 provides examples for some of the 12 phrases more frequent in high-scoring case studies). However, there were some attributional phrases that were more likely to be found in low-scoring case studies (e.g. “from the”, “of the research” and “this work has”—total of 9 different phrases).
To investigate this further, all 564 and 601 instances Footnote 4 of attributional phrases in high-scoring and low-scoring case studies, respectively, were analysed to categorise the context in which they were used, to establish the extent to which these phrases in each corpus were being used to establish attribution to impacts. The first word or phrase preceding or succeeding the attributional content was coded. For example, if the attributional content was “used the”, followed by “research to generate impact”, the first word succeeding the attributional content (in this case “research”) was coded rather than the phrase it subsequently led to (“generate impact”). According to a Pearson Chi Square test, high-scoring case studies were significantly more likely to establish attribution to impact than low-scoring cases ( p < 0.0001, but with a small effect size based on Cramer’s V = 0.22; bold in Table 8 ). 18% ( n = 106) of phrases in the low-scoring corpus established attribution to impact, compared to 37% ( n = 210) in the high-scoring corpus, for example, stating that research, pathway or something else led to impact. Instead, low-scoring case studies were more likely to establish attribution to research (40%; n = 241) compared to high-scoring cases (28%; n = 156; p < 0.0001, but with a small effect size based on Cramer’s V = 0.135). Both high- and low-scoring case studies were similarly likely to establish attribution to pathways (low: 32%; n = 194; high: 31% n = 176).
Moreover, low-scoring case studies were more likely to include ambiguous or uncertain phrases. For example, the phrase “a number of” can be read to imply that it is not known how many instances there were. This occurred in all sections of the impact case studies, for example in the underpinning research section as “The research explores a number of themes” or in the summary or details of the impact section as “The work has also resulted in a number of other national and international impacts”, or “has influenced approaches and practices of a number of partner organisations”. Similarly, “an impact on” could give the impression that the nature of the impact is not known. This phrase occurred only in summary and details of the impact sections, for example, “These activities have had an impact on the professional development”, “the research has had an impact on the legal arguments”, or “there has also been an impact on the work of regional agency”.
In the qualitative thematic analysis, we found that only 50% of low-scoring case studies clearly linked the underpinning research to claimed impacts (compared to 97% of high-scoring cases). This gave the impression of over-claimed impacts in some low-scoring submissions. For example, one case study claimed “significant impacts on [a country’s] society” based on enhancing the security of a new IT system in the department responsible for publishing and archiving legislation. Another claimed “economic impact on a worldwide scale” based on billions of pounds of benefits, calculated using an undisclosed method by an undisclosed evaluator in an unpublished final report by the research team. One case study claimed attribution for impact based on similarities between a prototype developed by the researchers and a product subsequently launched by a major corporation, without any evidence that the product as launched was based on the prototype. Similar assumptions were made in a number of other case studies that appeared to conflate correlation with causation in their attempts to infer attribution between research and impact. Table 9 provides examples of different ways in which links between research and impact were evidenced in the details of the research section.
Table 10 shows how corroborating sources were used to support these claims. 82% of high-scoring case studies compared to 7% of low-scoring cases were identified in the qualitative thematic analysis as having generally high-quality corroborating evidence. In contrast, 11% of high-scoring case studies, compared to 71% of low-scoring cases, were identified as having corroborating evidence that was vague and/or poorly linked to claimed impacts. Looking at only case studies that claim policy impact, 11 out of 26 high-scoring case studies in the sample described both policy and implementation (42%), compared to just 5 out of 29 low-scoring case studies that included both policy and implementation (17%; the remainder described policy impacts only with no evidence of benefits arising from implementation). High- scoring case studies were more likely to cite evidence of impacts rather than just citing evidence pertaining to the pathway (which was more common in low-scoring cases). High-scoring policy case studies also provided evidence pertaining to the pathway, but because they typically also included evidence of policy change, this evidence helped attribute policy impacts to research.
Highly-rated case studies were easy to understand and well written
In preparation for the REF, many universities invested heavily in writing assistance (Coleman, 2019 ) to ensure that impact case studies were “easy to understand and evaluation-friendly” (Watermeyer and Chubb, 2018 ) for the assessment panels, which comprised academics and experts from other sectors (HEFCE, 2011 , p. 6). With this in mind, we investigated readability and style, both in the quantitative linguistic and in the qualitative thematic analysis.
High-scoring impact case studies scored more highly on the Flesch Reading Ease score, a readability measure based on the length of words and sentences. The scores in Table 11 are reported out of 100, with a higher score indicating that a text is easier to read. While the scores reveal a significant difference between 4* and 1*/2* impact case studies, they also indicate that impact case studies are generally on the verge of “graduate” difficulty (Hartley, 2016 , p. 1524). As such our analysis should not be understood as suggesting that these technical documents should be adjusted to the readability of a newspaper article, but they should be maintained at interested and educated non-specialist level.
Interestingly, there were differences between the main panels. Footnote 5 In Social Science and Humanities case studies (Main Panels C and D), high-scoring impact case studies scored significantly higher on reading ease than low-scoring ones. There was no significant difference in Main Panel A between 4* and 1*/2* cases. However, all Main Panel A case studies showed, on average, lower reading ease scores than the low-scoring cases in Main Panels C and D. This means that their authors used longer words and sentences, which may be explained in part by more and longer technical terms needed in Main Panel A disciplines; the difference between high- and low-scoring case studies in Main Panels C and D may be explained by the use of more technical jargon (confirmed in the qualitative analysis).
The Flesch Reading Ease measure assesses the sentence- and word-level, rather than capturing higher-level text-processing difficulty. While this is recognised as a reliable indicator of comparative reading ease, and the underlying measures of sentence-length and word-length are highly correlated with reading speed (Haberlandt and Graesser, 1985 ), Hartley ( 2016 ) is right in his criticism that the tool takes neither the meaning of the words nor the wider text into account. The Coh-Metrix tool (McNamara et al., 2014 ) provides further measures for reading ease based on textual cohesion in these texts compared to a set of general English texts. Of the eight principal component scores computed by the tool, most did not reveal a significant difference between high- and low-scoring case studies or between different Main Panels. Moreover, in most measures, impact case studies overall were fairly homogenous compared to the baseline of general English texts. However, there were significant differences between high- and low-scoring impact case studies in two of the measures: “deep cohesion” and “connectivity” (Table 12 ).
“Deep cohesion” shows whether a text makes causal connections between ideas explicit (e.g. “because”, “so”) or leaves them for the reader to infer. High-scoring case studies had a higher level of deep cohesion compared to general English texts (Graesser et al., 2011 ), while low-scoring case studies tended to sit below the general English average. In addition, Main Panel A case studies (Life Sciences), which received the lowest scores in Flesch Reading Ease, on average scored higher on deep cohesion than case studies in more discursive disciplines (Main Panel C—Social Sciences and Main Panel D—Arts and Humanities). “Connectivity” measures the level of explicit logical connectives (e.g. “and”, “or” and “but”) to show relations in the text. Impact case studies were low in connectivity compared to general English texts, but within each of the Main Panels, high-scoring case studies had more explicit connectivity than low-scoring case studies. This means that Main Panel A case studies, while using on average longer words and sentences as indicated by the Flesch Reading Ease scores, compensated for this by making causal and logical relationships more explicit in the texts. In Main Panels C and D, which on average scored lower on these measures, there was a clearer difference between high- and low-scoring case studies than in Main Panel A, with high-scoring case studies being easier to read.
Linked to this, low-scoring case studies across panels were more likely than high-scoring case studies to contain phrases linked to the research process (suggesting an over-emphasis on the research rather than the impact, and a focus on process over findings or quality; Table 18 ) and filler-phrases (Table 13 ).
High-scoring case studies were more likely to clearly identify individual impacts via subheadings and paragraph headings ( p < 0.0001, with effect size measure Log Ratio 0.54). The difference is especially pronounced in Main Panel D (Log Ratio 1.53), with a small difference in Main Panel C and no significant difference in Main Panel A. In Units of Assessment combined in Main Panel D, a more discursive academic writing style is prevalent (see e.g. Hyland, 2002 ) using fewer visual/typographical distinctions such as headings. The difference in the number of headings used in case studies from those disciplines suggests that high-scoring case studies showed greater divergence from disciplinary norms than low-scoring case studies. This may have allowed them to adapt the presentation of their research impact to the audience of panel members to a greater extent than low-scoring case studies.
The qualitative thematic analysis of Impact Case Studies indicates that it is not simply the number of subheadings that matters, although this comparison is interesting especially in the context of the larger discrepancy in Main Panel D. Table 14 summarises formatting that was considered helpful and unhelpful from the qualitative analysis.
The observations in Tables 11 – 13 stem from quantitative linguistic analysis, which, while enabling statistical testing, does not show directly the effect of a text on the reader. When conducting the qualitative thematic analysis, we collected examples of formatting and stylistic features from the writing and presentation of high and low-scoring case studies that might have affected clarity of the texts (Tables 14 and 15 ). Specifically, 38% of low-scoring case studies made inappropriate use of adjectives to describe impacts (compared to 20% of high-scoring; Table 16 ). Inappropriate use of adjectives may have given an impression of over-claiming or created a less factual impression than case studies that used adjectives more sparingly to describe impacts. Some included adjectives to describe impacts in testimonial quotes, giving third-party endorsement to the claims rather than using these adjectives directly in the case study text.
Highly-rated case studies were more likely to describe underpinning research findings, rather than research processes
To be eligible, case studies in REF2014 had to be based on underpinning research that was “recognised internationally in terms of originality, significance and rigour” (denoted by a 2* quality profile, HEFCE, 2011 , p. 29). Ineligible case studies were excluded from our sample (i.e. those in the “unclassifiable” quality profile), so all the case studies should have been based on strong research. Once this research quality threshold had been passed, scores were based on the significance and reach of impact, so case studies with higher-rated research should not, in theory, get better scores on the basis of their underpinning research. However, there is evidence that units whose research outputs scored well in REF2014 also performed well on impact (unpublished Research England analysis cited in Hill, 2016 ). This observation only shows that high-quality research and impact were co-located, rather than demonstrating a causal relationship between high-quality research and highly rated impacts. However, our qualitative thematic analysis suggests that weaker descriptions of research (underpinning research was not evaluated directly) may have been more likely to be co-located with lower-rated impacts at the level of individual case studies. We know that the majority of underpinning research in the sample was graded 2* or above (because we excluded unclassifiable case studies from the analysis) but individual ratings for outputs in the underpinning research section are not provided in REF2014. Therefore, the qualitative analysis looked for a range of indicators of strong or weak research in four categories: (i) indicators of publication quality; (ii) quality of funding sources; (iii) narrative descriptions of research quality; and (iv) the extent to which the submitting unit (versus collaborators outside the institution) had contributed to the underpinning research. As would be expected (given that all cases had passed the 2* threshold), only a small minority of cases in the sample gave grounds to doubt the quality of the underpinning research. However, both our qualitative and quantitative analyses identified research-related differences between high- and low-scoring impact case studies.
Based on our qualitative thematic analysis of indicators of research quality, a number of low-scoring cases contained indications that underpinning research may have been weak. This was very rare in high-scoring cases. In the most extreme case, one case study was not able to submit any published research to underpin the impact, relying instead on having secured grant funding and having a manuscript under review. Table 17 describes indicators that underpinning research may have been weaker (presumably closer to the 2* quality threshold for eligibility). It also describes the indications of higher quality research (which were likely to have exceeded the 2* threshold) that were found in the rest of the sample. High-scoring case studies demonstrated the quality of the research using a range of direct and indirect approaches. Direct approaches included the construction of arguments that articulated the originality, significance and rigour of the research in the “underpinning research” section of the case study (sometimes with reference to outputs that were being assessed elsewhere in the exercise to provide a quick and robust check on quality ratings). In addition to this, a wide range of indirect proxies were used to infer quality, including publication venue, funding sources, reviews and awards.
These indicators are of particular interest given the stipulation in REF2021 that case studies must provide evidence of research quality, with the only official guidance suggesting that this is done via the use of indicators. The indicators identified in Table 17 overlap significantly with example indicators proposed by panels in the REF2021 guidance. However, there are also a number of additional indicators, which may be of use for demonstrating the quality of research in REF2021 case studies. In common with proposed REF2021 research quality indicators, many of the indicators in Table 17 are highly context dependent, based on subjective disciplinary norms that are used as short-cuts to assessments of quality by peers within a given context. Funding sources, publication venues and reviews that are considered prestigious in one disciplinary context are often perceived very differently in other disciplinary contexts. While REF2021 does not allow the use of certain indicators (e.g. journal impact factors), no comment is given on the appropriateness of the suggested indicators. While this may be problematic, given that an indicator by definition sign-posts, suggests or indicates by proxy rather than representing the outcome of any rigorous assessment, we make no comment on whether it is appropriate to judge research quality via such proxies. Instead, Table 17 presents a subjective, qualitative identification of indicators of high or low research quality, which were as far as possible considered within the context of disciplinary norms in the Units of Assessments to which the case studies belonged.
The quantitative linguistic analysis also found differences between the high-scoring and low-scoring case studies relating to underpinning research. There were significantly more words and phrases in low-scoring case studies compared to high-scoring cases relating to research outputs (e.g. “the paper”, “peer-reviewed”, “journal of”, “et al”), the research process (e.g. “research project”, “the research”, “his work”, “research team”) and descriptions of research (“relationship between”, “research into”, “the research”) (Table 18 ). The word “research” itself appears frequently in both (high: 91× per 10,000 words; low: 110× per 10,000 words), which is nevertheless a small but significant over-use in the low-scoring case studies (effect size measure log ratio = 0.27, p < 0.0001).
There are two alternative ways to interpret these findings. First, the qualitative research appears to suggest a link between higher-quality underpinning research and higher impact scores. However, the causal mechanism is not clear. An independent review of REF2014 commissioned by the UK Government (Stern, 2016 ) proposed that underpinning research should only have to meet the 2* threshold for rigour, as the academic significance and novelty of the research is not in theory a necessary precursor to significant and far-reaching impact. However, a number of the indications of weaker research in Table 17 relate to academic significance and originality, and many of the indicators that suggested research exceeded the 2* threshold imply academic significance and originality (e.g. more prestigious publication venues often demand stronger evidence of academic significance and originality in addition to rigour). As such, it may be possible to posit two potential causal mechanisms related to the originality and/or significance of research. First, it may be argued that major new academic breakthroughs may be more likely to lead to impacts, whether directly in the case of applied research that addresses societal challenges in new and important ways leading to breakthrough impacts, or indirectly in the case of major new methodological or theoretical breakthroughs that make new work possible that addresses previously intractable challenges. Second, the highest quality research may have sub-consciously biased reviewers to view associated impacts more favourably. Further research would be necessary to test either mechanism.
However, these mechanisms do not explain the higher frequency of words and phrases relating to research outputs and process in low-scoring case studies. Both high-scoring and low-scoring cases described the underpinning research, and none of the phrases that emerged from the analysis imply higher or lower quality of research. We hypothesised that this may be explained by low-scoring case studies devoting more space to underpinning research at the expense of other sections that may have been more likely to contribute towards scores. Word limits were “indicative”, and the real limit of “four pages” in REF2014 (extended to five pages in REF2021) was operationalised in various way. However, a t -test found no significant difference between the underpinning research word counts (mean of 579 and 537 words in high and low-scoring case studies, respectively; p = 0.11). Instead, we note that words and phrases relating to research in the low-scoring case studies focused more on descriptions of research outputs and processes rather than descriptions of research findings or the quality of research, as requested in REF2014 guidelines. Given that eligibility evidenced in this section is based on whether the research findings underpin the impacts and the quality of the research (HEFCE, 2011 ), we hypothesise that the focus of low-scoring case studies on research outputs and processes was unnecessary (at best) or replaced or obscured research findings (at worst). This could be conceptualised as another instance of the content/process distinction, whereby high-scoring case studies focused on what the research found and low-scoring case studies focused on the process through which the research was conducted and disseminated. It could be concluded that this tendency may have contributed towards lower scores if unnecessary descriptions of research outputs and process, which would not have contributed towards scores, used up space that could otherwise have been used for material that may have contributed towards scores.
Limitations
These findings may be useful in guiding the construction and writing of case studies for REF2021 but it is important to recognise that our analyses are retrospective, showing examples of what was judged to be ‘good’ and ‘poor’ practice in the authorship of case studies for REF2014. Importantly, the findings of this study should not be used to infer a causal relationship between the linguistic features we have identified and the judgements of the REF evaluation panel. Our quantitative analysis has identified similarities and differences in their linguistic features, but there are undoubtedly a range of considerations taken into account by evaluation panels. It is also not possible to anticipate how REF2021 panels will interpret guidance and evaluate case studies, and there is already evidence that practice is changing significantly across the sector. This shift in expectations regarding impact is especially likely to be the case in research concerned with public policy, which are increasingly including policy implementation as well as design in their requirements, and research involving public engagement, which is increasingly being expected to provide longitudinal evidence of benefits and provide evidence of cause and effect. We are unable to say anything conclusive from our sample about case studies that focused primarily on public engagement and pedagogy because neither of these types of impact were common enough in either the high-scoring or low-scoring sample to infer reliable findings. While this is the largest sample of known high-scoring versus low-scoring case studies ever analysed, it is important to note that this represents <3% of the total case studies submitted to REF2014. Although the number of case studies was fairly evenly balanced between Main Panels in the thematic analysis, the sample only included a selection of Units of Assessment from each Main Panel, where sufficient numbers of high and low-scoring cases could be identified (14 and 20 out of 36 Units of Assessment in the qualitative and quantitative studies, respectively). As such, caution should be taken when generalising from these findings.
This paper provides empirical insights into the linguistic differences in high-scoring and low-scoring impact case studies in REF2014. Higher-scoring case studies were more likely to have articulated evidence of significant and far-reaching impacts (rather than just presenting the activities used to reach intended future impacts), and they articulated clear evidence of causal links between the underpinning research and claimed impacts. While a cause and effect relationship between linguistic features, styles and the panel’s evaluation cannot be claimed, we have provided a granularity of analysis that shows how high-scoring versus low-scoring case studies attempted to meet REF criteria. Knowledge of these features may provide useful lessons for future case study authors, submitting institutions and others developing impact assessments internationally. Specifically, we show that high-scoring case studies were more likely to provide specific and high-magnitude articulations of significance and reach, compared to low-scoring cases, which were more likely to provide less specific and lower-magnitude articulations of significance and reach. Lower-scoring case studies were more likely to focus on pathways to impact rather than articulating clear impact claims, with a particular focus on one-way modes of knowledge transfer. High-scoring case studies were more likely to provide clear links between underpinning research and impacts, supported by high-quality corroborating evidence, compared to low-scoring cases that often had missing links between research and impact and were more likely to be underpinned by corroborating evidence that was vague and/or not clearly linked to impact claims. Linked to this, high-scoring case studies were more likely to contain attributional phrases, and these phrases were more likely to attribute research and/or pathways to impact, compared to low-scoring cases, which contained fewer attributional phrases, which were more likely to provide attribution to pathways rather than impact. Furthermore, there is evidence that high-scoring case studies had more explicit causal connections between ideas and more logical connective words (and, or, but) than low-scoring cases.
However, in addition to the explicit REF2014 rules, which appear to have been enacted effectively by sub-panels, there is evidence that implicit rules, particularly linked to written style, may also have played a role. High-scoring case studies appear to have conformed to a distinctive new genre of writing, which was clear and direct, often simplified in its representation of causality between research and impact, and less likely to contain expressions of uncertainty than might be normally expected in academic writing (cf. e.g. Vold, 2006 ; Yang et al., 2015 ). Low-scoring case studies were more likely to contain filler phrases that could be described as “academese” (Biber and Gray, 2019 , p. 1), more likely to use unsubstantiated or vague adjectives to describe impacts, and were less likely to signpost readers to key points using sub-headings and paragraph headings. High-scoring case studies in two Main Panels (out of the three that could be analysed in this way) were significantly easier to read, although both high- and low-scoring case studies tended to be of “graduate” (Hartley, 2016 ) difficulty.
These findings suggest that aspects of written style may have contributed towards or compromised the scores of some case studies in REF2014, in line with previous research emphasising the role of implicit and subjective factors in determining the outcomes of impact evaluation (Derrick, 2018 ; Watermeyer and Chubb, 2018 ). If this were the case, it may raise questions about whether case studies are an appropriate way to evaluate impact. However, metric-based approaches have many other limitations and are widely regarded as inappropriate for evaluating societal impact (Bornmann et al., 2018 ; Pollitt et al., 2016 ; Ravenscroft et al., 2017 ; Wilsdon et al., 2015 ). Comparing research output evaluation systems across different countries, Sivertsen ( 2017 ) presents the peer-review-based UK REF as “best practice” compared to the metrics-based systems elsewhere. Comparing the evaluation of impact in the UK to impact evaluations in USA, the Netherlands, Italy and Finland, Derrick ( 2019 ) describes REF2014 and REF2021 as “the world’s most developed agenda for evaluating the wider benefits of research and its success has influenced the way many other countries define and approach the assessment of impact”.
We cannot be certain about the extent to which linguistic features or style shaped the judgement of REF evaluators, nor can such influences easily be identified or even consciously recognised when they are at work (cf. research on sub-conscious bias and tacit knowledge; the idea that “we know more than we can say”—Polanyi, 1958 cited in Goodman, 2003 , p. 142). Nonetheless, we hope that the granularity of our findings proves useful in informing decisions about presenting case studies, both for case study authors (in REF2021 and other research impact evaluations around the world) and those designing such evaluation processes. In publishing this evidence, we hope to create a more “level playing field” between institutions with and without significant resources available to hire dedicated staff or consultants to help write their impact case studies.
Data availability
The dataset analysed during the current study corresponds to the publicly available impact case studies defined through the method explained in Section “Research design and sample” and Table 2 . A full list of case studies included can be obtained from the corresponding author upon request.
https://impact.ref.ac.uk/casestudies/search1.aspx
For Main Panel B, only six high-scoring and two low-scoring case studies are clearly identifiable and available to the public (cf. Fig. 1 ). The Main Panel B dataset is therefore too small for separate statistical analysis, and no generalisations should be made on the basis of only one high-scoring and one low-scoring submission.
However, in the qualitative analysis, there were a similar number of high-scoring case studies that were considered to have reached this score due to a clear focus on one single, highly impressive impact, compared to those that were singled out for their impressive range of different impacts.
Note that there were more instances of the smaller number of attributional phrases in the low-scoring corpus.
For Main Panel B, only six high-scoring and two low-scoring case studies are clearly identifiable and available to the public. The Main Panel B dataset is therefore too small for separate statistical analysis, and no generalisations should be made on the basis of only one high-scoring and one low-scoring submission.
Anthony L (2014) AntConc, 3.4.4 edn. Waseda University, Tokyo
Google Scholar
Auerbach CF, Silverstein LB (2003) Qualitative data: an introduction to coding and analyzing data in qualitative research. New York University Press, New York, NY
Back L (2015) On the side of the powerful: the ‘impact agenda’ and sociology in public. https://www.thesociologicalreview.com/on-the-side-of-the-powerful-the-impact-agenda-sociology-in-public/ . Last Accessed 24 Jan 2020
Biber D, Gray B (2019) Grammatical complexity in academic English: linguistic change in writing. Cambridge University Press, Cambridge
Bornmann L, Haunschild R, Adams J (2018) Do altmetrics assess societal impact in the same way as case studies? An empirical analysis testing the convergent validity of altmetrics based on data from the UK Research Excellence Framework (REF). J Informetr 13(1):325–340
Article Google Scholar
Bozeman B, Youtie J (2017) Socio-economic impacts and public value of government-funded research: lessons from four US National Science Foundation initiatives. Res Policy 46(8):1387–1398
Braun V, Clarke V (2006) Using thematic analysis in psychology. Quale Res Psychol 3(2):77–101
Brezina V (2018) Statistics in corpus linguistics: a practical guide. Cambridge University Press, Cambridge
Book Google Scholar
Chubb J (2017) Instrumentalism and epistemic responsibility: researchers and the impact agenda in the UK and Australia. University of York
Chubb J, Watermeyer R (2017) Artifice or integrity in the marketization of research impact? Investigating the moral economy of (pathways to) impact statements within research funding proposals in the UK and Australia. Stud High Educ 42(2):2360–2372
Chubb J, Reed MS (2017) Epistemic responsibility as an edifying force in academic research: investigating the moral challenges and opportunities of an impact agenda in the UK and Australia. Palgrave Commun 3:20
Chubb J, Reed MS (2018) The politics of research impact: academic perceptions of the implications for research funding, motivation and quality. Br Politics 13(3):295–311
Clark WC et al. (2016) Crafting usable knowledge for sustainable development. Proc Natl Acad Sci USA 113(17):4570–4578
Article ADS CAS PubMed Google Scholar
Coleman I (2019) The evolution of impact support in UK universities. Cactus Communications Pvt. Ltd
Derrick G (2018) The evaluators’ eye: impact assessment and academic peer review. Palgrave Macmillan
Derrick G (2019) Cultural impact of the impact agenda: implications for social sciences and humanities (SSH) research. In: Bueno D et al. (eds.), Higher education in the world, vol. 7. Humanities and higher education: synergies between science, technology and humanities. Global University Network for Innovation (GUNi)
Derrick G et al. (2018) Towards characterising negative impact: introducing Grimpact. In: Proceedings of the 23rd international conference on Science and Technology Indicators (STI 2018). Centre for Science and Technology Studies (CWTS), Leiden, The Netherlands
Esfandiari R, Barbary F (2017) A contrastive corpus-driven study of lexical bundles between English writers and Persian writers in psychology research articles. J Engl Academic Purp 29:21–42
Goodman CP (2003) The tacit dimension. Polanyiana 2(1):133–157
Graesser AC, McNamara DS, Kulikowich J (2011) Coh-Metrix: providing multi-level analyses of text characteristics. Educ Res 40:223–234
Haberlandt KF, Graesser AC (1985) Component processes in text comprehension and some of their interactions. J Exp Psychol: Gen 114(3):357–374
Hardie A (2014) Statistical identification of keywords, lockwords and collocations as a two-step procedure. ICAME 35, Nottingham
Hartley J (2016) Is time up for the Flesch measure of reading ease? Scientometrics 107(3):1523–1526
HEFCE (2011) Assessment framework and guidance on submissions. Ref. 02.2011
Hill S (2016) Assessing (for) impact: future assessment of the societal impact of research. Palgrave Commun 2:16073
Hyland K (2002) Directives: argument and engagement in academic writing. Appl Linguist 23(2):215–238
Hyland K (2008) As can be seen: lexical bundles and disciplinary variation. Engl Specif Purp 27(1):4–21
Lemos MC (2015) Usable climate knowledge for adaptive and co-managed water governance. Curr Opin Environ Sustain 12:48–52
MacDonald R (2017) “Impact”, research and slaying Zombies: the pressures and possibilities of the REF. Int J Sociol Soc Policy 37(11–12):696–710
Mårtensson P et al. (2016) Evaluating research: a multidisciplinary approach to assessing research practice and quality. Res Policy 45(3):593–603
McEnery T, Xiao R, Tono Y (2006) Corpus-based language studies: an advanced resource book. Routledge, Abingdon
McNamara DS et al. (2014) Automated evaluation of text and discourse with Coh-Metrix. Cambridge University Press, New York, NY
National Science Foundation (2014) Perspectives on broader impacts
Nesta (2018) Seven principles for public engagement in research and innovation policymaking. https://www.nesta.org.uk/documents/955/Seven_principles_HlLwdow.pdf . Last Accessed 12 Dec 2019
Oancea A (2010) The BERA/UCET review of the impacts of RAE 2008 on education research in UK higher education institutions. ERA/UCET, Macclesfield
Oancea (2014) Research assessment as governance technology in the United Kingdom: findings from a survey of RAE 2008 impacts. Z Erziehungswis 17(S6):83–110
Olssen M, Peters MA (2005) Neoliberalism, higher education and the knowledge economy: from the free market to knowledge capitalism. J Educ Policy 20(3):313–345
Pidd M, Broadbent J (2015) Business and management studies in the 2014 Research Excellence Framework. Br J Manag 26:569–581
Pollitt A et al. (2016) Understanding the relative valuation of research impact: a best–worst scaling experiment of the general public and biomedical and health researchers. BMJ Open 6(8):e010916
Article PubMed PubMed Central Google Scholar
Rau H, Goggins G, Fahy F (2018) From invisibility to impact: recognising the scientific and societal relevance of interdisciplinary sustainability research. Res Policy 47(1):266–276
Ravenscroft J et al. (2017) Measuring scientific impact beyond academia: an assessment of existing impact metrics and proposed improvements. PLoS ONE 12(3):e0173152
Article PubMed PubMed Central CAS Google Scholar
Rayson P, Garside R (2000) Comparing corpora using frequency profiling, Workshop on Comparing Corpora, held in conjunction with the 38th annual meeting of the Association for Computational Linguistics (ACL 2000), Hong Kong, pp. 1–6
Rayson P, Berridge D, Francis B (2004) Extending the Cochran rule for the comparison of word frequencies between corpora. In: Purnelle G, Fairon C, Dister A (eds.), Le poids des mots: Proceedings of the 7th international conference on statistical analysis of textual data (JADT 2004) (II). Presses universitaires de Louvain, Louvain-la-Neuve, Belgium, pp. 926–936
Reed MS (2018) The research impact handbook, 2nd edn. Fast Track Impact, Huntly, Aberdeenshire
Reed MS (2019) Book review: new book calls for civil disobedience to fight “dehumanising” impact agenda. Fast Track Impact
Reed MS et al. (under review) Evaluating research impact: a methodological framework. Res Policy
Rhoads R, Torres CA (2005) The University, State, and Market: The Political Economy of Globalization in the Americas. Stanford University Press, Stanford
Saldana J (2009) The Coding Manual for Qualitative Researchers. Sage, Thousand Oaks
Scott M (1997) PC analysis of key words—and key key words. System 25(2):233–245
Sivertsen G (2017) Unique, but still best practice? The Research Excellence Framework (REF) from an international perspective. Palgrave Commun 3:17078
Smith S, Ward V, House A (2011) ‘Impact’ in the proposals for the UK’s Research Excellence Framework: shifting the boundaries of academic autonomy. Res Policy 40(10):1369–1379
Stern LN (2016) Building on success and learning from experience: an independent review of the Research Excellence Framework
Tsey K et al. (2016) Evaluating research impact: the development of a research for impact tool. Front Public Health 4:160
Vold ET (2006) Epistemic modality markers in research articles: a cross-linguistic and cross-disciplinary study. Int J Appl Linguist 16(1):61–87
Warry P (2006) Increasing the economic impact of the Research Councils (the Warry report). Research Council UK, Swindon
Watermeyer R (2019) Competitive accountability in academic life: the struggle for social impact and public legitimacy. Edward Elgar, Cheltenham
Watermeyer R, Hedgecoe A (2016) ‘Selling ‘impact’: peer reviewer projections of what is needed and what counts in REF impact case studies. A retrospective analysis. J Educ Policy 31:651–665
Watermeyer R, Chubb J (2018) Evaluating ‘impact’ in the UK’s Research Excellence Framework (REF): liminality, looseness and new modalities of scholarly distinction. Stud Higher Educ 44(9):1–13
Weinstein N et al. (2019) The real-time REF review: a pilot study to examine the feasibility of a longitudinal evaluation of perceptions and attitudes towards REF 2021
Wilsdon J et al. (2015) Metric tide: report of the independent review of the role of metrics in research assessment and management
Yang A, Zheng S, Ge G (2015) Epistemic modality in English-medium medical research articles: a systemic functional perspective. Engl Specif Purp 38:1–10
Download references
Acknowledgements
Thanks to Dr. Adam Mearns, School of English Literature, Language & Linguistics at Newcastle University for help with statistics and wider input to research design as a co-supervisor on the Ph.D. research upon which this article is based.
Author information
Authors and affiliations.
Newcastle University, Newcastle, UK
Bella Reichard, Mark S Reed & Andrea Whittle
University of York, York, UK
University of Leeds, Leeds, UK
Northumbria University, Newcastle, UK
Lucy Jowett & Alisha Peart
You can also search for this author in PubMed Google Scholar
Corresponding author
Correspondence to Mark S Reed .
Ethics declarations
Competing interests.
MR is CEO of Fast Track Impact Ltd, providing impact training to researchers internationally. JC worked with Research England as part of the Real-Time REF Review in parallel with the writing of this article. BR offers consultancy services reviewing REF impact case studies.
Additional information
Publisher’s note Springer Nature remains neutral with regard to jurisdictional claims in published maps and institutional affiliations.
Rights and permissions
Open Access This article is licensed under a Creative Commons Attribution 4.0 International License, which permits use, sharing, adaptation, distribution and reproduction in any medium or format, as long as you give appropriate credit to the original author(s) and the source, provide a link to the Creative Commons license, and indicate if changes were made. The images or other third party material in this article are included in the article’s Creative Commons license, unless indicated otherwise in a credit line to the material. If material is not included in the article’s Creative Commons license and your intended use is not permitted by statutory regulation or exceeds the permitted use, you will need to obtain permission directly from the copyright holder. To view a copy of this license, visit http://creativecommons.org/licenses/by/4.0/ .
Reprints and permissions
About this article
Cite this article.
Reichard, B., Reed, M.S., Chubb, J. et al. Writing impact case studies: a comparative study of high-scoring and low-scoring case studies from REF2014. Palgrave Commun 6 , 31 (2020). https://doi.org/10.1057/s41599-020-0394-7
Download citation
Received : 10 July 2019
Accepted : 09 January 2020
Published : 25 February 2020
DOI : https://doi.org/10.1057/s41599-020-0394-7
Share this article
Anyone you share the following link with will be able to read this content:
Sorry, a shareable link is not currently available for this article.
Provided by the Springer Nature SharedIt content-sharing initiative
Quick links
- Explore articles by subject
- Guide to authors
- Editorial policies

How to Do Comparative Analysis in Research ( Examples )
Comparative analysis is a method that is widely used in social science . It is a method of comparing two or more items with an idea of uncovering and discovering new ideas about them. It often compares and contrasts social structures and processes around the world to grasp general patterns. Comparative analysis tries to understand the study and explain every element of data that comparing.

We often compare and contrast in our daily life. So it is usual to compare and contrast the culture and human society. We often heard that ‘our culture is quite good than theirs’ or ‘their lifestyle is better than us’. In social science, the social scientist compares primitive, barbarian, civilized, and modern societies. They use this to understand and discover the evolutionary changes that happen to society and its people. It is not only used to understand the evolutionary processes but also to identify the differences, changes, and connections between societies.
Most social scientists are involved in comparative analysis. Macfarlane has thought that “On account of history, the examinations are typically on schedule, in that of other sociologies, transcendently in space. The historian always takes their society and compares it with the past society, and analyzes how far they differ from each other.
The comparative method of social research is a product of 19 th -century sociology and social anthropology. Sociologists like Emile Durkheim, Herbert Spencer Max Weber used comparative analysis in their works. For example, Max Weber compares the protestant of Europe with Catholics and also compared it with other religions like Islam, Hinduism, and Confucianism.
To do a systematic comparison we need to follow different elements of the method.
1. Methods of comparison The comparison method
In social science, we can do comparisons in different ways. It is merely different based on the topic, the field of study. Like Emile Durkheim compare societies as organic solidarity and mechanical solidarity. The famous sociologist Emile Durkheim provides us with three different approaches to the comparative method. Which are;
- The first approach is to identify and select one particular society in a fixed period. And by doing that, we can identify and determine the relationship, connections and differences exist in that particular society alone. We can find their religious practices, traditions, law, norms etc.
- The second approach is to consider and draw various societies which have common or similar characteristics that may vary in some ways. It may be we can select societies at a specific period, or we can select societies in the different periods which have common characteristics but vary in some ways. For example, we can take European and American societies (which are universally similar characteristics) in the 20 th century. And we can compare and contrast their society in terms of law, custom, tradition, etc.
- The third approach he envisaged is to take different societies of different times that may share some similar characteristics or maybe show revolutionary changes. For example, we can compare modern and primitive societies which show us revolutionary social changes.
2 . The unit of comparison
We cannot compare every aspect of society. As we know there are so many things that we cannot compare. The very success of the compare method is the unit or the element that we select to compare. We are only able to compare things that have some attributes in common. For example, we can compare the existing family system in America with the existing family system in Europe. But we are not able to compare the food habits in china with the divorce rate in America. It is not possible. So, the next thing you to remember is to consider the unit of comparison. You have to select it with utmost care.
3. The motive of comparison
As another method of study, a comparative analysis is one among them for the social scientist. The researcher or the person who does the comparative method must know for what grounds they taking the comparative method. They have to consider the strength, limitations, weaknesses, etc. He must have to know how to do the analysis.
Steps of the comparative method
1. Setting up of a unit of comparison
As mentioned earlier, the first step is to consider and determine the unit of comparison for your study. You must consider all the dimensions of your unit. This is where you put the two things you need to compare and to properly analyze and compare it. It is not an easy step, we have to systematically and scientifically do this with proper methods and techniques. You have to build your objectives, variables and make some assumptions or ask yourself about what you need to study or make a hypothesis for your analysis.
The best casings of reference are built from explicit sources instead of your musings or perceptions. To do that you can select some attributes in the society like marriage, law, customs, norms, etc. by doing this you can easily compare and contrast the two societies that you selected for your study. You can set some questions like, is the marriage practices of Catholics are different from Protestants? Did men and women get an equal voice in their mate choice? You can set as many questions that you wanted. Because that will explore the truth about that particular topic. A comparative analysis must have these attributes to study. A social scientist who wishes to compare must develop those research questions that pop up in your mind. A study without those is not going to be a fruitful one.
2. Grounds of comparison
The grounds of comparison should be understandable for the reader. You must acknowledge why you selected these units for your comparison. For example, it is quite natural that a person who asks why you choose this what about another one? What is the reason behind choosing this particular society? If a social scientist chooses primitive Asian society and primitive Australian society for comparison, he must acknowledge the grounds of comparison to the readers. The comparison of your work must be self-explanatory without any complications.
If you choose two particular societies for your comparative analysis you must convey to the reader what are you intended to choose this and the reason for choosing that society in your analysis.
3 . Report or thesis
The main element of the comparative analysis is the thesis or the report. The report is the most important one that it must contain all your frame of reference. It must include all your research questions, objectives of your topic, the characteristics of your two units of comparison, variables in your study, and last but not least the finding and conclusion must be written down. The findings must be self-explanatory because the reader must understand to what extent did they connect and what are their differences. For example, in Emile Durkheim’s Theory of Division of Labour, he classified organic solidarity and Mechanical solidarity . In which he means primitive society as Mechanical solidarity and modern society as Organic Solidarity. Like that you have to mention what are your findings in the thesis.
4. Relationship and linking one to another
Your paper must link each point in the argument. Without that the reader does not understand the logical and rational advance in your analysis. In a comparative analysis, you need to compare the ‘x’ and ‘y’ in your paper. (x and y mean the two-unit or things in your comparison). To do that you can use likewise, similarly, on the contrary, etc. For example, if we do a comparison between primitive society and modern society we can say that; ‘in the primitive society the division of labour is based on gender and age on the contrary (or the other hand), in modern society, the division of labour is based on skill and knowledge of a person.
Demerits of comparison
Comparative analysis is not always successful. It has some limitations. The broad utilization of comparative analysis can undoubtedly cause the feeling that this technique is a solidly settled, smooth, and unproblematic method of investigation, which because of its undeniable intelligent status can produce dependable information once some specialized preconditions are met acceptably.
Perhaps the most fundamental issue here respects the independence of the unit picked for comparison. As different types of substances are gotten to be analyzed, there is frequently a fundamental and implicit supposition about their independence and a quiet propensity to disregard the mutual influences and common impacts among the units.
One more basic issue with broad ramifications concerns the decision of the units being analyzed. The primary concern is that a long way from being a guiltless as well as basic assignment, the decision of comparison units is a basic and precarious issue. The issue with this sort of comparison is that in such investigations the depictions of the cases picked for examination with the principle one will in general turn out to be unreasonably streamlined, shallow, and stylised with contorted contentions and ends as entailment.
However, a comparative analysis is as yet a strategy with exceptional benefits, essentially due to its capacity to cause us to perceive the restriction of our psyche and check against the weaknesses and hurtful results of localism and provincialism. We may anyway have something to gain from history specialists’ faltering in utilizing comparison and from their regard for the uniqueness of settings and accounts of people groups. All of the above, by doing the comparison we discover the truths the underlying and undiscovered connection, differences that exist in society.
Also Read: How to write a Sociology Analysis? Explained with Examples

Sociology Group
The Sociology Group is an organization dedicated to creating social awareness through thoughtful initiatives like "social stories" and the "Meet the Professor" insightful interview series. Recognized for our book reviews, author interviews, and social sciences articles, we also host annual social sciences writing competition. Interested in joining us? Email [email protected] . We are a dedicated team of social scientists on a mission to simplify complex theories, conduct enlightening interviews, and offer academic assistance, making Social Science accessible and practical for all curious minds.

An official website of the United States government
The .gov means it’s official. Federal government websites often end in .gov or .mil. Before sharing sensitive information, make sure you’re on a federal government site.
The site is secure. The https:// ensures that you are connecting to the official website and that any information you provide is encrypted and transmitted securely.
- Publications
- Account settings
Preview improvements coming to the PMC website in October 2024. Learn More or Try it out now .
- Advanced Search
- Journal List
Comparative effectiveness research for the clinician researcher: a framework for making a methodological design choice
Cylie m. williams.
1 Peninsula Health, Community Health, PO Box 52, Frankston, Melbourne, Victoria 3199 Australia
2 Monash University, School of Physiotherapy, Melbourne, Australia
3 Monash Health, Allied Health Research Unit, Melbourne, Australia
Elizabeth H. Skinner
4 Western Health, Allied Health, Melbourne, Australia
Alicia M. James
Jill l. cook, steven m. mcphail.
5 Queensland University of Technology, School of Public Health and Social Work, Brisbane, Australia
Terry P. Haines
Comparative effectiveness research compares two active forms of treatment or usual care in comparison with usual care with an additional intervention element. These types of study are commonly conducted following a placebo or no active treatment trial. Research designs with a placebo or non-active treatment arm can be challenging for the clinician researcher when conducted within the healthcare environment with patients attending for treatment.
A framework for conducting comparative effectiveness research is needed, particularly for interventions for which there are no strong regulatory requirements that must be met prior to their introduction into usual care. We argue for a broader use of comparative effectiveness research to achieve translatable real-world clinical research. These types of research design also affect the rapid uptake of evidence-based clinical practice within the healthcare setting.
This framework includes questions to guide the clinician researcher into the most appropriate trial design to measure treatment effect. These questions include consideration given to current treatment provision during usual care, known treatment effectiveness, side effects of treatments, economic impact, and the setting in which the research is being undertaken.
Comparative effectiveness research compares two active forms of treatment or usual care in comparison with usual care with an additional intervention element. Comparative effectiveness research differs from study designs that have an inactive control, such as a ‘no-intervention’ or placebo group. In pharmaceutical research, trial designs in which placebo drugs are tested against the trial medication are often labeled ‘Phase III’ trials. Phase III trials aim to produce high-quality evidence of intervention efficacy and are important to identify potential side effects and benefits. Health outcome research with this study design involves the placebo being non-treatment or a ‘sham’ treatment option [ 1 ].
Traditionally, comparative effectiveness research is conducted following completion of a Phase III placebo control trial [ 2 – 4 ]. It is possible that comparative effectiveness research might not determine whether one treatment has clinical beneficence, because the comparator treatment might be harmful, irrelevant, or ineffective. This is unless the comparator treatment has already demonstrated superiority to a placebo [ 2 ]. Moreover, comparing an active treatment to an inactive control will be more likely to produce larger effect sizes than a comparison of two active treatments [ 5 ], requiring smaller sample sizes and lower costs to establish or refute the effectiveness of a treatment. Historically, then, treatments only become candidates for comparative effectiveness research to establish superiority, after a treatment has demonstrated efficacy against an inactive control.
Frequently, the provision of health interventions precedes development of the evidence base directly supporting their use [ 6 ]. Some service-provision contexts are highly regulated and high standards of evidence are required before an intervention can be provided (such as pharmacological interventions and device use). However, this is not universally the case for all services that may be provided in healthcare interventions. Despite this, there may be expectation from the individual patient and the public that individuals who present to a health service will receive some form of care deemed appropriate by treating clinicians, even in the absence of research-based evidence supporting this. This expectation may be amplified in publicly subsidized health services (as is largely the case in Canada, the UK, Australia, and many other developed nations) [ 7 – 9 ]. If a treatment is already widely employed by health professionals and is accepted by patients as a component of usual care, then it is important to consider the ethics and practicality of attempting a placebo or no-intervention control trial in this context. In this context, comparative effectiveness research could provide valuable insights to treatment effectiveness, disease pathophysiology, and economic efficiency in service delivery, with greater research feasibility than the traditional paradigm just described. Further, some authors have argued that studies with inactive control groups are used when comparative effectiveness research designs are more appropriate [ 10 ]. We propose and justify a framework for conducting research that argues for the broader use of comparative effectiveness research to achieve more feasible and translatable real-world clinical research.
This debate is important for the research community; particularly those engaged in the planning and execution of research in clinical practice settings, particularly in the provision of non-pharmacological, non-device type interventions. The ethical, preferential, and pragmatic implications from active versus inactive comparator selection in clinical trials not only influence the range of theoretical conclusions that could be drawn from a study, but also the lived experiences of patients and their treating clinical teams. The comparator selection will also have important implications for policy and practice when considering potential translation into clinical settings. It is these implications that affect the clinical researcher’s methodological design choice and justification.
The decision-making framework takes the form of a decision tree (Fig. 1 ) to determine when a comparative effectiveness study can be justified and is particularly relevant to the provision of services that do not have a tight regulatory framework governing when an intervention can be used as part of usual care. This framework is headed by Level 1 questions (demarcated by a question within an oval), which feed into decision nodes (demarcated by rectangles), which end in decision points (demarcated by diamonds). Each question is discussed with clinical examples to illustrate relevant points.

Comparative effectiveness research decision-making framework. Treatment A represents any treatment for a particular condition, which may or may not be a component of usual care to manage that condition. Treatment B is used to represent our treatment of interest. Where the response is unknown, the user should choose the NO response
Treatment A is any treatment for a particular condition that may or may not be a component of usual care to manage that condition. Treatment B is our treatment of interest. The framework results in three possible recommendations: that either (i) a study design comparing Treatment B with no active intervention could be used, or (ii) a study design comparing Treatment A, Treatment B and no active intervention should be used, or (iii) a comparative effectiveness study (Treatment A versus Treatment B) should be used.
Level 1 questions
Is the condition of interest being managed by any treatment as part of usual care either locally or internationally.
Researchers first need to identify what treatments are being offered as usual care to their target patient population to consider whether to perform a comparative effectiveness research (Treatment A versus B) or use a design comparing Treatment B with an inactive control. Usual care has been shown to vary across healthcare settings for many interventions [ 11 , 12 ]; thus, researchers should understand that usual care in their context might not be usual care universally. Consequently, researchers must consider what comprises usual care both in their local context and more broadly.
If there is no usual care treatment, then it is practical to undertake a design comparing Treatment B with no active treatment (Fig. 1 , Exit 1). If there is strong evidence of treatment effectiveness, safety, and cost-effectiveness of Treatment A that is not a component of usual care locally, this treatment should be considered for inclusion in the study. This situation can occur from delayed translation of research evidence into practice, with an estimated 17 years to implement only 14 % of research in evidence-based care [ 13 ]. In this circumstance, although it may be more feasible to use a Treatment B versus no active treatment design, the value of this research will be very limited, compared with comparative effectiveness research of Treatment A versus B. If the condition is currently being treated as part of usual care, then the researcher should consider the alternate Level 1 question for progression to Level 2.
As an example, prevention of falls is a safety priority within all healthcare sectors and most healthcare services have mitigation strategies in place. Evaluation of the effectiveness of different fall-prevention strategies within the hospital setting would most commonly require a comparative design [ 14 ]. A non-active treatment in this instance would mean withdrawal of a service that might be perceived as essential, a governmental health priority, and already integrated in the healthcare system.
Is there evidence of Treatment A’s effectiveness compared with no active intervention beyond usual care?
If there is evidence of Treatment A’s effectiveness compared with a placebo or no active treatment, then we progress to Question 3. If Treatment A has limited evidence, a comparative effectiveness research design of Treatment B versus no active treatment design can be considered. By comparing Treatment A with Treatment B, researchers would generate relevant research evidence for their local healthcare setting (is Treatment B superior to usual care or Treatment A?) and other healthcare settings that use Treatment A as their usual care. This design may be particularly useful when the local population is targeted and extrapolation of research findings is less relevant.
For example, the success of chronic disease management programs (Treatment A) run in different Aboriginal communities were highly influenced by unique characteristics and local cultures and traditions [ 15 ]. Therefore, taking Treatment A to an urban setting or non-indigenous setting with those unique characteristics will render Treatment A ineffectual. The use of Treatment A may also be particularly useful in circumstances where the condition of interest has an uncertain etiology and the competing treatments under consideration address different pathophysiological pathways. However, if Treatment A has limited use beyond the research location and there are no compelling reasons to extrapolate findings more broadly applicable, then Treatment B versus no active control design may be suitable.
The key points clinical researchers should consider are:
- The commonality of the treatment within usual care
- The success of established treatments in localized or unique population groups only
- Established effectiveness of treatments compared with placebo or no active treatment
Level 2 questions
Do the benefits of treatment a exceed the side effects when compared with no active intervention beyond usual care.
Where Treatment A is known to be effective, yet produces side effects, the severity, risk of occurrence, and duration of the side effects should be considered before it is used as a comparator for Treatment B. If the risk or potential severity of Treatment A is unacceptably high or is uncertain, and there are no other potential comparative treatments available, a study design comparing Treatment B with no active intervention should be used (Fig. 1 , Exit 2). Whether Treatment A remains a component of usual care should also be considered. If the side effects of Treatment A are considered acceptable, comparative effectiveness research may still be warranted.
The clinician researcher may also be challenged when the risk of the Treatment A and risk of Treatment B are unknown or when one is marginally more risky than the other [ 16 ]. Unknown risk comparison between the two treatments when using this framework should be considered as uncertain and the design of Treatment A versus Treatment B or Treatment B versus no intervention or a three-arm trial investigating Treatment A, B and no intervention is potentially justified (Fig. 1 , Exit 3).
A good example of risk comparison is the use of exercise programs. Walking has many health benefits, particularly for older adults, and has also demonstrated benefits in reducing falls [ 17 ]. Exercise programs inclusive of walking training have been shown to prevent falls but brisk walking programs for people at high risk of falls can increase the number of falls experienced [ 18 ]. The pragmatic approach of risk and design of comparative effectiveness research could better demonstrate the effect than a placebo (no active treatment) based trial.
- Risk of treatment side effects (including death) in the design
- Acceptable levels of risk are present for all treatments
Level 3 question
Does treatment a have a sufficient overall net benefit, when all costs and consequences or benefits are considered to deem it superior to a ‘no active intervention beyond usual care’ condition.
Simply being effective and free of unacceptable side effects is insufficient to warrant Treatment A being the standard for comparison. If the cost of providing Treatment A is so high that it renders its benefits insignificant compared with its costs, or Treatment A has been shown not to be cost-effective, or the cost-effectiveness is below acceptable thresholds, it is clear that Treatment A is not a realistic comparator. Some have advocated for a cost-effectiveness (cost-utility) threshold of $50,000 per quality-adjusted life year gained as being an appropriate threshold, though there is some disagreement about this and different societies might have different capacities to afford such a threshold [ 19 ]. Based on these considerations, one should further contemplate whether Treatment A should remain a component of usual care. If no other potential comparative treatments are available, a study design comparing Treatment B with no active intervention is recommended (Fig. 1 , Exit 4).
If Treatment A does have demonstrated efficacy, safety, and cost-effectiveness compared with no active treatment, it is unethical to pursue a study design comparing Treatment B with no active intervention, where patients providing consent are being asked to forego a safe and effective treatment that they otherwise would have received. This is an unethical approach and also unfeasible, as the recruitment rates could be very poor. However, Treatment A may be reasonable to include as a comparison if it is usually purchased by the potential participant and is made available through the trial.
The methodological design of a diabetic foot wound study illustrates the importance of health economics [ 20 ]. This study compared the outcomes of Treatment A (non-surgical sharps debridement) with Treatment B (low-frequency ultrasonic debridement). Empirical evidence supports the need for wound care and non-intervention would place the patient at risk of further wound deterioration, potentially resulting in loss of limb loss or death [ 21 ]. High consumable expenses and increased short-term time demands compared with low expense and longer term decreased time demands must also be considered. The value of information should also be considered, with the existing levels of evidence weighed up against the opportunity cost of using research funds for another purpose in the context of the probability that Treatment A is cost-effective [ 22 ].
- Economic evaluation and effect on treatment
- Understanding the health economics of treatment based on effectiveness will guide clinical practice
- Not all treatment costs are known but establishing these can guide evidence-based practice or research design
Level 4 question
Is the patient (potential participant) presenting to a health service or to a university- or research-administered clinic.
If Treatment A is not a component of usual care, one of three alternatives is being considered by the researcher: (i) conducting a comparative effectiveness study of Treatment B in addition to usual care versus usual care alone, (ii) introducing Treatment A to usual care for the purpose of the trial and then comparing it with Treatment B in addition to usual care, (iii) conducting a trial of Treatment B versus no active control. If the researcher is considering option (i), usual care should itself be considered to be Treatment A, and the researcher should return to Question 2 in our framework.
There is a recent focus on the importance of health research conducted by clinicians within health service settings as distinct from health research conducted by university-based academics within university settings [ 23 , 24 ]. People who present to health services expect to receive treatment for their complaint, unlike a person responding to a research trial advertisement, where it is clearly stated that participants might not receive active treatment. It is in these circumstances that option (ii) is most appropriate.
Using research designs (option iii) comparing Treatment B with no active control within a health service setting poses challenges to clinical staff caring for patients, as they need to consider the ethics of enrolling patients into a study who might not receive an active treatment (Fig. 1 , Exit 4). This is not to imply that the use of a non-active control is unethical. Where there is no evidence of effectiveness, this should be considered within the study design and in relation to the other framework questions about the risk and use of the treatment within usual care. Clinicians will need to establish the effectiveness, safety, and cost-effectiveness of the treatments and their impact on other health services, weighed against their concern for the patient’s well-being and the possibility that no treatment will be provided [ 25 ]. This is referred to as clinical equipoise.
Patients have a right to access publicly available health interventions, regardless of the presence of a trial. Comparing Treatment B with no active control is inappropriate, owing to usual care being withheld. However, if there is insufficient evidence that usual care is effective, or sufficient evidence that adverse events are likely, the treatment is prohibitive to implement within clinical practice, or the cost of the intervention is significant, a sham or placebo-based trial should be implemented.
Comparative effectiveness research evaluating different treatment options of heel pain within a community health service [ 26 ] highlighted the importance of the research setting. Children with heel pain who attended the health service for treatment were recruited for this study. Children and parents were asked on enrollment if they would participate if there were a potential assignment to a ‘no-intervention’ group. Of the 124 participants, only 7 % ( n = 9) agreed that they would participate if placed into a group with no treatment [ 26 ].
- The research setting can impact the design of research
- Clinical equipoise challenges clinicians during recruitment into research in the healthcare setting
- Patients enter a healthcare service for treatment; entering a clinical trial is not the presentation motive
This framework describes and examines a decision structure for comparator selection in comparative effectiveness research based on current interventions, risk, and setting. While scientific rigor is critical, researchers in clinical contexts have additional considerations related to existing practice, patient safety, and outcomes. It is proposed that when trials are conducted in healthcare settings, a comparative effectiveness research design should be the preferred methodology to placebo-based trial design, provided that evidence for treatment options, risk, and setting have all been carefully considered.
Authors’ contributions
CMW and TPH drafted the framework and manuscript. All authors critically reviewed and revised the framework and manuscript and approved the final version of the manuscript.
Competing interests
The authors declare that they have no competing interests.
Contributor Information
Cylie M. Williams, Phone: +61 3 9784 8100, Email: ua.vog.civ.nchp@smailliweilyc .
Elizabeth H. Skinner, Email: [email protected] .
Alicia M. James, Email: ua.vog.civ.nchp@semajaicila .
Jill L. Cook, Email: [email protected] .
Steven M. McPhail, Email: [email protected] .
Terry P. Haines, Email: [email protected] .

Causal Comparative Research: Methods And Examples
Ritu was in charge of marketing a new protein drink about to be launched. The client wanted a causal-comparative study…

Ritu was in charge of marketing a new protein drink about to be launched. The client wanted a causal-comparative study highlighting the drink’s benefits. They demanded that comparative analysis be made the main campaign design strategy. After carefully analyzing the project requirements, Ritu decided to follow a causal-comparative research design. She realized that causal-comparative research emphasizing physical development in different groups of people would lay a good foundation to establish the product.
What Is Causal Comparative Research?
Examples of causal comparative research variables.
Causal-comparative research is a method used to identify the cause–effect relationship between a dependent and independent variable. This relationship is usually a suggested relationship because we can’t control an independent variable completely. Unlike correlation research, this doesn’t rely on relationships. In a causal-comparative research design, the researcher compares two groups to find out whether the independent variable affected the outcome or the dependent variable.
A causal-comparative method determines whether one variable has a direct influence on the other and why. It identifies the causes of certain occurrences (or non-occurrences). It makes a study descriptive rather than experimental by scrutinizing the relationships among different variables in which the independent variable has already occurred. Variables can’t be manipulated sometimes, but a link between dependent and independent variables is established and the implications of possible causes are used to draw conclusions.
In a causal-comparative design, researchers study cause and effect in retrospect and determine consequences or causes of differences already existing among or between groups of people.
Let’s look at some characteristics of causal-comparative research:
- This method tries to identify cause and effect relationships.
- Two or more groups are included as variables.
- Individuals aren’t selected randomly.
- Independent variables can’t be manipulated.
- It helps save time and money.
The main purpose of a causal-comparative study is to explore effects, consequences and causes. There are two types of causal-comparative research design. They are:
Retrospective Causal Comparative Research
For this type of research, a researcher has to investigate a particular question after the effects have occurred. They attempt to determine whether or not a variable influences another variable.
Prospective Causal Comparative Research
The researcher initiates a study, beginning with the causes and determined to analyze the effects of a given condition. This is not as common as retrospective causal-comparative research.
Usually, it’s easier to compare a variable with the known than the unknown.
Researchers use causal-comparative research to achieve research goals by comparing two variables that represent two groups. This data can include differences in opportunities, privileges exclusive to certain groups or developments with respect to gender, race, nationality or ability.
For example, to find out the difference in wages between men and women, researchers have to make a comparative study of wages earned by both genders across various professions, hierarchies and locations. None of the variables can be influenced and cause-effect relationship has to be established with a persuasive logical argument. Some common variables investigated in this type of research are:
- Achievement and other ability variables
- Family-related variables
- Organismic variables such as age, sex and ethnicity
- Variables related to schools
- Personality variables
While raw test scores, assessments and other measures (such as grade point averages) are used as data in this research, sources, standardized tests, structured interviews and surveys are popular research tools.
However, there are drawbacks of causal-comparative research too, such as its inability to manipulate or control an independent variable and the lack of randomization. Subject-selection bias always remains a possibility and poses a threat to the internal validity of a study. Researchers can control it with statistical matching or by creating identical subgroups. Executives have to look out for loss of subjects, location influences, poor attitude of subjects and testing threats to produce a valid research study.
Harappa’s Thinking Critically program is for managers who want to learn how to think effectively before making critical decisions. Learn how leaders articulate the reasons behind and implications of their decisions. Become a growth-driven manager looking to select the right strategies to outperform targets. It’s packed with problem-solving and effective-thinking tools that are essential for skill development. What more? It offers live learning support and the opportunity to progress at your own pace. Ask for your free demo today!
Explore Harappa Diaries to learn more about topics such as Objectives Of Research Methodology , Types Of Thinking , What Is Visualisation and Effective Learning Methods to upgrade your knowledge and skills.

- AI Content Shield
- AI KW Research
- AI Assistant
- SEO Optimizer
- AI KW Clustering
- Customer reviews
- The NLO Revolution
- Press Center
- Help Center
- Content Resources
- Facebook Group
An Effective Guide to Comparative Research Questions
Table of Contents
Comparative research questions are a type of quantitative research question. It aims to gather information on the differences between two or more research objects based on different variables.
These kinds of questions assist the researcher in identifying distinctive characteristics that distinguish one research subject from another.
A systematic investigation is built around research questions. Therefore, asking the right quantitative questions is key to gathering relevant and valuable information that will positively impact your work.
This article discusses the types of quantitative research questions with a particular focus on comparative questions.
What Are Quantitative Research Questions?
Quantitative research questions are unbiased queries that offer thorough information regarding a study topic . You can statistically analyze numerical data yielded from quantitative research questions.
This type of research question aids in understanding the research issue by examining trends and patterns. The data collected can be generalized to the overall population and help make informed decisions.

Types of Quantitative Research Questions
Quantitative research questions can be divided into three types which are explained below:
Descriptive Research Questions
Researchers use descriptive research questions to collect numerical data about the traits and characteristics of study subjects. These questions mainly look for responses that bring into light the characteristic pattern of the existing research subjects.
However, note that the descriptive questions are not concerned with the causes of the observed traits and features. Instead, they focus on the “what,” i.e., explaining the topic of the research without taking into account its reasons.
Examples of Descriptive research questions:
- How often do you use our keto diet app?
- What price range are you ready to accept for this product?
Comparative Research Questions
Comparative research questions seek to identify differences between two or more distinct groups based on one or more dependent variables. These research questions aim to identify features that differ one research subject from another while emphasizing their apparent similarities.
In market research surveys, asking comparative questions can reveal how your product or service compares to its competitors. It can also help you determine your product’s benefits and drawbacks to gain a competitive edge.
The steps in formulating comparative questions are as follows:
- Choose the right starting phrase
- Specify the dependent variable
- Choose the groups that interest you
- Identify the relevant adjoining text
- Compose the comparative research question
Relationship-Based Research Questions
A relationship-based research question refers to the nature of the association between research subjects of the same category. These kinds of research question assist you in learning more about the type of relationship between two study variables.
Because they aim to distinctly define the connection between two variables, relationship-based research questions are also known as correlational research questions.
Examples of Comparative Research Questions
- What is the difference between men’s and women’s daily caloric intake in London?
- What is the difference in the shopping attitude of millennial adults and those born in 1980?
- What is the difference in time spent on video games between people of the age group 15-17 and 18-21?
- What is the difference in political views of Mexicans and Americans in the US?
- What are the differences between Snapchat usage of American male and female university students?
- What is the difference in views towards the security of online banking between the youth and the seniors?
- What is the difference in attitude between Gen-Z and Millennial toward rock music?
- What are the differences between online and offline classes?
- What are the differences between on-site and remote work?
- What is the difference between weekly Facebook photo uploads between American male and female college students?
- What are the differences between an Android and an Apple phone?
Comparative research questions are a great way to identify the difference between two study subjects of the same group.
Asking the right questions will help you gain effective and insightful data to conduct your research better . This article discusses the various aspects of quantitative research questions and their types to help you make data-driven and informed decisions when needed.

Abir Ghenaiet
Abir is a data analyst and researcher. Among her interests are artificial intelligence, machine learning, and natural language processing. As a humanitarian and educator, she actively supports women in tech and promotes diversity.
Explore All Engaging Questions Tool Articles
Consider these fun questions about spring.
Spring is a season in the Earth’s yearly cycle after Winter and before Summer. It is the time life and…
- Engaging Questions Tool
Fun Spouse Game Questions For Couples
Answering spouse game questions together can be fun. It’ll help begin conversations and further explore preferences, history, and interests. The…
Best Snap Game Questions to Play on Snapchat
Are you out to get a fun way to connect with your friends on Snapchat? Look no further than snap…
How to Prepare for Short Response Questions in Tests
When it comes to acing tests, there are a few things that will help you more than anything else. Good…
Top 20 Reflective Questions for Students
As students, we are constantly learning new things. Every day, we are presented with further information and ideas we need…
Random History Questions For History Games
A great icebreaker game is playing trivia even though you don’t know the answer. It is always fun to guess…

Decoding the Brain: A Comparative Study of Human and Nonhuman Primates
T he human brain, with its intricate web of connections and functions, has long been a subject of fascination. An international team of scientists has embarked on a mission to map the genetic, cellular, and structural aspects of both human and nonhuman primate brains, yielding insights that could reshape our understanding of cognition, evolution, and potential treatments for brain disorders.
The BRAIN Initiative's Vision
Funded by the NIH's BRAIN Initiative, the research aims to understand the brain's cellular diversity and its implications in health and disease. The initiative's vast scope might seem daunting, but by breaking it down into tangible tasks, such as the creation of a detailed cell atlas, researchers have made commendable progress. This atlas, when neighboring those of nonhuman primates, provides a clearer picture of cell types, proportions, and organization.
A Comparative Approach
The decision to compare human brain structures with nonhuman primates, including chimpanzees, gorillas, macaques, and marmosets, was deliberate. This comparative analysis has revealed evolutionary differences. For instance, subtle shifts in gene expression in humans have led to alterations in neuronal wiring and synaptic function. This comparison shows how we've evolved differently over time. For example, small changes in our genes have led to alterations to the neuronal wiring or the way our brain's nerve cells connect and how they pass messages to each other with synaptic function.These changes have likely enabled our brains to adapt, learn, and evolve more dynamically.
Harnessing Data for Future Insights
The data from this research is invaluable. The brain cell atlas alone encompasses over 3,000 types of brain cells. This extensive cataloging offers insights into the variations in brain cell types between humans and nonhuman primates. Moreover, the research has also revealed how specific brain cell types correlate with particular diseases, laying the groundwork for potential targeted therapies.
Furthermore, a study focusing on cell variations in marmosets has drawn connections between the properties of cells in the adult brain and their developmental stages. This suggests that certain cellular properties in adults might trace back to early developmental phases, offering a fresh perspective on brain development across a lifespan.
Evolutionary Revelations
One of the standout findings from the research is the differences observed in the anatomy and physiology of neurons in the neocortex between humans and mice. The neocortex, responsible for functions like cognition and language, has undergone significant changes in humans, reflecting the complexities of managing intricate brain circuits.
Guiding Principles in Research
Scientific research, especially of this magnitude, is not without challenges. Recognizing and addressing biases, both personal and systemic, is crucial to maintain the integrity of the findings. The BRAIN Initiative, while ambitious, has been methodical in its approach. By segmenting its mission, validating findings, and leveraging successful models, it ensures that the research remains focused and purposeful.
Moreover, the tools and methodologies employed, from imaging techniques to genetic sequencing, play a pivotal role in navigating the complexities of brain mapping. The human brain, as a system, requires a holistic understanding. The detailed cellular blueprints provided by the cell atlases are instrumental in this endeavor.
The comparative brain cell mapping research has significantly advanced our understanding of the human brain's complexity and its evolutionary trajectory. The potential of this research to revolutionize treatments for brain disorders and enhance our understanding of cognitive functions is immense, promising a brighter future in neuroscience.

Comparative Effectiveness of Traditional Chinese Medicine vs. Losartan on Blood Pressure: Real-World Insights from RCT-Eligible Populations
- Find this author on Google Scholar
- Find this author on PubMed
- Search for this author on this site
- For correspondence: [email protected]
- ORCID record for Xinxing Lai
- ORCID record for Ying Gao
- Info/History
- Preview PDF
When evaluating the effectiveness of a drug, a Randomized Controlled Trial (RCT) is often considered the gold standard due to its perfect randomization. While RCT assures strong internal validity, its restricted external validity poses challenges in extending treatment effects to the broader real-world population due to possible heterogeneity in covariates. In this study, we employed the augmented inverse probability of sampling weighted (AIPSW) estimator to generalize findings from an RCT comparing the efficacy of Songling Xuemaikang Capsule (SXC) -- a traditional Chinese medicine (TCM) and Losartan on hypertension reduction to a real-world trial-eligible population. Additionally, we conducted sensitivity analyses to assess the robustness of the AIPSW estimation against unmeasured confounders. The generalization results indicated that although SXC is less effective in lowering blood pressure than Losartan on week 2, week 4, and week 6, there is no statistically significant difference among the trial-eligible population at week 8, and the generalization is robust against potential unmeasured confounders.
Competing Interest Statement
The authors have declared no competing interest.
Clinical Trial
The study protocol was approved by the Institutional Review Board of Dongzhimen Hospital affiliated to Beijing University of Chinese Medicine (approval number: ECSL-BDY-2011-19) and was registered on the Chinese Clinical Trial Registry Platform (www.chictr.org.cn; Unique identifier: ChiCTRONC-11001612)
Funding Statement
This work was supported by the Beijing Nova Program of Science and Technology (Z211100002121061) and the Young Elite Scientist Sponsorship Program by the China Association for Science and Technology (2021-QNRC1-04).
Author Declarations
I confirm all relevant ethical guidelines have been followed, and any necessary IRB and/or ethics committee approvals have been obtained.
The details of the IRB/oversight body that provided approval or exemption for the research described are given below:
Institutional Review Board of Dongzhimen Hospital affiliated to Beijing University of Chinese Medicine (approval number: ECSL-BDY-2011-19)
I confirm that all necessary patient/participant consent has been obtained and the appropriate institutional forms have been archived, and that any patient/participant/sample identifiers included were not known to anyone (e.g., hospital staff, patients or participants themselves) outside the research group so cannot be used to identify individuals.
I understand that all clinical trials and any other prospective interventional studies must be registered with an ICMJE-approved registry, such as ClinicalTrials.gov. I confirm that any such study reported in the manuscript has been registered and the trial registration ID is provided (note: if posting a prospective study registered retrospectively, please provide a statement in the trial ID field explaining why the study was not registered in advance).
I have followed all appropriate research reporting guidelines, such as any relevant EQUATOR Network research reporting checklist(s) and other pertinent material, if applicable.
Data Availability
The author cannot share the data without a permit from a relative institution.
View the discussion thread.
Thank you for your interest in spreading the word about medRxiv.
NOTE: Your email address is requested solely to identify you as the sender of this article.

Citation Manager Formats
- EndNote (tagged)
- EndNote 8 (xml)
- RefWorks Tagged
- Ref Manager
- Tweet Widget
- Facebook Like
- Google Plus One
Subject Area
- Epidemiology
- Addiction Medicine (313)
- Allergy and Immunology (614)
- Anesthesia (157)
- Cardiovascular Medicine (2225)
- Dentistry and Oral Medicine (275)
- Dermatology (199)
- Emergency Medicine (366)
- Endocrinology (including Diabetes Mellitus and Metabolic Disease) (789)
- Epidemiology (11509)
- Forensic Medicine (10)
- Gastroenterology (673)
- Genetic and Genomic Medicine (3511)
- Geriatric Medicine (336)
- Health Economics (609)
- Health Informatics (2260)
- Health Policy (906)
- Health Systems and Quality Improvement (855)
- Hematology (332)
- HIV/AIDS (738)
- Infectious Diseases (except HIV/AIDS) (13094)
- Intensive Care and Critical Care Medicine (747)
- Medical Education (355)
- Medical Ethics (98)
- Nephrology (383)
- Neurology (3294)
- Nursing (189)
- Nutrition (502)
- Obstetrics and Gynecology (643)
- Occupational and Environmental Health (643)
- Oncology (1735)
- Ophthalmology (516)
- Orthopedics (205)
- Otolaryngology (283)
- Pain Medicine (219)
- Palliative Medicine (65)
- Pathology (430)
- Pediatrics (994)
- Pharmacology and Therapeutics (415)
- Primary Care Research (394)
- Psychiatry and Clinical Psychology (3026)
- Public and Global Health (5945)
- Radiology and Imaging (1210)
- Rehabilitation Medicine and Physical Therapy (706)
- Respiratory Medicine (803)
- Rheumatology (363)
- Sexual and Reproductive Health (343)
- Sports Medicine (307)
- Surgery (381)
- Toxicology (50)
- Transplantation (169)
- Urology (140)
This paper is in the following e-collection/theme issue:
Published on 18.3.2024 in Vol 26 (2024)
Tanzania’s and Germany’s Digital Health Strategies and Their Consistency With the World Health Organization’s Global Strategy on Digital Health 2020-2025: Comparative Policy Analysis
Authors of this article:
Original Paper
- Felix Holl 1 , MPH, MSc, PhD ;
- Jennifer Kircher 1 , BA ;
- Attila J Hertelendy 2 , BHS, MSc, PhD ;
- Felix Sukums 3 , MSc, PhD ;
- Walter Swoboda 1 , Dr med
1 DigiHealth Institute, Neu-Ulm University of Applied Sciences, Neu-Ulm, Germany
2 Department of Information Systems and Business Analytics, College of Business, Florida International University, Miami, FL, United States
3 MUHAS Digital Health and Innovation Research Group, Muhimbili University of Health & Allied Sciences, Dar es Salaam, United Republic of Tanzania
Corresponding Author:
Felix Holl, MPH, MSc, PhD
DigiHealth Institute
Neu-Ulm University of Applied Sciences
Wileystraße 1
Neu-Ulm, 89231
Phone: 49 7319762 ext 1613
Email: [email protected]
Background: In recent years, the fast-paced adoption of digital health (DH) technologies has transformed health care delivery. However, this rapid evolution has also led to challenges such as uncoordinated development and information silos, impeding effective health care integration. Recognizing these challenges, nations have developed digital health strategies (DHSs), aligning with their national health priorities and guidance from global frameworks. The World Health Organization (WHO)’s Global Strategy on Digital Health 2020-2025 (GSDH) guides national DHSs.
Objective: This study analyzes the DHSs of Tanzania and Germany as case studies and assesses their alignment with the GSDH and identifies strengths, shortcomings, and areas for improvement.
Methods: A comparative policy analysis was conducted, focusing on the DHSs of Tanzania and Germany as case studies, selected for their contrasting health care systems and cooperative history. The analysis involved a three-step process: (1) assessing consistency with the GSDH, (2) comparing similarities and differences, and (3) evaluating the incorporation of emergent technologies. Primary data sources included national eHealth policy documents and related legislation.
Results: Both Germany’s and Tanzania’s DHSs align significantly with the WHO’s GSDH, incorporating most of its 35 elements, but each missing 5 distinct elements. Specifically, Tanzania’s DHS lacks in areas such as knowledge management and capacity building for leaders, while Germany’s strategy falls short in engaging health care service providers and beneficiaries in development phases and promoting health equity. Both countries, however, excel in other aspects like collaboration, knowledge transfer, and advancing national DHSs, reflecting their commitment to enhancing DH infrastructures. The high ratings of both countries on the Global Digital Health Monitor underscore their substantial progress in DH, although challenges persist in adopting the rapidly advancing technologies and in the need for more inclusive and comprehensive strategies.
Conclusions: This study reveals that both Tanzania and Germany have made significant strides in aligning their DHSs with the WHO’s GSDH. However, the rapid evolution of technologies like artificial intelligence and machine learning presents challenges in keeping strategies up-to-date. This study recommends the development of more comprehensive, inclusive strategies and regular revisions to align with emerging technologies and needs. The research underscores the importance of context-specific adaptations in DHSs and highlights the need for broader, strategic guidelines to direct the future development of the DH ecosystem. The WHO’s GSDH serves as a crucial blueprint for national DHSs. This comparative analysis demonstrates the value and challenges of aligning national strategies with global guidelines. Both Tanzania and Germany offer valuable insights into developing and implementing effective DHSs, highlighting the importance of continuous adaptation and context-specific considerations. Future policy assessments require in-depth knowledge of the country’s health care needs and structure, supplemented by stakeholder input for a comprehensive evaluation.
Introduction
Technological advances have fostered the adoption of new digital health (DH) technologies [ 1 ]. Such adoption has been so rapid that negative side effects such as uncoordinated implementation have resulted [ 2 ]. Uncoordinated development can lead to siloed information systems with limited interpretability with other information systems [ 3 ]. To combat uncoordinated development, countries have developed digital health strategies (DHSs) to set strategic guidance for the future development of DH technologies, often aligned with their own national health priorities. The World Health Organization (WHO) developed the Global Strategy on Digital Health 2020-2025 (GSDH) to provide global guidance to member countries in defining their DHSs [ 4 ]. It is the first comprehensive strategy for DH globally [ 5 ]. The GSDH encourages the development of national DHSs based on expert knowledge and WHO member state consensus. National DHSs often fail to capture the most emergent technologies such as artificial intelligence (AI), machine learning, or drones because of their fast development cycles, which can lead to uncoordinated development and adoption [ 6 ]. While no country has reported that they used the GSDH specifically to develop their national DHS yet, the GSDH may have informed elements of national DHS and existing DHSs can be assessed for their consistency with the GSDH.
Tanzania’s Ministry of Health recognizes the importance of DH technologies in health care delivery and has published 2 strategy documents within the last decade. The Tanzania National eHealth Strategy 2013-2018 focused on the infrastructure and technologies needed to support the transformation of the health sector [ 7 ]. In contrast, the latest Digital Health Strategy July 2019-June 2024 addresses, among other aspects, challenges that have not been addressed or solved and the best use of technology to improve patient care [ 8 ]. It also focuses on strategic priorities aligned with the WHO health system building blocks and advocating user-centric, interoperable, and data-driven DH interventions.
Germany has a federal system of government, with 16 state-level ministries of health and 1 Federal Ministry of Health (FMoH) plus other institutions responsible for different areas of DH. Between 2015 and 2021, each entity published corresponding strategies, strategic documents, recommendations, or legislation about the digitalization of health care in Germany, many of which were included in this study. Before the publication of its first National Digitalization Strategy in March 2023 [ 9 ], Germany lacked a uniform strategy with binding goals and guidelines.
Tanzania and Germany have a history of cooperation in socioeconomic development, including health sector improvement. The 2 countries were chosen as case studies of the development of DHS in the global South and North. We draw on our own extensive experience in developing and implementing DH systems in these 2 countries. The purpose of this study is to investigate the key elements and possible shortcomings of the DHSs of Tanzania and Germany, investigate their alignment with the WHO GSDH, and make applicable recommendations to improve the DHS for the 2 countries. We also aim to identify aspects of the WHO GSDH that are challenging for countries to implement. The comparison of the WHO GSDH with the DHSs of Tanzania and Germany is intended as a case study for this policy comparison approach to conduct additional analyses and share this method with other researchers to stimulate similar analyses in other countries.
We compared the DHSs of Tanzania and Germany and assessed their consistency with the WHO’s GSDH, using a document analysis and comparative policy analysis approach [ 10 , 11 ]. We selected Tanzania and Germany as case studies for this comparison, as the researchers had in-depth knowledge about the health care systems and the state of DH in the 2 countries. This in-depth understanding is a requirement for case studies in comparative policy analyses [ 11 ]. We searched for the relevant primary data sources through searches in academic databases, through search engines, and based on the expert knowledge of the researchers and other subject matter experts. We identified primary data sources that were national eHealth policy documents and technology and health-related policy documents (see Textbox 1 ).
Global Strategy on Digital Health 2020-2025—World Health Organization [ 4 ]
Digital Health Strategy July 2019-June 2024—Tanzania [ 8 ]
Different Approaches of Digital Health Strategies—Germany (various sources, a list of all included laws and regulations can be found in the Results section)
Once the primary data sources were identified, data extraction and analysis were done in six steps: (1) development of a category system for data extraction and analysis; (2) data extraction; (3) assessment of the data from Germany and Tanzania for their compliance with the GSDH; (4) analysis of similarities and differences between of the strategies of Germany and Tanzania; (5) categorical summary and regrouping into policy, infrastructural, and human factors; and (6) assessment of how new technologies are incorporated in each strategy.
In the first step of this study, we created a deductive category system to assess consistency with the WHO’s GSDH 2020-2025. This step was conducted by 1 researcher (JK) and validated by a second researcher (FH). The categories were derived from the 4 dimensions defined in the GSDH:
- collaboration and knowledge transfer
- advance the implementation of national DHSs
- strengthen governance for DH at global, regional, and national levels
- integrated people-centered health systems enabled by DH technologies
Data from the primary data sources were extracted and classified into 1 of the 4 categories by 1 researcher (JK). A second researcher (FH) validated both the extrication and the classification. After the initial classification, the results within each category were categorized into one of the three subsections: (1) policy options, (2) measures, or (3) outcomes. The initial categorization was done by 1 researcher (JK) and validated by a second researcher (FH).
After the extrication and categorization were completed, we assessed all extracted data for compliance with the GSDH (initial assessment by JK, validation for Germany by FH and for Tanzania by FS). In the second step of the analysis, we identified similarities and differences in the strategies (initial assessment by JK, validation for Germany by FH and for Tanzania by FS). Following an inductive content analysis (by JK), in a third step, the extracted data were summarized categorically and regrouped into policy, infrastructural, and human factors [ 12 ] (by JK, and validated by FH and FS). Finally, as the fourth and last step, the extent to which new technologies such as AI, machine learning, or drones were included in the DHSs was assessed (initial assessment by JK, validation for Germany by FH and for Tanzania by FS). A detailed breakdown of the results of the policy comparison by aspect can be found in the Multimedia Appendix 1 .
Ethical Considerations
This study only analyzed policy documents. No human subjects were investigated or personal data analyzed. All data that were handled as part of this study were stored and analyzed on encrypted devices. Any personal identifiers from the primary data, such as author names or contact details were removed during data extraction of the primary data into our data set. The extracted data are available in a summarized form in the Multimedia Appendix 2 [ 4 , 7 - 9 , 13 - 27 ] and the full data set is available on request from the authors.
Consistency With the WHO’s GSDH 2020-2025
Both Germany’s and Tanzania’s DHS include most of the 35 elements from the WHO’s GSDH. Both DHSs do not include 5 elements each. The items that are not included are shown in Table 1 .
a GSDH: Global Strategy on Digital Health 2020-2025.
b DHS: digital health strategy.
(1) Collaboration and Knowledge Transfer
As a member of the European Union, Germany is involved in shaping a global DHS and published the strategy document Strategy of the Federal Government on Global Health in 2020 [ 13 ]. Germany participates in various programs such as Horizon Europe, aiming to promote a knowledge- and innovation-based society and a competitive, sustainable economy [ 14 ]. Multi-stakeholder meetings are convened to overcome the implementation hurdles of digitale gesundheitsanwendungen (DiGAs) and innovations through various initiatives. For example, the goal of the German Alliance for Global Health Research is to expand its research network [ 15 ]. To facilitate the exchange of results with partners and institutions across countries, the focus of the German Alliance for Global Health Research is also on a research-compatible data infrastructure with international standards [ 16 ]. Knowledge transfer, especially to the global south is an integral part of the German strategy.
Tanzania’s strategy focuses primarily on national challenges and opportunities. The aim is to improve health services at all levels of the country’s health system [ 8 ]. Key stakeholders are assigned to sectors in the strategy [ 8 ]. According to priority 3 of Tanzania’s strategy, a knowledge management approach will be expanded and developed only at the population and health worker level, for example, through e-learning platforms [ 8 ]. More digital solutions are being developed, according to priority 10 [ 8 ], to improve surveillance of and reporting on notifiable diseases, disease outbreaks, and disasters to prevent loss of life and socioeconomic impact [ 28 ].
(2) Advance the Implementation of National DHSs
Due to the prevailing federalism in Germany, each federal state has its own Ministry of Health at the state level and can therefore enact its own laws and rules. However, higher-level legislation such as the E-Health Law [ 17 ], which was introduced in 2015, can force the federal states to adapt to the national strategy. The E-Health Law has set the initial course for the development of the secure telematics infrastructure (TI) and the introduction of DiGAs. The law is driving forward digitalization in the health care sector for the benefit of patients. It contains a roadmap for the introduction of a digital infrastructure and allows insured persons to benefit from specific applications [ 17 ]. In addition, at annual conferences, the health ministers of all federal states represent and discuss the interests of the federal states and health policy issues [ 18 ]. Instead of a national digitization strategy, Germany has formal roadmaps based on legislation and recommendations, such as the Roadmap Digital Health [ 19 ]. Within the framework of the Innovation Forum Digital Health 2025 of the FMoH , 5 fields of action for the future have been defined, which function as a target and implementation blueprint. The five fields are (1) building a sustainable basis, (2) digital care as the normality, (3) overcoming institutional and sectoral (digital) boundaries, (4) strengthening data literacy—making health data usable, and (5) using new technologies to enable individualized medicine [ 16 ]. However, a clear and structured prioritization to achieve the goals is not evident.
To lead Tanzania into the digital age and guide progress and development, the government developed the Digital Health Strategy July 2019-June 2024 . This strategy includes a clear prioritization derived from the National Health Policy 2019 and complemented by a rigorous consultation process with key stakeholders in the health sector [ 8 ]. It sets standards for data and technologies and strengthens interoperability between systems and sectors [ 8 ]. “Improving the legal and regulatory framework to ensure client safety, data security, confidentiality, and privacy” is identified in priority 1 [ 8 ]. It identifies the development of a change management plan as an essential factor for the successful implementation and adoption of DH solutions.
(3) Strengthen Governance for DH at Global, Regional, and National Levels
In Germany, several laws and regulations came into force in 2019 and the following years, leading to a stable legal framework for DH. Most recently, the Health IT Interoperability Governance Regulation was published in 2021, specifying the tasks of the interoperability coordination unit and the expert panel [ 20 ]. Other programs, such as the innovation initiative “Data for Health: Roadmap for Better Patient Care through Health Research and Digitalization” [ 21 ], and various working groups, deal with data context [ 22 ]. DiGAs are described as particularly innovative and are defined as prescription applications reimbursable by the public health insurance system [ 29 ]. As such, DiGAs must meet high requirements and demonstrate an evidence-based medical benefit. All these laws and regulations were related to DH. An overview of them can be found in Table 2 .
For Tanzania, Digital Health Strategy July 2019-June 2024 identifies responsibilities and organizations for a sustainable governance structure and specified projects for developing guidelines for implementation and creating a legal and regulatory framework for DH under priority 1 [ 8 ]. According to priority 6, the aim is to develop analytical tools and indicators with the data and use them for evidence-based interventions and decision-making [ 8 ].
Tanzania explicitly mentions strengthening programs for continuous professional development of health workers in the use of data. Priority 6 is to include aspects of data use in health care worker educational and professional development curricula [ 8 ]. In addition, there is a focus on networking health professionals by introducing digital platforms such as e-learning (priority 3) [ 8 ].
(4) Integrated People-Centered Health Systems Enabled by DH Technologies
The German federal government wants to promote patient autonomy. Implementing a national electronic patient file enables patients to retain complete control over their data and retain decision-making authority over their medical records [ 30 ]. To promote accessibility to health tools, a national health portal was created [ 31 ] . In addition, the German government wants to promote personalized treatment approaches in all important disease categories and foster early cooperation between stakeholders from science, industry, regulatory authorities, and the medical and patient communities [ 32 ]. The Digital Care and Nursing Modernisation Act stipulates that, in the future, more DiGAs, digital nursing applications, and telemedical applications should support doctors and nurses and help them perform their tasks more efficiently [ 23 ]. To enable the government to monitor the current state of digitization, the gematik (gematik GmbH) has developed a dashboard of key performance indicators that tracks the TI in Germany. Further, gematik is the public entity tasked with developing and maintaining the TI in the country [ 33 ]. Germany has not adopted formal strategic approaches to strengthening gender equality and inclusion in the context of digitalization.
Tanzania’s DHS focuses heavily on using digital technologies and improving DH competencies. The aim of priority 3 is to provide specialized care to underserved facilities using digital technologies and train health workers with the appropriate skills [ 8 ]. The objective is to improve health care facility processes through digital solutions, such as electronic referrals, which also helps to relieve the demand on staff resources (priority 2) [ 8 ]. Health information should be shared and disseminated using mobile health, short messaging services, mobile apps, and web apps, thus contributing to patient education (priority 4) [ 8 ]. For the government to assess and improve the quality of health services efficiently, priority 6 is to introduce digital solutions for monitoring facilities [ 8 ]. Priority 8 also describes measures using digital tools to monitor human resources [ 8 ]. However, approaches to strengthen gender equality and accessibility for people with disabilities to promote an inclusive digital society are not addressed.
Similarities and Differences in the Strategies
Our evaluation system is based on the degree to which the policy options, measures, and outputs of each country fulfill the respective dimensions of the WHO strategy from today’s perspective. The 4 rating options are 0=not present, 1=partly fulfilled, 2=largely fulfilled, and 3=completely fulfilled. Multimedia Appendix 3 illustrates the results. The analysis highlights Tanzania’s plans to strengthen national health policy through targeted implementation measures in the strategy. On the other hand, Germany fulfills all the points recommended by the WHO by expanding its cross-standard data infrastructure. While both countries consider a people-centered health system to be highly relevant, we nevertheless rate the current measures as just above average due to, for example, the lack of gender equality and inclusion concepts in the context of digitalization in the strategies. Strengthening governance for DH at global, regional, and national levels is only partially met in both strategies. In particular, the development of leadership for informed decision-making and the expansion of the strategy to a global perspective limit the fulfillment of the dimension. There is an overall similarity between both countries in terms of their overall progress on their respective DHS. Individual different focus points have therefore already been identified.
In the following, the extracted data were summarized categorically and regrouped into policy, infrastructural , and human factors .
Policy Factors
The WHO GSDH includes a vision, strategic goals, a framework for action, and principles for implementation to advance DH globally and at the state level. Until March 2023, Germany did not develop a national digitization strategy. Priority topics can be found in political documents such as Digital Health 2025. Although most elements of the WHO are mentioned, various aspects are weighted differently. Germany focuses on overcoming sectoral care boundaries and developing innovative technologies such as AI.
While Germany uses national legislation to create a comprehensive legal framework aligned with its national health system, Tanzania has already established governance structures and is now focusing on building the capacity of new members and stakeholders at lower levels. Tanzania’s national strategy is based on a vision, associated goals, and clearly articulated priorities. Among these strategic priorities are all 4 main key points identified in the WHO GSDH. Tanzania also complements the WHO GSDH and strives, among other things, to improve supply chain management of health commodities and to improve human resource management at all levels of the health system. Compared to Germany, Tanzania’s strategy details developing a change management plan.
Infrastructure Factors
The WHO aims to promote international cooperation by intensifying knowledge transfer among member states. As part of the European Union, Germany pools its resources for international projects and programs and supports DH globally. One of the goals is to create a research-compatible data infrastructure to strengthen the interoperability of systems following international data exchange standards. In Germany, the gematik dashboard is used as an assessment tool to make an initial assessment of the maturity of digital solutions. As part of the European Union, Germany has an overarching basic regulation in the form of the General Data Protection Regulation [ 33 ].
Tanzania has also developed the Tanzania Health Enterprise Architecture, an approach developed to simplify the complexity of health information systems, guide the development of DH solutions, and facilitate system interoperability [ 26 ]. The Tanzanian government highly prioritizes safeguarding the security of sensitive personal data, such as medical information, and is dedicated to improving the legal and regulatory framework to ensure data security, confidentiality, and privacy protection.
Human Factors
Both Tanzania and Germany aim to place patients at the center of their health care systems but take different approaches to achieve this end. Germany actively strives to integrate the patient into health care delivery processes. Germany also aims to intensify research into personalized medicine. Digital solutions such as DiGAs or digital nursing applications (digital applications to support nursing care) focus on providing relief to medical and nursing staff, for example, by supporting labor-intensive tasks such as medical documentation.
Tanzania plans to use client-centric technologies to respond to clients’ needs through user-centered design to ensure a responsive, resilient, and inclusive health system. In terms of health care staff, Tanzania is investing in education and training to improve the digital skills of its health care system staff. Only Tanzania’s DHS mentions the need to promote health care management staff briefly, and neither Tanzania’s nor Germany’s DHS defines such steps. Similarly, neither strategy addresses strengthening gender equality and inclusion in digitalization.
Incorporation of New Technologies
New technologies and developments in the health care system can be used to overcome care bottlenecks by increasing efficiency and effectiveness and thus reduce overuse, underuse, and misuse of health care [ 34 ].
The WHO recommends introducing sustainable financing models to benefit from the opportunities, realize the full potential of these innovations, and support the exchange of knowledge [ 4 ].
To strengthen public health services, the government of Tanzania has focused on developing and expanding information and communication technologies (ICTs). However, further investment is needed to harness the ICT infrastructure for effective data systems such as AI. The goal is to use the huge amounts of data already being collected today effectively and productively. In collaboration with development partners, the Tanzanian government is looking for ways to increase investment in and use of health data systems [ 27 ].
In a scoping review conducted by Sukums et al [ 35 ] in 2021, a total of 16 publications were identified to have explored the use of AI-driven solutions in Tanzania’s health sector. The review called for Tanzania to establish a national AI policy and a regulatory framework for adopting reliable AI solutions in the health sector in line with the WHO guidance on ethics and governance of AI for health.
The German federal government’s Hightech-Strategy 2025, creates a basis for investing in innovation by providing incentives for investment [ 24 ]. The federal government thus supports local health structures with direct funding and promotes synergies with the private sector and health promotion and disease prevention approaches.
The Federal Ministry of Education and Research has allocated around 250 million euros from 2018 to 2025 for therapy and care concepts implementing AI [ 36 ]. The Innovation Committee of the Joint Federal Committee also continuously promotes new technologies used in innovative forms of health care provision [ 37 ]. There are many different models for funding new technologies in Germany, many of which involve limited and temporary funding. A sustainable strategy or roadmap for developing and implementing innovative solutions is lacking.
Global Digital Health Monitor
We also retrieved the assessments for Tanzania and Germany from the Global Digital Health Monitor [ 38 ]. Tanzania received a rating in terms of an overall DH phase of 4 (out of 5, with 1 being the lowest phase and 5 the highest) and Germany received a 5. For Germany, 4 out of 7 categories were not assessable. Scores for all categories are displayed in Table 3 .
a N/A: not applicable.
Principal Findings
Both Germany’s and Tanzania’s DHS include most of the 35 elements from the WHO’s GSDH. While both DHSs fail to include 5 of the 35 elements, they each include additional aspects not included in the GSDH that relate to their own country-specific health care system challenges. The Tanzanian DHS emphasizes (1) quality aspects and data use, (2) digital solutions for supply chains and resource optimization, and (3) human resources. These aspects are oriented toward national health priorities at all health system levels. In contrast, the German DHS focuses mainly on overcoming sectoral boundaries. Overall, both countries consider context in formulating goals and priorities. Both countries also receive high ratings on the Global Digital Health Monitor, with an overall DH phase rating of 4 out of 5 for Tanzania and 5 out of 5 for Germany. Tanzania has already developed its digitalization strategy for the health sector and identified tangible goals, priorities, and measures. In contrast, Germany does not have a unified strategy and is trying to cover a large distance by taking small steps. All the policies from Germany included in this analysis are from the federal level, meaning that even though Germany is a federal republic, the investigated strategies apply to the whole country.
Tanzania mainly uses new technologies to strengthen its health care system and improve the health and quality of life of its population through intensive health education of the population. Further, one requirement to achieving these goals is to move toward universal access to fiber optic cable and mobile. In recent years, the Tanzanian government has intensified the expansion of ICTs and focused intently on expanding the use of mobile health and telemedicine. It also recognizes the enormous potential of processing large data and has entered public-private funding partnerships to accelerate data infrastructure development and drive innovation. However, as evidenced by the not entirely successful use of machine learning to predict and stem cholera outbreaks, such practices still have weaknesses, and there is a lack of experts skilled in securely collecting, processing, and interpreting large data [ 35 ]. In its latest DHS, Tanzania commits to deepening the competencies of health care workers by intensifying e-learning, training, and new curricula. The Tanzanian government is actively trying to improve the health care situation in its country and is looking into sustainable financing models. Addressing the cost implications of DH is a key factor for future DHS development. Germany, meanwhile, is involved in helping to shape global health priority-setting and policy making. Its national ministries are promoting financing models for new technologies and innovations from the public sector and initiatives from the private sector. The field of AI has enormous potential for optimizing processes and improving medicines and other treatments. Developing countries like Tanzania are critical partners for research, innovation, and development, and their progress is crucial for strengthening global health.
A main recommendation for Germany based on the presented analysis would have been to develop a unified DHS. Given that the FMoH published its first digitization strategy in March 2023 [ 9 ], it is advisable to review the previous results and compare them with the goals and measures actually achieved. Developing, implementing, and assessing a DHS requires human capacity, expert knowledge of the current health care system challenges and deployments as well as the legal, social, and ethical framework are needed.
In addition, we recommend the development of step-by-step guidelines and a digital tool for the assessment of national DHSs and their consistency with the WHO’s GSDH, including a recommended benchmarking with a digital maturity model. An important aspect of the guidelines needs to be the ability to capture context-specific elements and adaptations of national DHSs. Having such an assessment tool will enable the comparison of DHSs between countries and provide an overview of the usage of the WHO GSDH as it is a very valuable blueprint for national DHSs.
Limitations
This study has several limitations. First of all, there is a temporal limitation. DHSs evolve and are updated frequently. The Tanzanian DHS was published 1 year before the WHO GSDH, while different parts of the German strategies were published over several years. Therefore, this work is the state of DHSs in the 2 case study countries as of February 2023, when the analysis was conducted. For instance, the new German Digitalisation Strategy for Health and Care, which was released in March 2023, is not included yet. In addition, there are methodical limitations associated with the policy analysis approach that solely rely on the analysis of policy documents. This may have led to certain aspects not being included in the analysis or being underreported. This applies especially to the case study of Germany with its fragmented strategy across a large number of disparate documents. The level of granularity of the current analysis could be another limitation. Certain aspects of the analysis may have been neglected due to this level of granularity. A more comprehensive evaluation with interviews or surveys with stakeholders could help to provide a deeper understanding.
The WHO’s GSDH is a valuable blueprint for developing DHSs. Both Tanzania and Germany have developed strategic guidelines aligned with their own national health care priorities. A federal governmental structure, such as in Germany, makes implementing a national DHS more challenging, often leading to many different strategic approaches and priorities. The extremely rapid development and advancement of emerging technologies is a challenge when their development outpaces the speed at which strategies are adapted and implemented, potentially leading to uncoordinated development. Countries need to develop broad DHSs that guide the future development of the DH ecosystem. These strategies need to include frameworks to support the implementation of new technologies to ensure that these technologies are strategically aligned and revised regularly to ensure alignment with new developments and needs.
For the policy assessment of DHSs, in-depth knowledge of the respective country, its health care needs, and health care system structure is needed. Additional data collection, for example, through interviews and surveys with stakeholders, is needed in addition to document reviews to conduct a holistic assessment of a country’s DHS.
Acknowledgments
The authors thank Prof Dr Zahra Meidanii for her input on the idea of this study. This study would not have been possible without the support of Neu-Ulm University of Applied Sciences.
Data Availability
The data sets generated or analyzed during this study are available from the corresponding author upon reasonable request.
Conflicts of Interest
None declared.
Detailed breakdown of the results of the policy comparison by aspect.
Overview of the policy documents mentioned in the methods section with web links.
Evaluation of the strategies of Tanzania and Germany in term of their fulfillment of the 4 dimensions of WHO strategy.
- Frank SR. Digital health care--the convergence of health care and the Internet. J Ambul Care Manage. 2000;23(2):8-17. [ CrossRef ] [ Medline ]
- Zanaboni P, Ngangue P, Mbemba GIC, Schopf TR, Bergmo TS, Gagnon MP. Methods to evaluate the effects of internet-based digital health interventions for citizens: systematic review of reviews. J Med Internet Res. 2018;20(6):e10202. [ FREE Full text ] [ CrossRef ] [ Medline ]
- Stroetmann KA. From siloed applications to national digital health ecosystems: a strategic perspective for African countries. Stud Health Technol Inform. 2019;257:404-412. [ CrossRef ] [ Medline ]
- Global strategy on digital health 2020-2025. World Health Organization. 2021. URL: https://tinyurl.com/58d488cu [accessed 2024-02-21]
- Mariano B. Towards a global strategy on digital health. Bull World Health Organ. 2020;98(4):231-231A. [ FREE Full text ] [ CrossRef ] [ Medline ]
- Mbunge E, Muchemwa B, Jiyane S, Batani J. Sensors and healthcare 5.0: transformative shift in virtual care through emerging digital health technologies. Glob Health J. 2021;5(4):169-177. [ FREE Full text ] [ CrossRef ]
- Tanzania national eHealth strategy 2013-2018. The United Republic of Tanzania, Ministry of Health and Social Welfare. 2013. URL: https://tinyurl.com/ykr823up [accessed 2024-02-07]
- Digital health strategy July 2019-June 2024. Ministry of Health, Community Development, Gender, Elderly and Children. 2019. URL: https://tinyurl.com/hsnc4wdn [accessed 2024-02-06]
- DIGITAL TOGETHER Germany’s Digitalisation Strategy for Health and Care. German Federal Ministry of Health. 2023. URL: https://tinyurl.com/4se9vynp [accessed 2024-02-21]
- Bowen GA. Document analysis as a qualitative research method. Qual Res J. 2009;9(2):27-40. [ FREE Full text ] [ CrossRef ]
- Peters BG, Fontaine G, editors. Handbook of Research Methods and Applications in Comparative Policy Analysis. UK. Edward Elgar Publishing; 2020.
- Mayring P. Combination and integration of qualitative and quantitative analysis. Forum Qual Sozialforschung Forum Qual Soc Res. 2001;2(1):6. [ FREE Full text ]
- Strategie der bundesregierung zur globalen gesundheit. Bundesministerium für Gesundheit. 2020. URL: https://tinyurl.com/mspzuvup [accessed 2024-02-06]
- Horizont Europa programm 2021. Bundesministerium für Bildung und Forschung. 2021. URL: https://www.horizont-europa.de/de/Programm-1710.html [accessed 2024-02-06]
- German Alliance for Global Health Research. 2022. URL: https://globalhealth.de [accessed 2024-02-06]
- Digitale Gesundheit 2025. Bundesministerium für Gesundheit. 2020. URL: https://tinyurl.com/3wcv7fzf [accessed 2024-02-06]
- Gesetz für sichere digitale Kommunikation und Anwendungen im Gesundheitssektor. Bundesministerium für Gesundheit. 2015. URL: https://www.bundesgesundheitsministerium.de/ [accessed 2024-02-06]
- Die GMK. Gesundheitsministerkonferenz. 2018. URL: https://www.gmkonline.de/Die-GMK.html [accessed 2024-02-06]
- Roadmap digitale gesundheit. Bertelsmann Stiftung. 2018. URL: https://tinyurl.com/46znvkbd [accessed 2024-02-06]
- Gesundheits-IT Interoperabilität Governance Verordnung. In: Bundesministerium für Gesundheit. Verlag. Bundesanzeiger; 2021.
- Bundesregierung. Daten helfen heilen. Germany. Federal Ministry for Education and Research; 2020. URL: https://tinyurl.com/3pvzjzns [accessed 2024-02-07]
- Arbeitsgruppe: Datenschutz und IT-Sicherheit im Gesundheitswesen (DIG). GMDS e.V. 2022. URL: https://www.gesundheitsdatenschutz.org/download/einwilligung_2021.pdf [accessed 2024-02-06]
- Entwurf eines gesetzes zur digitalen Modernisierung von Versorgung und Pflege (Digitale-Versorgung-und-Pflege-Modernisierungs-Gesetz – DVPMG). Bundesministerium für Gesundheit. 2022. URL: https://tinyurl.com/mryefka6 [accessed 2024-02-06]
- Hightech-Strategie 2025. Bundesministerium für Bildung und Forschung. 2021. URL: https://tinyurl.com/m5kcuua [accessed 2024-02-06]
- Directorate-General for Health and Food Safety. Proposal for a regulation - The European Health Data Space. European Commission. 2022. URL: https://tinyurl.com/mfrst9j4 [accessed 2024-02-06]
- Tanzania Health Enterprise Architecture (TZHEA). Ministry of Health, Community Development, Gender, Elderly and Children. 2019. URL: http://api-hidl.afya.go.tz/uploads/library-documents/1617092274-3I9GuToO.pdf [accessed 2024-02-06]
- Tanzania digital health investment road map 2017-2023. Ministry of Health, Community Development, Gender, Elderly and Children. 2017. URL: http://api-hidl.afya.go.tz/uploads/library-documents/1573688147-xrkVuNtD.pdf [accessed 2024-02-06]
- Mremi IR, Rumisha SF, Sindato C, Kimera SI, Mboera LEG. Comparative assessment of the human and animal health surveillance systems in Tanzania: opportunities for an integrated one health surveillance platform. Glob Public Health. 2023;18(1):2110921. [ FREE Full text ] [ CrossRef ] [ Medline ]
- Das DiGA-verzeichnis. Antworten zur nutzung von DiGA. Bundesinstitut für Arzneimittel und Medizinprodukte. 2022. URL: https://diga.bfarm.de/de [accessed 2024-02-06]
- ePA, Persönliche daten, persönliche entscheidungen. Gematik. 2022. URL: https://www.gematik.de/anwendungen/e-patientenakte [accessed 2024-02-06]
- Gesundheit und digitalisierung. Gesund.bund.de. 2022. URL: https://tinyurl.com/4n9be32u [accessed 2024-02-06]
- Personalisierte medizin. Bundesministerium für Bildung und Forschung. 2022. URL: https://www.gesundheitsforschung-bmbf.de/de/personalisierte-medizin-9459.php [accessed 2024-02-06]
- Gematik. TI Dashboard, Digitalisierung im Überblick. URL: https://www.gematik.de/telematikinfrastruktur/ti-dashboard [accessed 2024-02-06]
- Künstliche intelligenz und assistenzroboter: neue technologien im gesundheitswesen stärker nutzen. Zukunftsrat der Bayerischen Wirtschaft. 2022. URL: https://tinyurl.com/4htpu6xp [accessed 2024-02-06]
- Sukums F, Mzurikwao D, Sabas D, Chaula R, Mbuke J, Kabika T, et al. The use of artificial intelligence-based innovations in the health sector in Tanzania: a scoping review. Health Policy Technol. 2023;12(1):100728. [ FREE Full text ] [ CrossRef ]
- Karliczek: mit künstlicher intelligenz das gesundheitssystem besser auf künftige krisen vorbereiten. Bundesministerium für Bildung und Forschung. 2021. URL: https://tinyurl.com/2f8d6jb8 [accessed 2024-02-06]
- Innovationsfonds. Gemeinsamer Bundesausschuss. 2022. URL: https://innovationsfonds.g-ba.de [accessed 2024-02-06]
- Global Digital Health Monitor. 2023. URL: https://digitalhealthmonitor.org/ [accessed 2024-02-06]
Abbreviations
Edited by A Mavragani; submitted 26.08.23; peer-reviewed by N O'Brien, E Vashishtha, H Durrani; comments to author 02.11.23; revised version received 28.11.23; accepted 31.01.24; published 18.03.24.
©Felix Holl, Jennifer Kircher, Attila J Hertelendy, Felix Sukums, Walter Swoboda. Originally published in the Journal of Medical Internet Research (https://www.jmir.org), 18.03.2024.
This is an open-access article distributed under the terms of the Creative Commons Attribution License (https://creativecommons.org/licenses/by/4.0/), which permits unrestricted use, distribution, and reproduction in any medium, provided the original work, first published in the Journal of Medical Internet Research, is properly cited. The complete bibliographic information, a link to the original publication on https://www.jmir.org/, as well as this copyright and license information must be included.
Synchronous versus metachronous spinal metastasis: a comparative study of survival outcomes following neurosurgical treatment
- Open access
- Published: 19 March 2024
- Volume 150 , article number 136 , ( 2024 )
Cite this article
You have full access to this open access article
- Mohammed Banat ORCID: orcid.org/0000-0001-7986-5215 1 ,
- Anna-Laura Potthoff 1 ,
- Motaz Hamed 1 ,
- Valeri Borger 1 ,
- Jasmin E. Scorzin 1 ,
- Tim Lampmann 1 ,
- Harun Asoglu 1 ,
- Logman Khalafov 1 ,
- Frederic C. Schmeel 2 ,
- Daniel Paech 2 ,
- Alexander Radbruch 2 ,
- Louisa Nitsch 3 ,
- Johannes Weller 3 ,
- Ulrich Herrlinger 4 ,
- Marieta Toma 5 ,
- Gerrit H. Gielen 6 ,
- Hartmut Vatter 1 &
- Matthias Schneider 1
Patients with spinal metastases (SM) from solid neoplasms typically exhibit progression to an advanced cancer stage. Such metastases can either develop concurrently with an existing cancer diagnosis (termed metachronous SM) or emerge as the initial indication of an undiagnosed malignancy (referred to as synchronous SM). The present study investigates the prognostic implications of synchronous compared to metachronous SM following surgical resection.
From 2015 to 2020, a total of 211 individuals underwent surgical intervention for SM at our neuro-oncology facility. We conducted a survival analysis starting from the date of the neurosurgical procedure, comparing those diagnosed with synchronous SM against those with metachronous SM.
The predominant primary tumor types included lung cancer (23%), prostate cancer (21%), and breast cancer (11.3%). Of the participants, 97 (46%) had synchronous SM, while 114 (54%) had metachronous SM. The median overall survival post-surgery for those with synchronous SM was 13.5 months (95% confidence interval (CI) 6.1–15.8) compared to 13 months (95% CI 7.7–14.2) for those with metachronous SM ( p = 0.74).
Conclusions
Our findings suggest that the timing of SM diagnosis (synchronous versus metachronous) does not significantly affect survival outcomes following neurosurgical treatment for SM. These results support the consideration of neurosurgical procedures regardless of the temporal pattern of SM manifestation.
Avoid common mistakes on your manuscript.
Introduction
Systemic tumor disease with singular or multiple spinal metastases (SM) has assumed an increasingly prominent role in the daily clinical practice of spine surgeons and the lives of affected patients (Coleman 2006 ; Brande et al. 2022 ). It is estimated that approximately 5–15% of all cancer patients will ultimately develop spinal metastases (Brande et al. 2022 ; Jenis et al. 1999 ; Jacobs and Perrin 2001 ). Among the primary culprits are breast cancer, prostate cancer, and lung cancer, with the primary tumor remaining elusive in 3–10% of cases (Greenlee et al. 2000 ; Ulmar et al. 2007 ).
In the therapeutic arsenal for this profoundly affected patient population, surgery stands as a common treatment modality (Furlan et al. 2022 ). After lungs and liver, skeletal system and bones bear the brunt of systemic metastases (Macedo et al. 2017 ; Maccauro et al. 2011 ). Surgical options for managing spinal metastases encompass a spectrum, from biopsy coupled with vertebroplasty or kyphoplasty (Stangenberg et al. 2017 ; Georgy 2010 ), to spinal canal decompression in isolation (Patchell et al. 2005 ), or in conjunction with minimally invasive percutaneous procedures (Miscusi et al. 2015 ) and open instrumentation with augmented screws (Ringel et al. 2017 ; Park et al. 2019a ), at times necessitating anterior–posterior stabilization (Ulmar et al. 2006 ; Gezercan et al. 2016 ). The overarching objective of surgical intervention is the mitigation or prevention of neurological deficits, coupled with a focus on enhancing the patient’s quality of life (Fehlings et al. 2016 ; Depreitere et al. 2020 ). Additionally, surgery provides a means to attain a definitive histological diagnosis of the spinal tumor lesion and potentially improves overall survival (OS) (Patchell et al. 2005 ; Krober et al. 2004 ).
SM may arise within the context of a previously known and managed systemic cancer disease (metachronous presentation), often preceded by multimodal therapies, such as radiation, systemic chemotherapy, immunotherapy, or specifically targeted therapies (Gerszten et al. 2009 ; Berger 2008 ; Choi et al. 2015 , 2019 ). Alternatively, newly diagnosed SM may serve as the inaugural presentation of a previously undiscovered systemically disseminated cancer (synchronous presentation) (Jacobs and Perrin 2001 ; Bollen et al. 2018 ; Patnaik et al. 2020 ).
Despite existing literature, it remains uncertain whether the choice to surgically resect SM in cases of synchronous versus metachronous presentation significantly influences surgical decisions and patient survival. This study seeks to clarify this issue by examining the prognostic implications of synchronous versus metachronous SM diagnoses, measured from the day of neurosurgical SM resection, in patients who underwent surgical intervention for SM.
Patients and inclusion criteria
This study is based on consecutive patients aged >18 years who had undergone primary spinal canal decompression, with or without instrumentation, for SM between 2015 and 2020 at the neurosurgical department of the University Hospital Bonn. Comprehensive clinical data, including age, gender, primary tumor type, SM location, details of the neurosurgical procedure, the extent of spinal vertebrae involvement, American Society of Anesthesiologists (ASA) score, clinical-neurological assessment, and functional status measured by the American Spinal Injury Association (ASIA) Score ( 2019 ), were recorded.
Functional status was further evaluated using the Karnofsky Performance Scale (KPS) upon admission, categorizing patients into KPS ≥ 70% or KPS < 70%, as previously described (Schuss et al. 2021 ; Hamed et al. 2023 ; Schweppe et al. 2023 ; Ilic et al. 2021 ). The Charlson Comorbidity Index (CCI) was employed to quantify the comorbidity burden of patients before undergoing surgery (Hamed et al. 2022a ; Schneider et al. 2020 ; Lehmann et al. 2023 ).
Overall survival (OS) was calculated from the date of surgical SM resection until death as previously described (Hamed et al. 2022b ). Patients for whom no further follow-up information regarding survival was obtainable, typically due to ongoing treatment at external healthcare institutions, were excluded from subsequent statistical survival analysis.
Following histopathological analysis, all patients underwent thorough assessment by our internal Neurooncological Tumor Board, comprised of neurosurgeons, radiation therapists, neurooncologists, and neuroradiologist. Recommendations for post-surgery management were established through interdisciplinary consensus, occasionally coordinated with the treatment plans of referring physicians (Schafer et al. 2021 ).
Patients were categorized into two distinct cohorts for further analysis: those with SM diagnosed as a manifestation of a previously known cancer (metachronous presentation) and those with a new diagnosis of SM as the initial indication of an undiscovered cancer (synchronous presentation) (Potthoff et al. 2023 ).
Exclusion criteria encompassed patients classified as non-operable and those lacking complete data or follow-up information. Pertinent clinical parameters, including preoperative functional neurological status, comorbidities, radiological characteristics, primary cancer site, and the timing of diagnosis, were assessed for analysis.
The study adhered to the ethical principles outlined in the 1964 Helsinki Declaration and received approval from the Ethics Committee of the University Hospital Bonn (protocol no. 067/21). Given the retrospective nature of the study, the acquisition of informed consent from participants was not pursued.
Statistical analysis and graphical illustration
Data collection and analysis were conducted utilizing the SPSS computer software package for Windows (Version 27, IBM Corp., Armonk, NY). Categorical variables underwent analysis through contingency tables, employing the Fisher’s exact test when assessing two variables and the chi-square test when evaluating more than two variables. Non-normally distributed data were subjected to the Mann–Whitney U test. Overall survival (OS) rates were assessed using the Kaplan–Meier method, with Graph Pad Prism software for MacOS (Version 9.4.1, Graph pad Software, Inc., San Diego, California, USA) employed for this purpose. Survival rate comparisons were performed utilizing the Gehan–Breslow–Wilcoxon test. To identify predictors of elevated 1-year mortality, a multivariate logistic regression model was constructed using a backward stepwise approach. Statistical significance was determined at p < 0.05. Furthermore, the radar plot was generated using R (Version 3.6.2, Vienna, Austria), as previously outlined in reference (Lehmann et al. 2021 ).
Patient and tumor characteristics
Between 2015 and 2020, 211 patients had undergone resection of SM at the Neurosurgical Department of the University Hospital Bonn. The median patient age at the day of surgery was 66 years (interquartile range (IQR) 57–74 years) (Table 1 ). The most common primary tumor site was the lung (23%), followed by the prostate (22%) and the breast (11%). The thoracic spine was the most commonly affected segment of the spine with 56%. Single or dual-level disease was present in 126 patients (60%), whereas multilevel infiltration was present in 85 patients (40%). The majority of patients (62%) underwent decompression and dorsal stabilization, while spinal canal decompression alone was performed in 38% of the patients. Median CCI of the entire patient cohort was 8 (IQR 6–10). 67% of our cohort presented with a preoperative KPS score of ≥ 70. Median OS for the entire study cohort with surgically treated SM was 13 months (IQR 3–23).
79 of 211 of patients (46%) suffered from synchronous SM, 114 of 211 patients (54%) exhibited metachronous SM. For further more details of patient- and tumor-related characteristics, see Table 1 .
Survival rates do not significantly differ between synchronous and metachronous spinal metastases
In the synchronous SM group, 50 out of 93 patients (54%) succumbed within 1 year following surgical resection, compared to 60 out of 107 patients (56%) in the metachronous SM group ( p = 0.78) (Table 2 ). The mOS for patients with synchronous SM diagnosis was 13.5 months (95% CI 6.1–15.8), while patients with metachronous SM diagnosis exhibited a mOS of 13.0 months (95% CI 7.7–14.2) when calculated from the day of SM surgical treatment ( p = 0.74) (Fig. 1 ).

Kaplan–Meier survival analysis dependent on synchronous vs. metachronous SM occurrence. SM, spinal metastasis; vs., versus
Lung and breast carcinomas were significantly more common in the synchronous group, whereas prostate carcinoma was the most common tumor entity in the metachronous group (Table 2 ). The female gender was also significantly more frequently affected in the synchronous situation, with breast carcinoma being included. All the other parameters included in Table 2 did not significantly differ between the groups of synchronous and metachronous SM (Fig. 2 ; Table 2 ).

Radar plot depicting patient- and disease-related characteristics dependent on synchronous vs. metachronous SM occurrence in patients with surgically treated SM. CCI, Charlson comorbidity index; KPS, Karnofsky performance score; mOS, median overall survival; SM, spinal metastasis; vs., versus
Multivariable analysis for predictors of 1-year mortality
We performed a multivariable regression analysis including the variables sex, preoperative KPS, preoperative CCI, tumor entity, and time of diagnosis (synchronous versus (vs.) metachronous) in order to identify independent predictors of 1-year mortality following surgery for SM.
The multivariable analysis revealed preoperative KPS < 70 (OR 0.1, 95% CI 0.06–0.2, p < 0.001), preoperative CCI > 10 (OR 0.5, 95% CI 0.2–0.9, p < 0.001), and tumor entity breast (OR 0.2, 95% CI 0.07–0.7, p = 0.01) as significant and independent predictors of 1-year mortality (Table 3 ). Time of SM diagnosis (synchronous vs. metachronous SM presentation) did not meet statistical significance (OR 0.7, 95% CI 0.4–1.4, p = 0.3).
This study analyzes the prognostic impact of metachronous vs. synchronous SM diagnosis in patients who had undergone surgical therapy for SM. We found that the time of SM diagnosis does not impact 1-year mortality and patient survival when measured from the day of SM resection.
In the group of patients with SM from lung and breast cancer, SM significantly more often occurred in the synchronous than in the metachronous situation. Compared with this, SM from prostate and other carcinoma significantly more often occurred in the course of the known underlying cancer disease (metachronous situation). Lung cancer is notably associated with the highest incidence of spinal metastases (SM) and brain metastases (BM). The occurrence of SM in lung cancer patients, as reported in the literature, ranges from 5% to a significant 56%. This variation is influenced by factors, such as the histological type of the cancer, the status of the epidermal growth factor receptor (EGFR) mutation, and the stage of the disease (Berghoff et al. 2016 ; Nayak et al. 2012 ; Goncalves et al. 2016 ; Wang et al. 2017 ; Zhang et al. 2020 ; Rizzoli et al. 2013 ). Similarly, SM is observed in 5–15% of breast and prostate cancer cases, making these two types of cancer among the most common to develop SM (Rizzoli et al. 2013 ; Hong et al. 2020 ; Kumar et al. 2020 ; Park et al. 2019b ). The observed difference in the frequency of synchronous versus metachronous spinal metastasis (SM) diagnosis between lung and prostate cancer may be partially attributed to the diagnostic practices for these cancers. Prostate cancer may often be detected during routine medical check-ups for men, leading to earlier diagnosis. In contrast, lung cancer typically remains undetected until it reaches more advanced stages of the disease (Goldsmith 2014 ; Lux et al. 2019 ; Vinas et al. 2016 ).
Our findings regarding the distribution of cancer entities align with those reported in well-established studies (Krober et al. 2004 ; Hosono et al. 2005 ; Sciubba and Gokaslan 2006 ). Consistent with numerous publications, we observed that the thoracic spine was the most frequently affected spinal segment in both synchronous and metachronous SM groups (Bach et al. 1990 ; Comey et al. 1997 ). However, our study did not identify a specific dissemination pattern linked to the primary tumor, such as a preference for lung cancer metastases to manifest singularly or multiply in the thoracic spine, as noted in some reports (Schiff et al. 1998 ; Gilbert et al. 1978 ). Conversely, other researchers have observed a concentration of bronchial carcinoma in the thoracic spine and a predominance of prostate carcinoma in the lumbar spine (Krober et al. 2004 ).
In contemporary literature, the incidence of multiple spinal canal metastases in cases of spinal infiltration with SM is reported to be up to 30% (Sande et al. 1990 ). Our cohort demonstrates a prevalence with 45% in synchronous SM and 36% in metachronous SM involving more than three segments.
To the best of our knowledge, this study is the first to investigate the prognostic impact of synchronous versus metachronous SM. A notable aspect of our approach is the emphasis on postoperative survival in the survival analysis. This focus is crucial as it aligns with the typical juncture at which neurosurgeons encounter patients with spinal metastasis. These findings suggest that the indication for surgery should be considered regardless of whether the SM is synchronous or metachronous. This conclusion is significant for clinical decision-making in neurosurgery, suggesting that the timing of metastasis, in relation to the primary tumor, should not be a deterrent to surgical intervention.
In essence, our findings advocate for a surgical approach in managing spinal metastasis without bias toward the metastasis’ temporal classification. This has direct implications for neurosurgical management, underscoring the importance of considering surgery as a viable treatment option in both synchronous and metachronous scenarios and providing a clear directive for surgical intervention.
Limitations
This study is subject to a number of limitations. First, the data collection was retrospective in nature, and there was no randomization of patients; instead, treatment decisions were made based on the individual preferences of physicians at our institution. Additionally, the study population of patients with SM is notably diverse, encompassing a range of underlying cancer types and varying pre-treatment histories. Despite these limitations, our findings might provide a basis for the establishment of multicenter registries and the development of further prospective studies.
The present study indicates that the timing of SM diagnosis, whether synchronous or metachronous, does not substantially influence patient survival following surgical treatment. These findings imply that decisions regarding neurosurgical intervention should be considered independently of the temporal classification of SM.
Data availability
The datasets generated during and/or analysed during the current study are available from the corresponding author on reasonable request.
Abbreviations
American Society of Anesthesiologists
American Spinal Injury Association
Charlson Comorbidity Index
Confidence interval
Karnofsky Performance Scale
Spinal metastases
Overall survival
ASIA and ISCoS International Standards Committee (2019) The 2019 revision of the International Standards for Neurological Classification of Spinal Cord Injury (ISNCSCI)—What’s new? Spinal Cord 57(10):815–817. https://doi.org/10.1038/s41393-019-0350-9
Article Google Scholar
Bach F, Larsen BH, Rohde K, Borgesen SE, Gjerris F, Boge-Rasmussen T, Agerlin N, Rasmusson B, Stjernholm P, Sorensen PS (1990) Metastatic spinal cord compression. Occurrence, symptoms, clinical presentations and prognosis in 398 patients with spinal cord compression. Acta Neurochir 107(1–2):37–43. https://doi.org/10.1007/BF01402610
Article CAS PubMed Google Scholar
Berger AC (2008) Introduction: role of surgery in the diagnosis and management of metastatic cancer. Semin Oncol 35(2):98–99. https://doi.org/10.1053/j.seminoncol.2008.01.002
Article PubMed Google Scholar
Berghoff AS, Schur S, Fureder LM, Gatterbauer B, Dieckmann K, Widhalm G, Hainfellner J, Zielinski CC, Birner P, Bartsch R, Preusser M (2016) Descriptive statistical analysis of a real life cohort of 2419 patients with brain metastases of solid cancers. ESMO Open 1(2):e000024. https://doi.org/10.1136/esmoopen-2015-000024
Article PubMed PubMed Central Google Scholar
Bollen L, Dijkstra SPD, Bartels R, de Graeff A, Poelma DLH, Brouwer T, Algra PR, Kuijlen JMA, Minnema MC, Nijboer C, Rolf C, Sluis T, Terheggen M, van der Togt-van Leeuwen ACM, van der Linden YM, Taal W (2018) Clinical management of spinal metastases-The Dutch national guideline. Eur J Cancer 104:81–90. https://doi.org/10.1016/j.ejca.2018.08.028
Choi D, Pavlou M, Omar R, Arts M, Balabaud L, Buchowski JM, Bunger C, Chung CK, Coppes MH, Depreitere B, Fehlings MG, Kawahara N, Lee CS, Leung Y, Martin-Benlloch JA, Massicotte EM, Mazel C, Meyer B, Oner FC, Peul W, Quraishi N, Tokuhashi Y, Tomita K, Ulbricht C, Verlaan JJ, Wang M, Crockard HA (2019) A novel risk calculator to predict outcome after surgery for symptomatic spinal metastases; use of a large prospective patient database to personalise surgical management. Eur J Cancer 107:28–36. https://doi.org/10.1016/j.ejca.2018.11.011
Choi D, Fox Z, Albert T, Arts M, Balabaud L, Bunger C, Buchowski JM, Coppes MH, Depreitere B, Fehlings MG, Harrop J, Kawahara N, Martin-Benlloch JA, Massicotte EM, Mazel C, Oner FC, Peul W, Quraishi N, Tokuhashi Y, Tomita K, Verlaan JJ, Wang M, Crockard HA (2015) Prediction of quality of life and survival after surgery for symptomatic spinal metastases: a multicenter cohort study to determine suitability for surgical treatment. Neurosurgery 77(5):698–708; discussion 708. doi: https://doi.org/10.1227/NEU.0000000000000907
Coleman RE (2006) Clinical features of metastatic bone disease and risk of skeletal morbidity. Clin Cancer Res 12(20 Pt 2):6243s–6249s. https://doi.org/10.1158/1078-0432.CCR-06-0931
Comey CH, McLaughlin MR, Moossy J (1997) Anterior thoracic corpectomy without sternotomy: a strategy for malignant disease of the upper thoracic spine. Acta Neurochir 139(8):712–718. https://doi.org/10.1007/BF01420043
Depreitere B, Ricciardi F, Arts M, Balabaud L, Bunger C, Buchowski JM, Chung CK, Coppes MH, Fehlings MG, Kawahara N, Martin-Benlloch JA, Massicotte EM, Mazel C, Meyer B, Oner FC, Peul W, Quraishi N, Tokuhashi Y, Tomita K, Verlaan JJ, Wang M, Crockard HA, Choi D (2020) How good are the outcomes of instrumented debulking operations for symptomatic spinal metastases and how long do they stand? A subgroup analysis in the global spine tumor study group database. Acta Neurochir 162(4):943–950. https://doi.org/10.1007/s00701-019-04197-5
Fehlings MG, Nater A, Tetreault L, Kopjar B, Arnold P, Dekutoski M, Finkelstein J, Fisher C, France J, Gokaslan Z, Massicotte E, Rhines L, Rose P, Sahgal A, Schuster J, Vaccaro A (2016) Survival and clinical outcomes in surgically treated patients with metastatic epidural spinal cord compression: results of the prospective multicenter AOSpine study. J Clin Oncol 34(3):268–276. https://doi.org/10.1200/JCO.2015.61.9338
Furlan JC, Wilson JR, Massicotte EM, Sahgal A, Fehlings MG (2022) Recent advances and new discoveries in the pipeline of the treatment of primary spinal tumors and spinal metastases: a scoping review of registered clinical studies from 2000 to 2020. Neuro Oncol 24(1):1–13. https://doi.org/10.1093/neuonc/noab214
Georgy BA (2010) Vertebroplasty technique in metastatic disease. Neuroimaging Clin N Am 20(2):169–177. https://doi.org/10.1016/j.nic.2010.02.003
Gerszten PC, Mendel E, Yamada Y (2009) Radiotherapy and radiosurgery for metastatic spine disease: What are the options, indications, and outcomes? Spine 34(22 Suppl):S78–S92. https://doi.org/10.1097/BRS.0b013e3181b8b6f5
Gezercan Y, Cavus G, Okten AI, Menekse G, Cikili M, Adamhasan F, Arslan A, Acik V (2016) Single-stage posterolateral transpedicular approach with 360-degree stabilization and vertebrectomy in primary and metastatic tumors of the spine. World Neurosurg 95:214–221. https://doi.org/10.1016/j.wneu.2016.08.007
Gilbert RW, Kim JH, Posner JB (1978) Epidural spinal cord compression from metastatic tumor: diagnosis and treatment. Ann Neurol 3(1):40–51. https://doi.org/10.1002/ana.410030107
Goldsmith SM (2014) A unifying approach to the clinical diagnosis of melanoma including “D” for “Dark” in the ABCDE criteria. Dermatol Pract Concept 4(4):75–78. https://doi.org/10.5826/dpc.0404a16
Goncalves PH, Peterson SL, Vigneau FD, Shore RD, Quarshie WO, Islam K, Schwartz AG, Wozniak AJ, Gadgeel SM (2016) Risk of brain metastases in patients with nonmetastatic lung cancer: analysis of the Metropolitan Detroit Surveillance, Epidemiology, and End Results (SEER) data. Cancer 122(12):1921–1927. https://doi.org/10.1002/cncr.30000
Greenlee RT, Murray T, Bolden S (2000) Wingo PA (2000) Cancer statistics. CA Cancer J Clin 50(1):7–33. https://doi.org/10.3322/canjclin.50.1.7
Hamed M, Potthoff AL, Layer JP, Koch D, Borger V, Heimann M, Scafa D, Sarria GR, Holz JA, Schmeel FC, Radbruch A, Guresir E, Schafer N, Schuss P, Garbe S, Giordano FA, Herrlinger U, Vatter H, Schmeel LC, Schneider M (2022a) Benchmarking safety indicators of surgical treatment of brain metastases combined with intraoperative radiotherapy: results of prospective observational study with comparative matched-pair analysis. Cancers 14(6):1515. https://doi.org/10.3390/cancers14061515
Hamed M, Brandecker S, Rana S, Potthoff AL, Eichhorn L, Bode C, Schmeel FC, Radbruch A, Schafer N, Herrlinger U, Koksal M, Giordano FA, Vatter H, Schneider M, Banat M (2022b) Postoperative prolonged mechanical ventilation correlates to poor survival in patients with surgically treated spinal metastasis. Front Oncol 12:940790. https://doi.org/10.3389/fonc.2022.940790
Hamed M, Potthoff AL, Heimann M, Schafer N, Borger V, Radbruch A, Herrlinger U, Vatter H, Schneider M (2023) Survival in patients with surgically treated brain metastases: does infratentorial location matter? Neurosurg Rev 46(1):80. https://doi.org/10.1007/s10143-023-01986-6
Hong S, Youk T, Lee SJ, Kim KM, Vajdic CM (2020) Bone metastasis and skeletal-related events in patients with solid cancer: a Korean nationwide health insurance database study. PLoS ONE 15(7):e0234927. https://doi.org/10.1371/journal.pone.0234927
Article CAS PubMed PubMed Central Google Scholar
Hosono N, Ueda T, Tamura D, Aoki Y, Yoshikawa H (2005) Prognostic relevance of clinical symptoms in patients with spinal metastases. Clin Orthop Relat Res 436:196–201. https://doi.org/10.1097/01.blo.0000160003.70673.2a
Ilic I, Faron A, Heimann M, Potthoff AL, Schafer N, Bode C, Borger V, Eichhorn L, Giordano FA, Guresir E, Jacobs AH, Ko YD, Landsberg J, Lehmann F, Radbruch A, Herrlinger U, Vatter H, Schuss P, Schneider M (2021) Combined assessment of preoperative frailty and sarcopenia allows the prediction of overall survival in patients with lung cancer (NSCLC) and surgically treated brain metastasis. Cancers 13(13):3353. https://doi.org/10.3390/cancers13133353
Jacobs WB, Perrin RG (2001) Evaluation and treatment of spinal metastases: an overview. Neurosurg Focus 11(6):e10. https://doi.org/10.3171/foc.2001.11.6.11
Jenis LG, Dunn EJ, An HS (1999) Metastatic disease of the cervical spine. A review. Clin Orthop Relat Res 359:89–103. https://doi.org/10.1097/00003086-199902000-00010
Krober MW, Guhring T, Unglaub F, Bernd L, Sabo D (2004) Outcome between surgical and non-surgical treatment of metastatic tumors of the spine: a retrospective study of 259 patients. Z Orthop Ihre Grenzgeb 142(4):442–448. https://doi.org/10.1055/s-2004-822796
Kumar N, Tan WLB, Wei W, Vellayappan BA (2020) An overview of the tumors affecting the spine-inside to out. Neurooncol Pract 7(Suppl 1):i10–i17. https://doi.org/10.1093/nop/npaa049
Lehmann F, Schenk LM, Ilic I, Putensen C, Hadjiathanasiou A, Borger V, Zimmermann J, Guresir E, Vatter H, Bode C, Schneider M, Schuss P (2021) Prolonged mechanical ventilation in patients with deep-seated intracerebral hemorrhage: risk factors and clinical implications. J Clin Med 10(5):1015. https://doi.org/10.3390/jcm10051015
Lehmann F, Potthoff AL, Borger V, Heimann M, Ehrentraut SF, Schaub C, Putensen C, Weller J, Bode C, Vatter H, Herrlinger U, Schuss P, Schafer N, Schneider M (2023) Unplanned intensive care unit readmission after surgical treatment in patients with newly diagnosed glioblastoma—forfeiture of surgically achieved advantages? Neurosurg Rev 46(1):30. https://doi.org/10.1007/s10143-022-01938-6
Lux MP, Emons J, Bani MR, Wunderle M, Sell C, Preuss C, Rauh C, Jud SM, Heindl F, Langemann H, Geyer T, Brandl AL, Hack CC, Adler W, Schulz-Wendtland R, Beckmann MW, Fasching PA, Gass P (2019) Diagnostic accuracy of breast medical tactile examiners (MTEs): a prospective pilot study. Breast Care 14(1):41–47. https://doi.org/10.1159/000495883
Maccauro G, Spinelli MS, Mauro S, Perisano C, Graci C, Rosa MA (2011) Physiopathology of spine metastasis. Int J Surg Oncol 2011:107969. https://doi.org/10.1155/2011/107969
Macedo F, Ladeira K, Pinho F, Saraiva N, Bonito N, Pinto L, Goncalves F (2017) Bone metastases: an overview. Oncol Rev 11(1):321. https://doi.org/10.4081/oncol.2017.321
Miscusi M, Polli FM, Forcato S, Ricciardi L, Frati A, Cimatti M, De Martino L, Ramieri A, Raco A (2015) Comparison of minimally invasive surgery with standard open surgery for vertebral thoracic metastases causing acute myelopathy in patients with short- or mid-term life expectancy: surgical technique and early clinical results. J Neurosurg Spine 22(5):518–525. https://doi.org/10.3171/2014.10.SPINE131201
Nayak L, Lee EQ, Wen PY (2012) Epidemiology of brain metastases. Curr Oncol Rep 14(1):48–54. https://doi.org/10.1007/s11912-011-0203-y
Park SJ, Lee KH, Lee CS, Jung JY, Park JH, Kim GL, Kim KT (2019a) Instrumented surgical treatment for metastatic spinal tumors: is fusion necessary? J Neurosurg Spine 32(3):456–464. https://doi.org/10.3171/2019.8.SPINE19583
Park JS, Park SJ, Lee CS (2019b) Incidence and prognosis of patients with spinal metastasis as the initial manifestation of malignancy: analysis of 338 patients undergoing surgical treatment. The Bone & Joint Journal 101-B(11):1379–1384. https://doi.org/10.1302/0301-620X.101B11.BJJ-2018-1600.R2
Patchell RA, Tibbs PA, Regine WF, Payne R, Saris S, Kryscio RJ, Mohiuddin M, Young B (2005) Direct decompressive surgical resection in the treatment of spinal cord compression caused by metastatic cancer: a randomised trial. Lancet 366(9486):643–648. https://doi.org/10.1016/S0140-6736(05)66954-1
Patnaik S, Turner J, Inaparthy P, Kieffer WK (2020) Metastatic spinal cord compression. Br J Hosp Med 81(4):1–10. https://doi.org/10.12968/hmed.2019.0399
Potthoff AL, Heimann M, Lehmann F, Ilic I, Paech D, Borger V, Radbruch A, Schafer N, Schuss P, Vatter H, Herrlinger U, Schneider M (2023) Survival after resection of brain metastasis: impact of synchronous versus metachronous metastatic disease. J Neurooncol 161(3):539–545. https://doi.org/10.1007/s11060-023-04242-5
Ringel F, Ryang YM, Kirschke JS, Muller BS, Wilkens JJ, Brodard J, Combs SE, Meyer B (2017) Radiolucent carbon fiber-reinforced pedicle screws for treatment of spinal tumors: advantages for radiation planning and follow-up imaging. World Neurosurg 105:294–301. https://doi.org/10.1016/j.wneu.2017.04.091
Rizzoli R, Body JJ, Brandi ML, Cannata-Andia J, Chappard D, El Maghraoui A, Gluer CC, Kendler D, Napoli N, Papaioannou A, Pierroz DD, Rahme M, Van Poznak CH, de Villiers TJ, El Hajj FG, International Osteoporosis Foundation Committee of Scientific Advisors Working Group on Cancer-Induced Bone D (2013) Cancer-associated bone disease. Osteoporos Int 24(12):2929–2953. https://doi.org/10.1007/s00198-013-2530-3
Schafer N, Bumes E, Eberle F, Fox V, Gessler F, Giordano FA, Konczalla J, Onken J, Ottenhausen M, Scherer M, Schneider M, Vatter H, Herrlinger U, Schuss P (2021) Implementation, relevance, and virtual adaptation of neuro-oncological tumor boards during the COVID-19 pandemic: a nationwide provider survey. J Neurooncol 153(3):479–485. https://doi.org/10.1007/s11060-021-03784-w
Schiff D, O’Neill BP, Wang CH, O’Fallon JR (1998) Neuroimaging and treatment implications of patients with multiple epidural spinal metastases. Cancer 83(8):1593–1601
Schneider M, Heimann M, Schaub C, Eichhorn L, Potthoff AL, Giordano FA, Guresir E, Ko YD, Landsberg J, Lehmann F, Radbruch A, Schwab KS, Weinhold L, Weller J, Wispel C, Herrlinger U, Vatter H, Schafer N, Schuss P (2020) Comorbidity burden and presence of multiple intracranial lesions are associated with adverse events after surgical treatment of patients with brain metastases. Cancers 12(11):3209. https://doi.org/10.3390/cancers12113209
Schuss P, Schafer N, Bode C, Borger V, Eichhorn L, Giordano FA, Guresir E, Heimann M, Ko YD, Landsberg J, Lehmann F, Potthoff AL, Radbruch A, Schaub C, Schwab KS, Weller J, Vatter H, Herrlinger U, Schneider M (2021) the impact of prolonged mechanical ventilation on overall survival in patients with surgically treated brain metastases. Front Oncol 11:658949. https://doi.org/10.3389/fonc.2021.658949
Schweppe JA, Potthoff AL, Heimann M, Ehrentraut SF, Borger V, Lehmann F, Schaub C, Bode C, Putensen C, Herrlinger U, Vatter H, Schafer N, Schuss P, Schneider M (2023) Incurring detriments of unplanned readmission to the intensive care unit following surgery for brain metastasis. Neurosurg Rev 46(1):155. https://doi.org/10.1007/s10143-023-02066-5
Sciubba DM, Gokaslan ZL (2006) Diagnosis and management of metastatic spine disease. Surg Oncol 15(3):141–151. https://doi.org/10.1016/j.suronc.2006.11.002
Stangenberg M, Viezens L, Eicker SO, Mohme M, Mende KC, Dreimann M (2017) Cervical vertebroplasty for osteolytic metastases as a minimally invasive therapeutic option in oncological surgery: outcome in 14 cases. Neurosurg Focus 43(2):E3. https://doi.org/10.3171/2017.5.FOCUS17175
Ulmar B, Catalkaya S, Naumann U, Gerstner S, Cakir B, Schmidt R, Reichel H, Huch K (2006) Surgical treatment and evaluation of prognostic factors in spinal metastases of renal cell carcinoma. Z Orthop Ihre Grenzgeb 144(1):58–67. https://doi.org/10.1055/s-2006-921465
Ulmar B, Huch K, Kocak T, Catalkaya S, Naumann U, Gerstner S, Reichel H (2007) The prognostic influence of primary tumour and region of the affected spinal segment in 217 surgical patients with spinal metastases of different entities. Z Orthop Ihre Grenzgeb 145(1):31–38. https://doi.org/10.1055/s-2007-960506
Van den Brande R, Cornips EM, Peeters M, Ost P, Billiet C, Van de Kelft E (2022) Epidemiology of spinal metastases, metastatic epidural spinal cord compression and pathologic vertebral compression fractures in patients with solid tumors: a systematic review. J Bone Oncol 35:100446. https://doi.org/10.1016/j.jbo.2022.100446
van der Sande JJ, Kroger R, Boogerd W (1990) Multiple spinal epidural metastases; an unexpectedly frequent finding. J Neurol Neurosurg Psychiatry 53(11):1001–1003. https://doi.org/10.1136/jnnp.53.11.1001
Vinas F, Ben Hassen I, Jabot L, Monnet I, Chouaid C (2016) Delays for diagnosis and treatment of lung cancers: a systematic review. Clin Respir J 10(3):267–271. https://doi.org/10.1111/crj.12217
Wang BX, Ou W, Mao XY, Liu Z, Wu HQ, Wang SY (2017) Impacts of EGFR mutation and EGFR-TKIs on incidence of brain metastases in advanced non-squamous NSCLC. Clin Neurol Neurosurg 160:96–100. https://doi.org/10.1016/j.clineuro.2017.06.022
Zhang HR, Qiao RQ, Yang XG, Hu YC (2020) A multicenter, descriptive epidemiologic survey of the clinical features of spinal metastatic disease in China. Neurol Res 42(9):749–759. https://doi.org/10.1080/01616412.2020.1773630
Download references
Open Access funding enabled and organized by Projekt DEAL. The authors declare that no funds, grants, or other support was received during the preparation of this manuscript.
Author information
Authors and affiliations.
Department of Neurosurgery, University Hospital Bonn, Venusberg-Campus 1, Building 81, 53127, Bonn, Germany
Mohammed Banat, Anna-Laura Potthoff, Motaz Hamed, Valeri Borger, Jasmin E. Scorzin, Tim Lampmann, Harun Asoglu, Logman Khalafov, Hartmut Vatter & Matthias Schneider
Department of Neuroradiology, University Hospital Bonn, Bonn, Germany
Frederic C. Schmeel, Daniel Paech & Alexander Radbruch
Department of Neurology, University Hospital Bonn, 53127, Bonn, Germany
Louisa Nitsch & Johannes Weller
Division of Clinical Neuro-Oncology, Department of Neurology, University Hospital Bonn, Bonn, Germany
Ulrich Herrlinger
Institute of Pathology, University Hospital Bonn, Bonn, Germany
Marieta Toma
Institute for Neuropathology, University Hospital Bonn, Bonn, Germany
Gerrit H. Gielen
You can also search for this author in PubMed Google Scholar
Contributions
This manuscript has not been published or presented elsewhere in part or in entirety and is not under consideration by another journal. The study design was approved by the appropriate ethics review board. We have read and understood your journal’s policies, and we believe that neither the manuscript nor the study violates any of these. All authors contributed to the study conception and design. Material preparation, data collection and analysis were performed by MB, and MS. The first draft of the manuscript was written by MB and all authors commented on previous versions of the manuscript. All authors read and approved the final manuscript.
Corresponding author
Correspondence to Mohammed Banat .
Ethics declarations
Competing interests.
The authors declare no competing interests.
Consent to participate
Informed consent was not sought as a retrospective study design was used.
Consent to publish
All authors agreed to the publication of the manuscript.
Ethics approval
The local ethics committee at the University of Bonn (protocol no. 067/21) approved the present study.
Additional information
Publisher's note.
Springer Nature remains neutral with regard to jurisdictional claims in published maps and institutional affiliations.
Rights and permissions
Open Access This article is licensed under a Creative Commons Attribution 4.0 International License, which permits use, sharing, adaptation, distribution and reproduction in any medium or format, as long as you give appropriate credit to the original author(s) and the source, provide a link to the Creative Commons licence, and indicate if changes were made. The images or other third party material in this article are included in the article's Creative Commons licence, unless indicated otherwise in a credit line to the material. If material is not included in the article's Creative Commons licence and your intended use is not permitted by statutory regulation or exceeds the permitted use, you will need to obtain permission directly from the copyright holder. To view a copy of this licence, visit http://creativecommons.org/licenses/by/4.0/ .
Reprints and permissions
About this article
Banat, M., Potthoff, AL., Hamed, M. et al. Synchronous versus metachronous spinal metastasis: a comparative study of survival outcomes following neurosurgical treatment. J Cancer Res Clin Oncol 150 , 136 (2024). https://doi.org/10.1007/s00432-024-05657-x
Download citation
Received : 21 January 2024
Accepted : 19 February 2024
Published : 19 March 2024
DOI : https://doi.org/10.1007/s00432-024-05657-x
Share this article
Anyone you share the following link with will be able to read this content:
Sorry, a shareable link is not currently available for this article.
Provided by the Springer Nature SharedIt content-sharing initiative
- Surgery for spinal metastasis
- Synchronous versus metachronous tumor occurrence
- Neuro-oncology
- Find a journal
- Publish with us
- Track your research
IMAGES
VIDEO
COMMENTS
Comparative research is more of a perspective or orientation than a separate research technique (Ragin & Rubinson, 2009) . A comparative study is a kind of method that analyzes phenomena and then ...
The goal of comparative research is drawing a solution out of the similarities and differences between the focused variables. Through non-experimental or qualitative research, you can include this type of research method in your comparative research design. 13+ Comparative Research Examples. Know more about comparative research by going over ...
Chapter 10 of this book provides an overview of the methods for comparative studies in pharmacology, including the design, analysis, and interpretation of experiments and clinical trials. It also discusses the advantages and limitations of different types of comparisons, such as placebo, active, and dose comparisons. This chapter is a useful resource for researchers and students who want to ...
Of these 95 comparative studies, 65 were studies of NSF-supported curricula, 27 were studies of commercially generated materials, and 3 included two curricula each from one of these two categories. To avoid the problem of double coding, two studies, White et al. (1995) and Zahrt (2001), were coded within studies of NSF-supported curricula ...
Comparative research is a research methodology in the social sciences exemplified in cross-cultural or comparative studies that aims to make comparisons across different countries or cultures.A major problem in comparative research is that the data sets in different countries may define categories differently (for example by using different definitions of poverty) or may not use the same ...
Comparative research in communication and media studies is conventionally understood as the contrast among different macro-level units, such as world regions, countries, sub-national regions, social milieus, language areas and cultural thickenings, at one point or more points in time.
What makes a study comparative is not the particular techniques employed but the theoretical orientation and the sources of data. All the tools of the social scientist, including historical analysis, fieldwork, surveys, and aggregate data analysis, can be used to achieve the goals of comparative research. So, there is plenty of room for the ...
Comparative method is a process of analysing differences and/or similarities betwee two or more objects and/or subjects. Comparative studies are based on research techniques and strategies for drawing inferences about causation and/or association of factors that are similar or different between two or more subjects/objects.
In the past, comparativists have oftentimes regarded case study research as an alternative to comparative studies proper. At the risk of oversimplification: methodological choices in comparative and international education (CIE) research, from the 1960s onwards, have fallen primarily on either single country (small n) contextualized comparison, or on cross-national (usually large n, variable ...
This course provides an introduction and overview of systematic comparative analyses in the social sciences and shows how to employ this method for constructive explanation and theory building. It begins with comparisons of very few cases and specific "most similar" and "most different" research designs.
Comparative communication research is a combination of substance (specific objects of investigation studied in diferent macro-level contexts) and method (identification of diferences and similarities following established rules and using equivalent concepts).
2.2 Comparative Research and case selection 2.3 The Use of Comparative analysis in political science: relating politics, polity ... (Lijphart, 1971: 692). Examples of such studies can - for instance - be found in the analysis of consolidation of democracy (Stepan, 2001). This type of case analyses can be performed qualitatively or ...
Comparative research is a valuable approach to understand and address various issues and challenges in rural development. This pdf document offers a comprehensive review of the concepts, methods, institutions and publications related to comparative research, with examples and references for further exploration.
This paper reports on two studies that used qualitative thematic and quantitative linguistic analysis, respectively, to assess the content and language of the largest ever sample of graded ...
Comparative analysis is a method that is widely used in social science. It is a method of comparing two or more items with an idea of uncovering and discovering new ideas about them. It often compares and contrasts social structures and processes around the world to grasp general patterns. Comparative analysis tries to understand the study and ...
researcher. Throughout the book we develop for the applied research worker a basic understanding of the problems and techniques and avoid highly math- ematical presentations in the main body of the text. Overview of the Book The first five chapters discuss the main conceptual issues in the design and analysis of comparative studies.
STAAR state-mandated exam, from 2015-2018. In response to studies illuminating the achievement gap, educational leaders in Texas implemented block scheduling in order to improve student outcomes among high school students. However, to date, published research studies yield mixed results of the effectiveness block scheduling has made on
A comparative design involves studying variation by comparing a limited number of cases without using statistical probability analyses. Such designs are particularly useful for knowledge development when we lack the conditions for control through variable-centred, quasi-experimentaldesigns. Comparative designs often combine different research ...
Abstract and Figures. (from the chapter) provide a comprehensive overview of the methodological issues encountered in cross-cultural [psychological] research / focus on data sets that are ...
Comparative effectiveness research (CER) guidelines have been developed to direct the field toward the most rigorous study methodologies. A challenge, however, is how to ensure the best evidence is generated, and how to translate methodologically complex or nuanced CER findings into usable medical evidence. To reach that goal, it is important ...
Framework. The decision-making framework takes the form of a decision tree (Fig. 1) to determine when a comparative effectiveness study can be justified and is particularly relevant to the provision of services that do not have a tight regulatory framework governing when an intervention can be used as part of usual care.This framework is headed by Level 1 questions (demarcated by a question ...
In a causal-comparative research design, the researcher compares two groups to find out whether the independent variable affected the outcome or the dependent variable. A causal-comparative method determines whether one variable has a direct influence on the other and why. It identifies the causes of certain occurrences (or non-occurrences).
These kinds of research question assist you in learning more about the type of relationship between two study variables. Because they aim to distinctly define the connection between two variables, relationship-based research questions are also known as correlational research questions. Examples of Comparative Research Questions
A Comparative Approach The decision to compare human brain structures with nonhuman primates, including chimpanzees, gorillas, macaques, and marmosets, was deliberate. This comparative analysis ...
When evaluating the effectiveness of a drug, a Randomized Controlled Trial (RCT) is often considered the gold standard due to its perfect randomization. While RCT assures strong internal validity, its restricted external validity poses challenges in extending treatment effects to the broader real-world population due to possible heterogeneity in covariates. In this study, we employed the ...
The results revealed similar OD values across the sample range (0 ... A comparative study of Absorbance 96 Automate and Eppendorf epMotion® in cell-based research. News-Medical, viewed 18 March ...
Methods: A comparative policy analysis was conducted, focusing on the DHSs of Tanzania and Germany as case studies, selected for their contrasting health care systems and cooperative history. The analysis involved a three-step process: (1) assessing consistency with the GSDH, (2) comparing similarities and differences, and (3) evaluating the ...
Coffee is becoming more and more popular due to the influence of a series of factors, such as economic level, cultural life, social activities, and so on. Therefore, the coffee industry is becoming more competitive in China. In order to get more market share, the coffee company uses different marketing strategies. Among those strategies, co-branding has become a very popular marketing strategy ...
The study design was approved by the appropriate ethics review board. We have read and understood your journal's policies, and we believe that neither the manuscript nor the study violates any of these. All authors contributed to the study conception and design. Material preparation, data collection and analysis were performed by MB, and MS.
The microbiota's alteration is an adaptive mechanism observed in wild animals facing high selection pressure, especially in captive environments. The objective of this study is to compare and predict the potential impact of habitat on the fecal bacterial community of Saltator similis, a songbird species that is a victim of illegal trafficking, living in two distinct habitats: wild and captivity.