Gantt Chart for a Research Project Proposal: Step-by-step guide

In project management, there are few tools as effective and illuminating as the Gantt chart . This simple yet powerful visual tool is invaluable for anyone overseeing a complex task, including research project proposals. It is particularly beneficial in the early stages of a project, where meticulous planning is required to ensure that all elements of the project are understood, accounted for, and scheduled appropriately. Therefore, whether you're an academic researcher, a project manager in a corporate setting, or even a student planning your thesis, understanding how to create and use a Gantt chart can be a significant asset.

What is a Gantt Chart and what is it used for?
A Gantt chart, named after its creator, Henry Gantt, an American mechanical engineer and management consultant, is a type of bar chart that visually represents a project schedule. It was first developed in the early 20th century and has since become a staple in project management across various fields and industries. Today, it's used by project managers in sectors like construction, software development, research and development, and more.
At its core, a Gantt chart consists of two main components: tasks and time. The tasks related to the project are listed on the vertical axis, while the horizontal axis represents time. Each task is represented by a horizontal bar, the length of which corresponds to the duration of the task.
Make your own Gantt chart in Gleek .
Gantt charts are incredibly useful for planning and scheduling projects, tracking progress, and managing dependencies between tasks. They provide a clear visualization of the project timeline and help to identify potential bottlenecks and overlaps. This makes them an ideal tool for coordinating teams, allocating resources, and keeping stakeholders informed.
The versatility of Gantt charts solves numerous problems faced by project managers. They simplify complex projects by breaking them down into manageable tasks and visualizing their sequence and duration. This can help in avoiding over-scheduling, underestimating deadlines, and mismanaging resources.
Whether you're a seasoned project manager or a student working on a research proposal, mastering the use of Gantt charts can significantly streamline your project planning process and enhance your team's productivity.
Components needed for Research project proposal diagram
Creating an effective research project proposal diagram requires several key components. These elements provide a comprehensive overview of the project, including its timeline, tasks, and significant milestones.
Project Stages: Each stage of your research project should be clearly defined. This can include the literature review, methodology development, data collection and analysis, results compilation, proposal drafting, peer review, and final edits.
Timeline: The timeline provides a visual representation of the project's duration. It should outline the start and end dates of the project, as well as the estimated completion time for each stage.
Tasks: Each task within the project stages should be clearly outlined. This includes what needs to be done, who is responsible for it, and when it should be completed.
Milestones: Milestones mark significant achievements or phases in your project. These can help track progress and ensure that the project is moving forward as planned.
Dependencies: Dependencies show the relationship between different tasks. It's crucial to highlight how the delay in one task can impact others.
Status: The status of each task and stage helps monitor the project's progress. It can indicate whether a stage is completed, in progress, or yet to start.
Notes/Comments: Any additional information, observations, or feedback about the project can be included here. This could be insights gained during the research, changes made to the project plan, or issues that have arisen.
By incorporating these components into your diagram, you can create a well-structured, transparent, and efficient project proposal.
Creating a Research project proposal Gantt chart using the Gleek App
Step 1: launching gleek and selecting 'new diagram'.
First, launch Gleek.io in your web browser. Once you're in, select 'New Diagram' from the options available. In the diagram type, choose 'Gantt'.

Step 2: Defining Research Goals
The research project initiates with an active phase dedicated to defining research goals, which commenced on December 15, 2023, lasting for a week. This phase involves brainstorming, outlining objectives, and establishing the research's overarching scope.

Step 3: Literature Review Phase
Transitioning to the next stage, we have the completed 'Literature Review' phase spanning two weeks. This phase entails an in-depth analysis, sourcing relevant publications, synthesizing existing knowledge, and aligning it with the predefined research goals.

Step 4: Methodology Design Phase
Progressing to the 'Methodology Design' phase, currently active for three weeks, this stage intricately structures the research approach. It involves designing methodologies, frameworks, and strategies based on insights gleaned from the literature review, ensuring a robust research plan.

Step 5: Data Collection Phase
Following the planning stages is the critical 'Data Collection' phase, slated for four weeks. This phase involves meticulously gathering and assembling primary data, employing various methodologies such as surveys, experiments, or interviews, aligning with the established research framework.

Step 6: Data Analysis Phase
Post-data collection, the active 'Data Analysis' phase spans three weeks. This phase engages in thorough data examination, statistical analysis, and deriving insights from the accumulated information. It involves identifying patterns, correlations, or trends relevant to the research objectives.

Step 7: Results Compilation Phase
Subsequently, the 'Results Compilation' phase consolidates and organizes the analyzed data over two weeks, presenting it in a coherent format. This phase involves preparing comprehensive reports, graphs, or summaries, showcasing the findings derived from the data analysis stage.

Step 8: Drafting Proposal Phase
Advancing further, the active 'Drafting Proposal' phase, extending over three weeks, involves crafting the research proposal. It includes outlining the research problem, detailing methodologies, and structuring a cohesive proposal aligned with the project's objectives.

Step 9: Peer Review Phase
Upon completion of the draft, the two-week 'Peer Review' phase gathers insights and constructive feedback from peers or subject experts. It involves peer evaluations, discussions, and recommendations aimed at refining and enhancing the proposal's quality.

Step 10: Final Edits
Finally, the one-week active 'Final Edits' phase focuses on meticulous revisions, addressing feedback, and ensuring the proposal's completeness, accuracy, and compliance with set standards. This stage includes proofreading, formatting, and polishing the final document.

Step 11: Proposal Submission Milestone
The 'Proposal Submission' milestone, set for May 15, 2024, marks the conclusive stage, signifying the submission of the crafted and refined research proposal for evaluation and potential implementation.

Hurray, You Did It!
And there you have it! Your Research Project Proposal Gantt Chart is now complete.

This comprehensive diagram, with its clearly defined stages, tasks, timeline, dependencies, resources, and status, provides a holistic view of your research project. It not only serves as a visual representation of the entire project but also acts as a roadmap guiding you from the initial brainstorming phase to the final proposal submission. Utilizing such a diagram can greatly enhance your project planning and execution, ensuring all aspects are considered, dependencies are taken into account, and milestones are tracked. It fosters better coordination, communication, and understanding among team members, leading to more efficient and effective project management.
About Gleek.io
Gleek.io is a powerful tool that can further enrich your project planning needs. It's an intuitive app designed to help you visualize complex ideas, processes, and systems through various types of diagrams. Whether you need to create a flowchart, UML diagram, or even a Gantt chart like the one we've just built, Gleek.io makes the process straightforward and hassle-free.
With its keyboard-centric approach, Gleek.io allows you to create diagrams faster than traditional drag-and-drop tools. You can quickly jot down your ideas and see them evolve into structured diagrams in real-time, making it an ideal tool for brainstorming sessions, project planning, and presentations.
In conclusion, Gleek.io is more than just a diagramming tool. It's a platform that enables you to visualize your thoughts, communicate complex ideas simply, and manage your projects more effectively. Give it a try for your next project and experience the difference it can make!
Related posts
Beyond Traditional Planning: Top Gantt Chart Alternatives in 2024
Gantt chart critical path explained
Pert vs. Gantt Charts: Choosing your project's blueprint
back to all posts
Get started
- Project management
- CRM and Sales
- Work management
- Product development life cycle
- Comparisons
- Construction management
- monday.com updates
How to use a Gantt chart for a research project
Using a Gantt chart for a research project can give all stakeholders a better understanding of timelines and the resources needed for each task. With all project activities neatly laid out within a timeline and every minor detail accounted for, a Gantt chart provides your team with the framework for successful project operations.
In this article, we’ll discuss a Gantt chart and how you can use it in a research project to maximize efficiency and promote greater transparency. We’ll also share how you can use monday.com’s project management Work OS to simplify the management of any research project further.
What is a Gantt chart?
A Gantt chart is a bar chart popularized in the early 1900s by Henry Gantt. It lets you establish a detailed project plan according to when you need each task completed.
If done correctly, a Gantt chart creates a realistic time frame for a project by establishing a start date for the whole project and each task. Then, you can pair these start dates with an estimation of how long the task will take, broken down by days, weeks, or months.
What makes a Gantt chart unique is that it establishes dependency relationships between all relevant tasks, which can help you better understand necessary workflows.
For example, let’s say you’re creating a research proposal. One of your tasks is to promote awareness and garner support for the proposal on social media. However, before you can do that, you need to create informational materials you can distribute and have the proposal outline ready for viewing. Since these necessities are clearly outlined in the Gantt chart, you can plan your project timeline accordingly.
How can you use a Gantt for research projects?
Research projects are vast undertakings that require a lot of your time, effort, and brain power. Sometimes it’s easy to get sidetracked or confused about what comes next in your research or how you should put it together.
A clear understanding of objectives and deadlines can help you organize even the most complex research project undertakings. Even better, a Gantt chart provides clear step-by-step instructions with dependency relationships marked to ensure every team member understands their responsibilities.
A Gantt chart ensures all research project team members clearly understand objectives, deadlines, and task dependency relationships.
Best practices for planning and scheduling a research project
Understanding the best practices for planning and scheduling a research project can help you get the most out of your Gantt chart . A few best practices include:
- Have a clear goal : Before sitting down to plan your research project, ask yourself some crucial questions. What are you trying to achieve? Why are you trying to achieve it? When do you need to complete it?
- Use scheduling tools : Use task and resource scheduling tools when possible to reduce the risk of human error.
- Get the team involved : Gather your team together for a brainstorming session, if possible, when developing a list of tasks required to meet your final objective.
- Consider dependency relationships : Consider the dependency relationships between objectives carefully and be realistic about time frames. Ensuring your team has enough time to successfully and thoroughly complete each task from the beginning sets your research project up for success.
- Identify potential issues : Identify risks and potential roadblocks in your schedule and have a backup plan for each to ensure a steady workflow with minimal pushbacks.
- Consider resource requirements : Consider the resources necessary to complete each task. Remember to include work hours as resources and schedule each team member appropriately to achieve objectives in the desired time frame.
- Plan for reporting : Assign specific times, or interval periods, for progress reports and compare these with your initial estimations. If these reports show alterations are necessary, don’t be afraid to make changes.
- Identify KPIs : Before the research project begins, identify key performance metrics and track them as you go to define your success clearly. You may find using a relevant tool or platform the easiest way to track performance metrics.
Having the right tools can increase efficiency, decrease downtime, and ensure objective deadlines are not only met but exceeded.
Managing research projects on monday.com
monday.com’s robust project management Work OS makes managing research projects easier by:
- Centralizing projects from start to finish : Our Work OS lets you centralize all projects from conception to completion, with customizable dashboards that show you the information you deem most important. Quickly assess risks, bottlenecks, and roadblocks to keep your research project moving forward.
- Streamlining project workflows : Streamline workflows by automating routine tasks and assigning teammates to the work they’re most qualified for. Then, track individual and project-wide progress in real-time with regular task updates. Use color coding to make task management even more straightforward.
- Enabling communication across teams : Our Work OS promotes communication between project members and across different teams, so all stakeholders know where things stand at all times. You can share documents, leave notes, and work together in real-time for more effective communication that allows you to exceed every deadline and meet every objective.
monday.com can provide your team with a Gantt chart view to make project management easier. Get started with monday.com’s powerful Work OS by building a research project workflow from scratch or try a few of our other templates for managing research projects easier.
Related templates
A basic Gantt chart can help you plan your research project in detail. On monday.com, you can add a Gantt View to any type of project board. Below are some of our recommended templates from our Template Center that you can use to fine-tune other essential aspects of your research project.
Keyword power tools template
Our Research Power Tools Template uses a Gantt chart format to help you visualize project timelines, manage project resources, and monitor each phase of your research projects from one platform.
Publication and journals template
Our Publications and Journals Template is an excellent tool for content publishing companies. You can use our template to:
- Manage your publication process: Our template enables whole-process management from submission to approval. Easily track article status and monitor writer workload to ensure you meet publishing deadlines.
- Visualize your publishing pipeline: Customizable dashboards allow you to receive a high-level overview of all current and upcoming articles and where they stand.
- Track individual contributions: Ensure each writer meets minimum contributions and isn’t given too large a workload by tracking individual contributions.
By now, you should have a working idea of Gantt charts and how they increase transparency and efficiency in project management. However, if you still have questions, we’ve answered a few FAQs below.
How do you create a dissertation in a Gantt chart?
To create a Gantt chart for a dissertation, you should first understand your timeline and deliverables. Once you’ve written these down, create detailed task lists of how you’ll accomplish each deliverable and consider dependency relationships between each. Finally, use the Gantt chart to outline your dissertation from start to finish.
What should be in a dissertation timeline?
In a dissertation timeline, you should include the following:
- Role assigning (if applicable)
- Research tasks
- Experiments, social or scientific (if applicable)
- Data collection and analysis
- First draft completion
- Submission to the advisor (first) and dean (at completion)
How do you create a Gantt chart in Word?
You can create a Gantt chart in Microsoft Word by:
- Opening a new Word document
- Change the document orientation from vertical to horizontal
- Insert a bar graph into your document
- Make format alterations as necessary to make the graph look like a Gantt chart
- Insert information and customize as necessary
Any team can increase transparency in their research projects with monday.com
Using a Gantt chart to create a detailed project timeline can help increase transparency and promote greater efficiency in your organization’s research projects.
When you pair a Gantt chart with monday.com’s robust project management system, you have the tools you need to meet deadlines, complete objectives, and exceed expectations.
Send this article to someone who’d like it.
Get your demo today
/Blog%20Post/sharp_close_black_36pt_2x.png "gantt chart research plan")
Creating a Gantt Chart for Your Research Project Proposal

Crafting a successful research proposal demands careful planning. However, managing intricate projects with numerous tasks and deadlines can be challenging.
This is where the Gantt charts come into play. These powerful project management techniques offer a visual roadmap for your research proposal, transforming your intricate plan into a clear and concise document. By incorporating a Gantt chart, you not only streamline the planning process for yourself but also strengthen your proposal by demonstrating a meticulously structured and achievable project.
Let's explore the power of the Gantt chart for crafting robust research proposals and a step-by-step guide on how to create one.
Understanding Gantt Charts and their Application in Research Proposals
Gantt charts , developed by Henry Gantt, an American engineer and project management consultant, are powerful visual tools for project management. They represent project tasks as horizontal bars on a timeline, showing their duration and dependencies. This simple format provides a comprehensive overview of your research proposal development process.
In research proposals, Gantt charts are invaluable because they:
Visualize the Project Lifecycle: Understand the sequential steps involved, from literature review to data analysis and final edits.
Manage Task Dependencies: Identify tasks reliant on others' completion (e.g., data collection after finalizing research methodology).
Optimize Resource Allocation: Allocate essential resources, like software or equipment, to specific tasks within the timeline.
Crafting a Gantt Chart with Rework
Now that you understand the core functionality of Gantt charts, let's explore how to create one specifically for your research proposal. Here, we'll leverage the features of Rework.com , a comprehensive project management platform that streamlines the process.
Rework transcends the limitations of basic Gantt charts, offering functionalities that empower a more streamlined research proposal creation process. Here's how it empowers you:
Seamless Integration: Rework seamlessly integrates task management, workflow design, and progress tracking – all crucial aspects of building a strong research proposal.
Intuitive Interface: No technical expertise is required! Rework's user-friendly interface allows you to create and customize Gantt charts effortlessly.
Real-Time Collaboration: Facilitate effective teamwork and communication among your research team directly within the platform.
Streamlined Workflows: Design clear and concise workflows for each research stage, outlining tasks, deadlines, and responsible team members.
To showcase the power of Rework, let's take a brief look at what a research proposal Gantt chart might look like on the platform.

Each stage would then be broken down into specific tasks, with clear deadlines and assigned team members.
This level of organization and transparency not only strengthens your proposal but also paves the way for a smooth and efficient research journey.
Step-by-Step Guide: Constructing Your Research Proposal Gantt Chart
Having grasped the power of Gantt charts and the functionalities offered by Rework.com, let's embark on the exciting journey of building your research proposal Gantt chart! Here's a step-by-step guide to navigate the process:
1. Define Your Research Goals
This initial step lays the foundation for your entire project. Clearly outline your research topic, objectives, and desired outcomes. Having a well-defined objective will guide you in structuring the subsequent stages.
2. Break Down the Project into Stages
Identify the key stages involved in completing your research, such as literature review, data collection, data analysis, and proposal writing.
3. List Tasks Within Each Stage
Now, delve deeper into each research stage and meticulously list all the specific tasks that need to be completed. For instance, the "literature review" stage might involve tasks like identifying relevant academic databases, searching for articles, and summarizing key findings.
4. Estimate Task Durations
Allocate estimated timeframes for completing each individual task within your research stages. Consider factors like the complexity of the task and the resources available.
5. Identify Task Dependencies
Analyze the sequence of your tasks and pinpoint any dependencies. Remember the data analysis example? It can't begin until the data collection stage is complete. Mapping these dependencies in your Gantt chart ensures a smooth and logical workflow.
6. Utilize Rework's Features
Leverage the user-friendly interface of Rework to effortlessly create your Gantt chart. Input your research stages, tasks, and estimated durations. Rework will translate this information into a clear visual representation of your project timeline.
7. Assign Team Members
If you're working with a team, utilize Rework's functionalities to assign specific tasks to individual team members. This promotes accountability and ensures everyone is on the same page.
8. Track Progress & Make Adjustments
Monitor progress within Rework, identify any potential roadblocks that might arise, and be prepared to adjust your plan as needed. The flexibility of Rework allows you to adapt your Gantt chart to maintain optimal project flow.
By following these steps and utilizing Rework’s capabilities, you'll craft a robust research proposal Gantt chart. This visual roadmap not only streamlines your research journey but also presents a structured plan to potential funders or reviewers, increasing your proposal's success rate.
Advanced Techniques for Optimizing Your Research Proposal Gantt Chart
To elevate your Gantt chart's effectiveness, consider these advanced strategies:
Conditional Formatting: Implement conditional formatting within your Rework Gantt chart. This functionality allows you to utilize color coding to visually distinguish completed tasks from those nearing deadlines or overdue.
Task Annotations: Move beyond simple task listings – enrich them with context for increased clarity and professionalism. Utilize Rework's functionalities to add detailed annotations directly within your Gantt chart for each task. These annotations can incorporate specific instructions, relevant resources, or crucial reminders for team members.
Rework Reporting: Rework extends beyond Gantt chart creation; it empowers you to analyze project progress with robust reporting tools. Generate comprehensive reports that offer valuable insights into task completion rates, resource allocation, and overall project health. By identifying areas needing improvement or potential roadblocks early on, you can proactively adjust your plan and optimize research execution.
Crafting a compelling research proposal is crucial, but it doesn't have to be overwhelming. With Rework's intuitive interface and powerful features, creating a professional Gantt chart tailored to your proposal is straightforward. By leveraging Gantt charts, you'll showcase a well-structured and achievable project, increasing your proposal's impact and securing funding. Ready to streamline your research journey? Start building your Gantt chart with Rework today!
/Blog%20Post/jean-philippe-delberghe-75xPHEQBmvA-unsplash-1.jpg)
Cut costs with Rework. Do more with less.
/Blog%20Post/cta-image.png)
How to write a Research Proposal: Creating a Gantt chart
- Components of a research proposal
- Useful videos
- Common mistakes to avoid
- Sage Research Methods LibGuide This link opens in a new window
- Managing sources
- Request a literature search
- Research proposal - examples
- Creating a Gantt chart
- Free Apps for Research
- Academic writing
What is a Gantt chart
Some University departments require students to create a Gantt chart to represent a schedule for the research project. The Gantt chart shows the timelines of the various steps of the project including their dependencies and any resources needed . In other words, the chart depicts when an event is supposed to take place in your project by providing an outline regarding the order in which the various tasks need to be performed .
An example of a Gantt chart.

Gantt chart on Moodle
How to create a Gantt chart - videos
- << Previous: Research proposal - examples
- Next: Free Apps for Research >>
- Last Updated: Dec 19, 2023 12:35 PM
- URL: https://libguides.unisa.ac.za/research_proposal
A Guide for Using Gantt Chart for Research Project
Are you embarking on a research project and feeling overwhelmed by the complexity of managing your tasks and timelines? Fear not! In this comprehensive guide, we will explore the power of Gantt charts for research projects. From crafting a research proposal to executing your project, Gantt charts can be your best friend. Let's dive into the world of Gantt charts and discover how they can streamline your research journey.
Understanding Gantt Charts for Research Projects
Before we delve into the practical aspects of using Gantt charts for research projects, let's start with the basics. What exactly is a Gantt chart, and how can it benefit your research endeavors?
What is a Gantt Chart?
A Gantt chart is a visual representation of a project schedule that displays tasks, their durations, and the relationships between them. This tool was originally developed by Henry L. Gantt in the 1910s, and it has since become a staple in project management across various fields, including research.
Benefits of Using Gantt Charts for Research Projects
- Clarity and Visualization: Gantt charts provide a clear and visual overview of your research project, making it easier to understand the sequence of tasks and their dependencies.
- Task Organization: You can break down your research into manageable tasks and allocate time for each one, ensuring that you stay on track.
- Timeline Management: Gantt charts help you set realistic deadlines and track your progress, preventing delays and ensuring you complete your project on time.
- Resource Allocation: You can allocate resources such as personnel, equipment, and funding to specific tasks, optimizing your research efficiency.
- Communication: Gantt charts are excellent communication tools. They allow you to share your project timeline with team members, advisors, or stakeholders, fostering transparency and collaboration.
Now that you understand the benefits of using Gantt charts for research projects , let's explore how to implement them effectively.
Creating a Gantt Chart for Your Research Proposal
Before you can dive into your research project, you'll likely need to prepare a research proposal to outline your objectives, methodology, and timeline. This is where a Gantt chart can be incredibly useful.
Step 1: Define Your Research Objectives
Begin by establishing a clear and concise delineation of your research goals and purposes.
What do you aim to achieve, and what are the key milestones? Break down your research into specific tasks or phases, such as literature review, data collection, analysis, and report writing.
Step 2: Identify Task Dependencies
Next, identify the dependencies between tasks. Certain tasks might require completion before others can commence. For instance, you might need to finish data collection before you can start data analysis. These dependencies will help you create a logical sequence for your Gantt chart.
Step 3: Estimate Task Durations
Estimate the duration of each task or phase. Be realistic in your estimates, considering factors like the complexity of the task and the resources available. It's better to overestimate than underestimate, as this will help you avoid unexpected delays.
Step 4: Create Your Gantt Chart
Now, it's time to create your Gantt chart . You can use specialized project management software like Microsoft Project, Excel, or online tools like Slikk.ai, Asana, or even dedicated Gantt chart software. In your Gantt chart, each task is represented as a horizontal bar, and the length of the bar corresponds to the task's duration. Task dependencies are indicated by the order of the bars.
Step 5: Review and Refine
Once you've created your initial Gantt chart, review it carefully. Ensure that it aligns with your research proposal and that the timeline is feasible. Make adjustments as needed.
Step 6: Share Your Proposal and Gantt Chart
Share your research proposal and Gantt chart with your advisor, committee members, or anyone involved in your project. Their feedback can be invaluable in refining your plan and ensuring its feasibility.
With your research proposal and Gantt chart in hand, you're ready to embark on your research project. But the journey doesn't end here; Gantt charts are equally essential for project execution and management.
Managing Your Research Project with Gantt Charts
As you transition from the proposal stage to the actual execution of your research project, your Gantt chart becomes a dynamic tool to keep you on track. Here's how to effectively manage your research project using Gantt charts:
Task Allocation
Assign specific tasks to yourself and your team members if applicable. Each person's responsibilities should be clearly defined in the Gantt chart. This ensures accountability and prevents confusion.
Timeline Monitoring
Regularly update your Gantt chart to reflect the progress of your project. As tasks are completed, mark them as such and adjust the timeline if necessary. If any delays occur, identify the reasons and take corrective action.
Resource Management
Keep an eye on resource allocation. Are you running low on a particular resource? Do you need to reallocate resources to meet project demands? Your Gantt chart can help you make informed decisions.
Communication and Collaboration
Share your Gantt chart with your team and stakeholders. It serves as a common reference point for everyone involved, fostering effective communication and collaboration. It's much easier to discuss project status and adjustments when you have a visual representation.
Risk Management
Identify potential risks to your project's timeline and address them proactively. If you anticipate delays or obstacles, have contingency plans in place. Your Gantt chart can include these contingencies, providing a safety net for your project.
Celebrate Milestones
As you reach important milestones in your research, take the time to celebrate your achievements. This not only boosts morale but also serves as a motivator for the next phase of your project.
Tips for Using Gantt Charts Effectively
To make the most of Gantt charts for your research project, here are some additional tips:
- Keep It Simple: While Gantt charts can become complex for large projects, strive to keep yours as simple as possible. Too much detail can make it difficult to read and maintain.
- Regular Updates: Don't let your Gantt chart become stagnant. Regularly update it to reflect the current status of your project.
- Use Colours: Use colors to differentiate tasks or highlight critical paths in your Gantt chart. This makes it easier to spot important information at a glance.
- Be Realistic: Set realistic deadlines and durations. Overloading your schedule can lead to burnout and project failure.
- Collaborative Tools: Consider using collaborative project management tools that allow multiple team members to update the Gantt chart in real time.
- Training: If you're working with a team, ensure that everyone understands how to read and update the Gantt chart. Offer training if necessary.
In the world of research projects, where meticulous planning and execution are paramount, Gantt charts are indispensable tools. They offer clarity, organization, and control over your project's timeline, making them essential for both research proposals and project management.
By following the steps outlined in this guide and implementing Gantt charts effectively, you'll be better equipped to tackle your research project with confidence. From defining your objectives to celebrating your achievements, Gantt charts are your trusty companions on the journey to research success.
So, the next time you embark on a research project, remember the power of the Gantt chart. It's not just a tool; it's your roadmap to research excellence. Happy researching!
Related articles
The future of hr: how human resources management systems are revolutionizing the workplace, managing multiple projects in your startup using slikk.ai, tracking key performance indicators (kpis) in your startup with slikk.ai, top project management software for marketing agencies in 2023, how slikk emerges as the ultimate time tracking software for agencies, one platform to boost productivity and collaboration.
Slikk helps you get more tasks done in less time. It's everything you need to work faster, communicate better, and improve productivity in a single workspace.

The Research Whisperer
Just like the thesis whisperer – but with more money, how to make a simple gantt chart.
In every grant application, I want to see a simple visual guide (a Gantt chart ) that shows what you are planning to do. It is the perfect time to plan your project clearly. It shows the assessors that you have thought about your research in detail and, if it is done well, it can serve as a great, convincing overview of the project.
Clearly, these charts are hard to do. If they were easy, more people would do them, right?
Here are five steps to create a simple guide to your research project.
1. List your activities
Make a list of everything that you plan to do in the project. Take your methodology and turn it into a step-by-step plan. Have you said that you will interview 50 people? Write it on your list. Are you performing statistical analysis on your sample? Write it down.

Check it against your budget. Everything listed in the budget should also be listed on your uber-list? Have you asked for a Thingatron? Note down that you will need to buy it, install it, commission it… What about travel? Write down each trip separately.
2. Estimate the time required
For each item on your list, estimate how long it will take you to do that thing. How long are you going to be in the field? How long will it take to employ a research assistant? Realistically, how many interviews can you do in a day? When will people be available?
Initial meeting: about 3 weeks to find a time. Desk audit: 4 months. Draft key elements: about 1 week each. Testing: about 1 week each, but can start organising as soon as first element is drafted. Write up: 2 months. Final report: no time, really – just need to find a time to meet.
Generally, I use weeks to estimate time. Anything that takes less than a week I round off to a week. Small tasks like that will generally disappear from the list when we consolidate (see Step 4). Then I group things together into months for the actual plan.
3. Put activities in order
What is the first thing that you are going to do? What will you do next? What will you do after that?
In the comments, Adrian Masters provided some great questions to help with this stage: What do I need to do by when? What do I need from others & when? How do I check that I am still on track?
One by one, put everything in order. Make a note of any dependencies; that is, situations where you can’t do one thing until another is started or finished. If the research assistant is going to do all the interviews, then the interviews can’t start until the research assistant is hired.
Where possible, you should eliminate as many as possible dependencies. For example, if you can’t find a decent research assistant, you will do the fieldwork yourself (but that might mean that work will be delayed until you finish teaching). It isn’t a necessary step to getting your time-line in order, but it is good project management practice.
In the comments, Amy Lamborg pointed out that you might want to work backwards . If you have a fixed end date, you might want to “…build back towards the project start date, then jiggle everything until it fits !” If you want an example of this, have a look at the post “ Work backwards “. It is about writing an application, but the principle of starting with the fixed end date and working backwards still applies.
4. Chunk it up
Now that you have an ordered list, and you know how long everything will take, you need to reduce the list without losing any specificity. At the same time, if you are combining tasks, you might want to add a bit of time as a contingency measure.
Meet with partners: 3 weeks. Review data protection regimes: 4 months. Draft three key elements: 3 months. Test three key elements: 3 months, with some overlap. Analyse test results and report: 3 months.
How you divide up your time depends on your project. If it is only one year long, you might list items by month. If your project is three years long, then you might list items by quarter. If you are planning over five years, you might break it down to six-month periods.
5. Draw me a picture
If you use project management software to manage your project, and you are comfortable with it, then use it to produce a summary of your project, too.
Most project management software (e.g. like Microsoft Project) will allow you to group activities into summary items. Chunk your tasks into major headings, then change the time interval to your months, quarters, half-years, or whatever you have chosen to use.
Or you can just draw it up with word-processing software (which is what I always do), spreadsheet software, or even hand-draw it.

Frankly, I don’t care – as long as it ends up in your application!
Also in the ‘simple grant’ series:
- How to write a simple research methods section .
- How to make a simple research budget .
Share this:
62 comments.
This is useful. I’m writing my first SERIOUS research proposal for my PhD. Obviously not something I’ve ever done before so all advice is greedily welcome.
My best advice – write something quickly and then get someone else to look at it. I’m a big fan of quick iterations to get started.
Your readers might be interested in Tom’s Planner ( http://www.tomsplanner.com ). It’s a very easy tool to help you create a schedule or project plan (and there is a free version). On our blog we have a bunch of guest blogs about planning your thesis or dissertation with a template and example to help you get started.
The free version is a farce you cannot print, export or do anything but view it online. So don’t waste time with this product it is not a real proof of concept.
Sometimes, when the chunks are too big, you end up failing to understand what’s in those chunks, then your estimate ends up WAY off when you realize the extra work you didn’t consider might go into a give task.
That looks like a useful technique for getting the right information together for a Gantt. I’d be interested in any techniques for step 5. It’s something I’ve done recently as part of my first year PhD report and I wrote about how I produced my Gantt chart here: http://phdtools.blogspot.com/2011/08/creating-gantt-charts.html
I can’t imagine many people use MS project to manage their entire PhD (I could be wrong?) therefore it seems a bit excessive to use it just for a Gantt chart. Equally I find Excel plots look a bit naff and it’s difficult to show linkages between items.
“I’m not looking for a tool to perform PERT or CPM or do resource levelling for me.”
Absolutely! I just want to plug in my info and get a simple image out. How hard is that?
I’m not a big fan of big-iron project management tools either. More time seems to go into managing the information than getting actual work done.
I do think that most group projects that are going to last twelve months or more could do with a simple project management tool, though. I’m a bit of a fan of Basecamp , even if it doesn’t draw Gantt charts.
Of course, everybody has to understand the tool and want to use it, which is a different matter.
Thanks for the post.
I’m currently trying my hand at project management software, but I seem to find it easier to simply write down stuff in a piece of paper before committing it to electronic format. Anybody else has the same issue?
Absolutely, Carlos. As someone who has managed a big project that included spending a lot of time wrangling MS Project, I’m a big fan of just scribbling it down on paper and then mocking it up in MS Word.
[…] How do you create a Gantt chart? The best advice we have seen is at the useful Research Whisperer blog, where they list 5 steps to creating your very own Gantt Chart in the post ‘How to make a simple Gantt chart’. […]
Excellent introduction to project planning. I’ve seen recent examples of project managers jumping into MS Project without this level of thinking, with predictable results.
Questions that should help (and which you would need to answer anyway when asked by seeking funding or approval) include: What do I need to do by when? What do I need from others & when? How do I check that I am still on track?
Build those answers into the simple paper approach above, and you’ll have covered the critical project basics (activities, resources, dependencies, scheduling, milestones and checkpoints)
Like Liked by 1 person
Thanks, Adrian.
I liked your questions so much, I added them into the original post. 🙂
An Excel bar chart is pretty much all you need to create a Gantt chart. Unless of course you intend to explore resourcing and costs.
Your info really helped me by doing my D.T ( Design Technology) homework. Thank You 🙂 Eirene Masri From Jordan, Amman
Thanks for your comment. It made me smile. 🙂
I haven’t been to Jordan for a very long time, but I had a great time when I was there.
[…] that you are going to do? What will you do next? What will you do after that? In the comments, Adrian Masters provided some great questions to help with this […]
Thanks for this particular piece of ‘whisper’… I was in a dire need of a ‘quickie’ method to make a simple Gantt Chart. 😀
Cheers, Yan London
No worries, Yan. Happy to help.
[…] Jonathan. “How to make a simple Gantt Chart” The Research Whisperer. 13 September […]
I have just gone through.Iam also planning to undertake a phd programme and would want to recieve guild as i make progress using gantt Chart
Reblogged this on Queer Fear: Alternative Gothic Literary and Visual Cultures and commented: Stumbled across this useful piece on the use of Gantt charts in research projects. I realise this may seem rather common knowledge to scientists but as a Arts and Humanities-based person I found it gave useful insights for new researchers.
Thanks, Hanoconnor.
I suspect that there are plenty of science people who don’t get any formal training in this, either.
good job. very helpful
[…] Read More At: https://theresearchwhisperer.wordpress.com/2011/09/13/gantt-chart/ […]
This is my first time using a Gantt chart in research paper.. hmm. thanks for the info. 🙂
Gantt charts are really useful. Thanks for posting this information about gantt charts. This is a very informative post and very helpful, too.
Thanks Jonathan. I have just completed my first Gantt chart for my Doctorate in Health. I was beginning to get a bit jumpy about some of the very involved instructions I had found previously so your ‘idiots guide’ was really helpful.
No worries, Ade.
Happy to help. Good luck with your doctorate.
I have been using a Gantt chart to plan and track my doctorate since I began last year. It’s just an Excel spreadsheet but suits my purposes, very simple. One thing I’ve found useful us to mark all the highlighted cells bright blue initially, for ‘future action’. Each week, I update that week’s column to green (completed) or red (overdue). This gives me good feedback not only about where I need to change the priorities on my current ‘to do’ list, but is a very satisfying display of how much I’ve already done.
I love Excel, postgradpanda. I reckon that seeing the blue change to green would be very satisfying.
Thanks for this.
[…] https://theresearchwhisperer.wordpress.com/2011/09/13/gantt-chart/ […]
Thanks for this. It helped me alot for doing our work schedule in research for short allotted time.
Ohh Thank God Jonathan for that!! you have no idea how much you saved my life.. I was having a real hard time planning my first ever research proposal Loved it alot.. Looking forward for much guidance along the path!!!
Sruti… (From a far far away land.. INDIA)!! 🙂
Thanks, Sruti
Happy to help.
Sruti was right. It’s very helpful to me as well. Saves me a lot of trouble. Keep it up Jonathan.
No worries, Paul
Are you a commercial representative for Ganttic, or did you link to them because you like them? Just wondering.
[…] published a short article about doing research in academia. Some of their articles are mundane (How to make a simple Gantt chart), whereas others are more esoteric (Hashing it over) and heartfelt (Academic […]
[…] out your timeline and your budget. Working up a Gantt chart for your project will force you to think about how long different phases of the project will take. This is important […]
list any six elements that go into the format of a research report?
Hi abukamara
I don’t have a set list. It depends who your audience is, and what sort of report you are writing.
I’m usually helping people to write grant applications, where the format is set by the funding agency. They make it pretty simple, really – they generally tell you exactly what they want.
[…] logframe analysis is well worth reading, while the Research Whisperer explains how to make a simple Gantt chart. And Mind Tools overviews a range of project scheduling tools as does this from MIT. Over at […]
[…] take you three or maybe three-and-a-half years. However, PhDs in my area rarely follow the sort of gantt chart anybody approving funding, ethics clearance or candidature milestones might approve. A tangent I […]
[…] How to make a simple Gantt chart – Jonathan O’Donnell. […]
Jonathan, i suppose that you should try more intuitive service) My experience in project management tells me there are a lot of comlicated tools such as MS Project. After years of searching and trying (Wrike, Liquid Planner, Smartsheet) i start using GanttPRO, especially because of its simplicity and high visibility. So try GanttPRO to facilitate workflow.
[…] O’Donnell, J 2011, How to make a simple Gantt chart, The Research Whisperer, weblog, 13 September, viewed 23 April 2017, < https://theresearchwhisperer.wordpress.com/2011/09/13/gantt-chart/> ;. […]
[…] research design is important. Following the steps outlined in O’Donnell’s (2011) blog How to make a simple Gantt Chart, I constructed this graph and a risk matrix to ensure that my time was used efficiently. […]
[…] Other tips on Gantt charts, including how to make one manually: https://theresearchwhisperer.wordpress.com/2011/09/13/gantt-chart […]
Thanks Jonathan! I am a grant writer, and your post is a great reminder that I should probably make a timeline visually appealing, like your hand-made Gantt. I’m going to do it!
I wanted to point out that for a grant funded project (which often has a specified end date by which the money must be spent), I often find myself making a timeline backwards. That is, I start creating the timeline from the specified end date, and then ask myself the questions that Adrian Masters posed: What do I need to do by when? What do I need from others & when? I build back towards the project start date, then jiggle everything until it fits!
BTW, did you know that in your text descriptions of the example timeline, the time is in weeks, but in your Gantt chart the time is in months? I have a feeling that you really meant for these to match….
Like Liked by 2 people
Thanks, Amy
This article has been viewed over 150,000 times, and you are the first person to point out the weeks / months issue. I’ve fixed it now (although it is a bit of a bodge).
I agree with the backwards process, so much so that I wrote a post about it: Work backwards . It is about the grant writing process, but the principle is the same.
This particular instance was one of those rare times when I truly didn’t have an end date, and could work out the actual time the project would take (surprise – it took longer).
I’ve added a bit into the post about working backwards. Thanks for that.
Proofreading touchdown? You just made my day! Thanks for this, and for Research Whisperer in general. I am probably not really your intended audience, but I get a lot of value from all the posts. You-all do good work!
[…] Research Whisperer. (2016). How to Make a Simple Gannt Chart.[online] Available at: https://theresearchwhisperer.wordpress.com/2011/09/13/gantt-chart/ [Accessed 14 Mar. […]
[…] O’Donnell, J 2011, ‘How to make a simple Gantt chart’, The Research Whisperer, 13 September, viewed 13 April 2018, < https://theresearchwhisperer.wordpress.com/2011/09/13/gantt-chart/> ;. […]
[…] you know how to make a simple Gantt […]
[…] How to make a simple Gantt chart: This article provides steps on making a Gantt chart (generally, not specific for PhD). […]
[…] “How to Make a Simple Gantt Chart,” by Jonathan O’Donnell on The Research Whisperer […]
[…] analysis of all their blog search terms. His analysis showed lots of people were looking for how to make a simple Gantt Chart. Jonathan’s excellent analysis left me wondering: what do readers think is ‘high value […]
If your university has the Microsoft suite of programs Viso (I think it is called) is easy to learn the basic functions to make a Gantt and the nice thing is that when you change a date the program moves the bars for you so fewer errors 🙂 winning.
Thanks, Wendy. Good advice.
[…] complex, messy, and not as linear as suggested by the timeline of activities we outline in project Gantt charts. During my doctorate, there were twists and turns as I made decisions around which literature to […]
[…] webinars should I register for? What about grants? Reading groups? Mentoring? How exactly does a research GANTT chart work (or does it)? How can I get research and writing done without sacrificing my entire summer on […]
[…] my various projects. This method was originally inspired by two academic Gantt chart enthusiasts (one, two). However, I found that the traditional way of setting up a gantt chart (with the projects on […]
Leave a comment Cancel reply
This site uses Akismet to reduce spam. Learn how your comment data is processed .

- Already have a WordPress.com account? Log in now.
- Subscribe Subscribed
- Copy shortlink
- Report this content
- View post in Reader
- Manage subscriptions
- Collapse this bar
- Edit My Profile
- My Favorites
How to use a Gantt chart for a research project
Blog: monday project management blog.
Using a Gantt chart for a research project can give all stakeholders a better understanding of timelines and the resources needed for each task. When you detail all crucial tasks, project scheduling is easier and overwhelming tasks become more manageable. With all project activities neatly laid out within a timeline and every minor detail accounted for, a Gantt chart provides your team with the framework for successful project operations.
In this article, we’ll discuss a Gantt chart and how you can use it in a research project to maximize efficiency and promote greater transparency. We’ll also share how you can use monday.com’s project management Work OS to simplify any research project further.
Get started
What is a Gantt chart?
A Gantt chart is a bar chart popularized in the early 1900s by (and named after) Henry Gantt. It lets you establish a detailed project plan according to when you need each task completed. If done correctly, a Gantt chart creates a realistic time frame for a project by establishing a start date for the whole project and each task. Then, you can pair these start dates with an estimation of how long the task will take, broken down by days, weeks, or months.
What makes a Gantt chart unique is that it establishes dependency relationships between all relevant tasks, which can help you better understand necessary workflows. For example, let’s say you’re creating a research proposal. One of your tasks is to promote awareness and garner support for the proposal on social media. However, before you can do that, you need to create informational materials you can distribute and have the proposal outline ready for viewing. Since these necessities are clearly outlined in the Gantt chart, you can plan your project timeline accordingly.
By clearly highlighting dependency relationships between project tasks, a Gantt chart promotes greater transparency to all project stakeholders.
How can you use a Gantt for research projects?
Research projects are vast undertakings that require a lot of your time, effort, and brain power. Sometimes it’s easy to get sidetracked or confused about what comes next in your research or how you should put it together. A clear understanding of objectives and deadlines can help you organize even the most complex research project undertakings. Even better, a Gantt chart provides clear step-by-step instructions with dependency relationships marked to ensure every team member understands their responsibilities.
A Gantt chart ensures all research project team members clearly understand objectives, deadlines, and task dependency relationships.
Best practices for planning and scheduling a research project
Understanding the best practices for planning and scheduling a research project can help you get the most out of your Gantt chart . A few best practices include:
- Have a clear goal : Before sitting down to plan your research project, ask yourself some crucial questions. What are you trying to achieve? Why are you trying to achieve it? When do you need to complete it?
- Use scheduling tools : Use task and resource scheduling tools when possible to reduce the risk of human error.
- Get the team involved : Gather your team together for a brainstorming session, if possible, when developing a list of tasks required to meet your final objective.
- Consider dependency relationships : Consider the dependency relationships between objectives carefully and be realistic about time frames. Ensuring your team has enough time to successfully and thoroughly complete each task from the beginning sets your research project up for success.
- Identify potential issues : Identify risks and potential roadblocks in your schedule and have a backup plan for each to ensure a steady workflow with minimal pushbacks.
- Consider resource requirements : Consider the resources necessary to complete each task. Remember to include work hours as resources and schedule each team member appropriately to achieve objectives in the desired time frame.
- Plan for reporting : Assign specific times, or interval periods, for progress reports and compare these with your initial estimations. If these reports show alterations are necessary, don’t be afraid to make changes.
- Identify KPIs : Before the research project begins, identify key performance metrics and track them as you go to define your success clearly. You may find using a relevant tool or platform the easiest way to track performance metrics.
Proper knowledge and skills are half the battle in a research project. Having the right tools can increase efficiency, decrease downtime, and ensure objective deadlines are not only met but exceeded.
Managing research projects on monday.com
monday.com’s robust project management Work OS makes managing research projects easier by:
- Centralizing projects from start to finish : Our Work OS lets you centralize all projects from conception to completion, with customizable dashboards that show you the information you deem most important. Quickly assess risks, bottlenecks, and roadblocks to keep your research project moving forward.
- Streamlining project workflows : Streamline workflows by automating routine tasks and assigning teammates to the work they’re most qualified for. Then, track individual and project-wide progress in real-time with regular task updates. Use color coding to make task management even more straightforward.
- Enabling communication across teams : Our Work OS promotes communication between project members and across different teams, so all stakeholders know where things stand at all times. You can share documents , leave notes, and work together in real-time for more effective communication that allows you to exceed every deadline and meet every objective.
A Gantt chart template pairs perfectly with monday.com’s project management. However, other templates can make other critical aspects of managing research projects easier.
Related templates
A basic Gantt chart can help you plan your research project in detail. You can use other templates to fine-tune other essential aspects of your project.
Keyword power tools template
Our Keyword Power Tools Template uses a Gantt chart format to help you visualize project timelines and monitor each phase of your research projects from one platform. This template can help you make the most of man hours and materials by enabling a high level of project resource organization. Proper resource allocation is crucial to your project’s success and can significantly increase productivity, efficiency, and employee satisfaction. Getting team members the tools and resources they need equips them for success.
Publication and journals template
Our Publications and Journals Template is an excellent tool for content publishing companies. You can use our template to:
- Manage your publication process: Our template enables whole-process management from submission to approval. Easily track article status and monitor writer workload to ensure you meet publishing deadlines.
- Visualize your publishing pipeline: Customizable dashboards allow you to receive a high-level overview of all current and upcoming articles and where they stand.
- Track individual contributions: Ensure each writer meets minimum contributions and isn’t given too large a workload by tracking individual contributions. When authors receive enough work, they feel valued. When you ensure their workload isn’t too much, you can prevent staff burnout so they can continue performing at their best.
By now, you should have a working idea of Gantt charts and how they increase transparency and efficiency in project management. However, if you still have questions, we’ve answered a few FAQs below.
How do you create a dissertation in a Gantt chart?
To create a Gantt chart dissertation, you should first understand your timeline and deliverables. Once you’ve written these down, create detailed task lists of how you’ll accomplish each deliverable and consider dependency relationships between each. Finally, use the Gantt chart to outline your dissertation from start to finish.
What should be in a dissertation timeline?
In a dissertation timeline, you should include the following:
- Role assigning (if applicable)
- Research tasks
- Experiments, social or scientific (if applicable)
- Data collection and analysis
- First draft completion
- Submission to the advisor (first) and dean (at completion)
How do you create a Gantt chart in Word?
You can create a Gantt chart in Microsoft Word by:
- Opening a new Word document
- Change the document orientation from vertical to horizontal
- Insert a bar graph into your document
- Make format alterations as necessary to make the graph look like a Gantt chart
- Insert information and customize as necessary
Any team can increase transparency in their research projects with monday.com
Using a Gantt chart to create a detailed project timeline can help increase transparency and promote greater efficiency in your organization’s research projects. When you pair a Gantt chart with monday.com’s robust project management system, you have the tools you need to meet deadlines, complete objectives, and exceed expectations.
The post How to use a Gantt chart for a research project appeared first on monday.com Blog .
Leave a Comment Cancel reply
You must be logged in to post a comment.

- Terms and Conditions
- A resource provided by © 2024 Business Process Incubator
Using the HTML code below, you can display this Business Process Incubator page content with the current filter and sorting inside your web site for FREE.
Copy/Paste this code in your website html code:
Customizing your BPI Web Feed
You can click on the Get the BPI Web Feed link on any of our page to create the best possible feed for your site. Here are a few tips to customize your BPI Web Feed.
Customizing the Content Filter On any page, you can add filter criteria using the MORE FILTERS interface:

Customizing the Content Sorting Clicking on the sorting options will also change the way your BPI Web Feed will be ordered on your site:

Some integration examples

Gantt Chart Templates for Research Project Proposals
Are you a project manager with an upcoming research proposal to tackle? If so, there's no doubt that constructing a Gantt chart is essential for your success. Not only do they provide visibility into the timeline of any project, they also offer insights into resources and dependencies needed to achieve goals on time. We know how challenging it can be to create this type of complex chart manually, which is why we've compiled a list of our favorite Gantt charts templates specifically designed for research projects! Read on to learn more about each template and how incorporating them into your workflow will benefit you or your team.
Project Roadmap Gantt Chart Template

The Project Roadmap Gantt Chart Template by ClickUp is a must-have for any research proposal. This simple, clear template allows you to map out the entire project from start to finish in an easy-to-follow format. With this template, it's easy to visualize tasks and deadlines, resources required and dependencies between tasks. Plus, with its built-in integration with Google Sheets, you can easily and quickly share your project timeline with other stakeholders.
Try Template
Business plan gantt chart template.

If you're creating a research project proposal for a business, the Business Plan Gantt Chart Template by ClickUp is the perfect tool. This professional-looking template provides a visual representation of your timeline and includes key milestones to help plan your proposal. Not only can you track progress at each stage of the process, but it also allows you to easily adjust timelines if deadlines shift or resources become unavailable. It's the perfect solution for a business project proposal plan!
Project Deliverables Gantt Chart Template

Don't let your research proposal slip through the cracks! The Project Deliverables Gantt Chart Template by ClickUp is the perfect tool for managing deadlines and tasks associated with any project. This template helps you track progress at each stage of the process, ensuring that all deliverables are met on time and within budget. Plus, its intuitive design allows you to quickly make changes as needed, without sacrificing accuracy. Make sure your research project is a success with the Project Deliverables Gantt Chart Template!
Waterfall Project Management Proposal Gantt Chart Template

The Waterfall Project Management Proposal Gantt Chart Template by ClickUp is the perfect tool for any project manager. This template is specifically designed to help you manage complex tasks in a sequential manner, so that each task is completed one-by-one without any overlap. With this template, it's easy to plan out the timeline of the project, as well as tasks and resources needed throughout the process. Make sure your research proposal is a success with this template!
Construction Management Plan Gantt Chart Template

The Construction Management Plan Gantt Chart Template by ClickUp is the perfect tool for managing large-scale construction projects. This template helps you keep track of all tasks, resources and deadlines associated with a project from start to finish. Plus, its intuitive design makes it easy to adjust timelines as needed without sacrificing accuracy or detail. Make sure to present this during your next project proposal, to ensure success!
Related Templates
- Project Proposal Whiteboard Template
- Gantt Proposal Template
- Creative Agency Proposal Template
- Campaign Proposal Template
- Marketing Proposal Template
One app to replace them all
24/7 support
Weekly updates
Secure and compliant
99.9% uptime
- Affiliate & Referrals
- Product Roadmap
- On-Demand Demo
- ClickUp University
- Consultants
- Gantt Chart
- Native Time Tracking
- Automations
- Integrations
- Kanban Board
- vs Airtable
- vs Basecamp
- vs MS Project
- vs Smartsheet
- Software Team Hub
- Contact sales
- Start free trial
What Is a Gantt Chart? (Examples & Templates)
Presented by projectmanager, the gantt chart software used to plan over 2 million projects. make a gantt chart in minutes.

What Is a Gantt Chart? Definition & History
What is the purpose of a gantt chart, what is included in a gantt chart, what is a gantt chart used for, how are gantt charts used in project management, gantt chart examples.
- Free Gantt Chart Templates
How to Use a Gantt Chart
Benefits and advantages of a gantt chart, disadvantages of using a gantt chart, gantt chart alternatives, what is gantt chart software.
- How to Make a Gantt Chart With Gantt Chart Software
Who Uses a Gantt Chart?
Gantt chart video for beginners, gantt chart faqs.
A Gantt chart is a project management tool that allows project managers to create a project schedule by mapping project tasks over a visual timeline which shows the order in which they’ll be completed, when they’re due, their duration and other details about them such as their percentage of completion. Every Gantt chart has two main parts, a grid or task list on the left side and a project timeline on the right.
The Gantt chart was created by Henry Gantt in the early 20th century to improve project planning, scheduling and tracking by illustrating completed work compared to planned work. Today, project managers and team members use Gantt charts to plan projects, create a project schedule, allocate resources and track progress with just one project management tool.

However, there’s so much more to know about Gantt charts beyond a simple Gantt chart definition. In this guide, we’ll explore some of the main aspects that you need to know about Gantt charts including what they’re used for and the different methods and tools you can use to make one, such as Gantt chart software .
This guide also has examples and free Gantt chart templates you can use to get started quickly. We’ve even created industry-specific Gantt chart templates so you can create project schedules for your business in minutes.
At a basic level, a Gantt chart allows project, program and portfolio managers to easily map out project plans by organizing project tasks on a visual timeline. However, Gantt charts are used for many other purposes in project planning, project scheduling, project tracking and resource management.
With ProjectManager’s Gantt chart, you can assign tasks to your team members, set due dates, estimate costs and monitor progress in real time. The best part is that it can be used along with other project management tools such as kanban boards, real-time project dashboards, timesheets and team collaboration tools.
There are two halves to most Gantt chart tools you see online today. On the left is a grid that lists project tasks and important information about them and on the right, there’s the Gantt chart timeline, a visual representation of the project schedule.
Gantt Chart Grid
The grid of a Gantt chart is where you list project tasks and project scheduling details about them. The Gantt chart grid is the most important component of your Gantt chart because the data you enter here will be used to populate the Gantt chart timeline.
The more details about your project tasks you can add to a Gantt chart grid, the more aspects of your project plan you’ll be able to track.
Basic Gantt chart software only allows you to assign tasks to your team members and create project timelines based on the due dates and duration of your project tasks. However, more advanced Gantt chart software like ProjectManager enables you to track other areas of your project.

Here are some of the key aspects of your project you can track with ProjectManager’s Gantt chart grid.
- Task name: Briefly describe your task. You can also add more task details using other project views such as kanban boards and task lists.
- Task owner: Assign tasks to team members.
- Task priority: Set a priority level for all your project tasks so you can better allocate your resources.
- Project phases: In most projects, there’s a set of well-defined phases that are made up of related tasks.
- Work breakdown structure level: The work breakdown structure level is a number that allows you to understand the order in which project tasks must be completed and what project phase they’re in.
- Project milestones: Track project milestones, which are major events, accomplishments or deliverables in your project timeline.
- Resource requirements: Indicate what resources are needed to complete each project task, including labor and non-labor resources such as raw materials, equipment or machinery.
- Estimated & actual costs: Estimate costs for each project task, create a project budget and then log the actual costs as tasks are executed so you can determine whether your project is on, over or under budget.
Now, let’s go over the other half of any Gantt diagram, the Gantt chart timeline.
Gantt Chart Timeline
The Gantt chart timeline is a stacked bar chart where each project task is represented by a bar that runs on the horizontal axis. The task bars start on the date that the work is scheduled to start and end on the date when it’s expected to finish. The longer the bar, the longer the task will take.

But that’s not everything a Gantt chart timeline shows. Based on the data from the Gantt chart grid, ProjectManager’s robust Gantt chart timeline lets you zoom in on the following details of your project schedule .
- Due dates & task duration: Add planned start and planned finish dates and adjust them at any time by dragging and dropping tasks on the Gantt timeline. You can also compare planned vs. actual task duration.
- Task dependencies: You can also show the task dependencies in number form. Choose the “Linked From” column in the column settings. Task dependencies are represented as arrows that link tasks in the Gantt chart timeline.
- Percent complete: A figure, mostly always based on an educated guess by the project team, of how much work they have done and how much is still to do.
- Critical path activities: ProjectManager’s Gantt chart maker automatically identifies the critical path based on your project task list, dependencies and due dates.
Free Gantt Chart Template
Need help building a Gantt chart? Try ProjectManager’s free Gantt chart template and practice adding tasks, dependencies, phases, milestones and more on a dynamic Gantt chart.

On the left-hand side is the data grid, where the various phases of the project are outlined. Under each color-coded phase are the tasks associated with it, including WBS, assignees, due dates and other resources needed to execute the scheduled tasks.
The visual timeline on the right is where things get interesting. You can see the entire project in one place, dependent tasks can be linked and milestones added to indicate important dates. Put your Gantt chart knowledge to the test and build one today. Get started for free.
Because the Gantt chart is such a diverse project management tool for identifying timelines and task dependencies, it can be used in any industry or field. Here are some examples.
- Gantt charts in project management : Gantt charts compile the information project managers need to create a visual timeline that shows all the elements of a project plan in one place. With Gantt charts, project managers can schedule projects, allocate resources, set cost and scope baselines, and identify the critical path.
- Gantt charts in construction: Construction Gantt charts are used by project owners, general contractors and construction project managers to plan the different phases of a construction project, such as initiation, pre-construction and procurement. However, Gantt charts can also be used on a smaller scale to manage everyday tasks.
- Gantt charts in software engineering: Software engineering teams use Gantt charts to create project roadmaps , which are essential for task management when developing new products. This is done by simply mapping software development tasks on a timeline, just as if it was a project plan.
- Gantt charts in manufacturing: Gantt charts can be used to plan, schedule and track multiple aspects of the manufacturing process. For example, you can use Gantt charts to create product roadmaps, production schedules and map the product development cycle.
- Gantt charts in project portfolio management: Gantt charts can be also used to create a portfolio roadmap, which is a timeline that allows project portfolio managers and project management offices (PMOs) to track the progress of multiple projects.
These are only some of the most common use cases for Gantt charts, but they can be used for managing projects across industries. Now, let’s take a closer look at how Gantt charts are used in project management.
Gantt charts can be used to plan, schedule and track projects of all sizes and industries, mainly because they’re compatible with most project management methodologies , such as waterfall and agile.
Gantt Charts in Waterfall Planning
Waterfall project management consists in planning a project in sequential phases. These project phases are planned in advance and then executed in order from beginning to end without making many changes to the original project plan. Gantt charts are ideal to map out such projects as they allow project managers to visualize task dependencies and establish task sequences on a project timeline.
Gantt Charts in Agile Planning
Unlike waterfall, agile planning consists in planning short iterations of work of one to two weeks known as agile sprints , where teams plan and execute their work. They then have short meetings where they review their performance and plan the next sprint. While Gantt charts aren’t commonly used to plan sprints, they help agile teams to map out their project plan or product development roadmap at large, which lets them see the bigger picture of their projects.
These two project management approaches are used to manage most projects, even though there are other methodologies that can be used for specific industries or scenarios. However, the best way to understand how Gantt charts are used in project management is to look at some Gantt chart examples.
We’ve created two Gantt chart examples using ProjectManager to see how Gantt charts can be used for managing different types of projects. These Gantt chart examples show a schedule for a construction and a manufacturing project, which are two of the industries where Gantt charts are used the most.
In these Gantt chart examples, you can easily see:
- The Gantt chart timeline
- What the project tasks are
- Which team member is working on each task
- When project activities start and finish
- The percent complete for each activity and work package
- How tasks group together, overlap and link with each other
- Task dependencies such as finish-to-start, start-to-start, finish-to-finish and start-to-finish
- Milestones and project phases on the schedule
Construction Gantt Chart Example
This Gantt chart example shows a construction schedule that’s divided into six project phases: contracts, design, procurement, construction, post-construction and closing.
Defining project phases is the first step when using a Gantt chart for planning a project. It helps break down the project plan into smaller steps that are easier to manage. Once you’ve defined project phases, you can proceed to identify the individual tasks for each of them, as shown in the image.

Once you’ve identified your project tasks, you’ll need to add as much information as possible about them, such as their planned due dates, duration, dependencies, resource requirements, estimated costs and other relevant details.

Once you’ve added all these details to each project task column, the Gantt chart timeline will show your project tasks, their dependencies, assignee and percent complete.

The best part of using ProjectManager’s Gantt charts to create a project schedule is that you can simply drag and drop these bars in the Gantt chart timeline to adjust the project tasks’ due dates or their duration. You can easily add or remove dependencies and identify project milestones.
Our construction schedule Gantt chart template also allows you to use other advanced Gantt chart features such as creating project baselines, finding the critical path and tracking the resource utilization and costs for each of your tasks.
Manufacturing Gantt Chart Example
While managing the production process is completely different from managing a construction project , the steps for creating a schedule using a Gantt chart are the same. You’ll also need to define project phases, break down your project scope into tasks, identify dependencies and add project task details to the Gantt chart.
This Gantt chart example shows a manufacturing project that consists of creating a product from scratch and then creating a production schedule for manufacturing it. The phases for this manufacturing project are product ideation, design, prototyping, pre-production and production.

Our Gantt chart production schedule template allows you to track each step in the product development process, such as ideating your product, establishing its feasibility, creating a proof of concept, making a prototype, testing its quality and more.
Then, once you have a working prototype that’s ready to be launched into the market, you can use the Gantt chart to schedule the production process and estimate the time it’ll take to manufacture it, the needed resources and your production costs.

Using Gantt chart software for tracking the production process is ideal for manufacturing businesses that execute multiple projects simultaneously .
However, creating a Gantt chart from scratch can be an overwhelming process, especially for those who are just getting started with this project management tool. If you’re not ready to use Gantt chart software yet, you can try using a Gantt chart template for Excel, PowerPoint, Google Sheets or Word.
Free Gantt Chart Templates for Excel, PowerPoint & More
We’ve created several Gantt chart templates that can facilitate the process of creating and using a Gantt chart to manage your projects. Simply enter your project information and follow the instructions to create a Gantt chart for projects in minutes.
Free Gantt Chart Template for Excel
This free Gantt chart Excel template helps you build a Gantt chart and a project timeline in minutes. It gives you a visual overview of your entire project from start to finish.
Simply add all of the tasks needed to reach your final deliverable and manually update any changes during the execution of the project. It’s a great example of a Gantt chart in Microsoft Excel .

Free Gantt Chart Template for Google Sheets
This free Gantt chart template for Google Sheets is similar to an Excel Gantt chart, but it can be accessed by your team members online, instead of having to download a file and store it in their computers. This also means you can collaborate with your team online so any file changes can be seen by anyone with access to it.

Free Gantt Chart Template for PowerPoint
This free Gantt chart template for PowerPoint allows you to create a simple Gantt chart based on your project task names, duration and due dates. You can attach them to any PowerPoint presentation, which helps communicate the progress of your project in a visual format that can be easily understood by most people.

Free Gantt Chart Template for Word
While Microsoft Word might not be the first software you think of when looking for a tool to make a Gantt chart, it can be used to make Gantt charts. In fact, this free Gantt chart template for Word is as good as the Excel or PowerPoint Gantt chart. The key difference is that this Gantt chart template for Word is designed for adding a Gantt chart to project documents.

However, these free Gantt chart templates are best suited for creating simple Gantt charts , as they lack advanced project management features that are needed for larger projects such as resource management and cost tracking.
Now that we have more context about Gantt charts, let’s explore how to use a Gantt chart for planning, scheduling and tracking your projects . Below, we’ll explain some of the most common uses for Gantt charts in project management.
Create a Work Breakdown Structure
Before you can use a Gantt chart to create a project schedule , you’ll need to first identify all the individual tasks that make up the total amount of work that’s needed for your project. A work breakdown structure (WBS) is a tool that can help you with this process. It’s important that you do this during the project planning phase so you don’t miss any project tasks.
Create a Task List and a Gantt Chart Timeline
Now create a Gantt table by listing down your project tasks, their due dates, duration and any other details you’d like to track about them such has resource requirements or costs. Then Use this information to create Gantt chart timeline, which at a basic level should show the dates and duration of project tasks.
Identify Task Dependencies
One of the key aspects that differentiate Gantt charts from other project planning tools is that they allow project managers to identify and visualize task dependencies . A task dependency is simply the relationship project tasks have among each other that dictates the order in which they must be completed. While Gantt charts let you represent task dependencies, these can’t be automatically determined. It’s your responsibility as a project manager to define them, otherwise, the project schedule won’t be accurate.
Find the Critical Path of Your Project
The critical path of a project is the longest sequence of tasks that need to be executed. It’s important to determine what your critical path is because if those tasks are delayed the whole project completion will be delayed. Luckily some Gantt chart software alternatives will automatically do this for you.
Track Gantt Chart Milestones
Gantt charts allow you to track project milestones, which are important events that occur at some point in your project timeline. Project milestones can be used to create a milestone chart, which is a simplified version of your project timeline that summarizes major activities, project deliverables and accomplishments so that you can track how a project is progressing from a high-level view.
Allocate, Schedule and Track Resources
Gantt charts can be more than just a project scheduling tool, they can also be used to estimate what resources are needed to complete your project, allocate resources for the execution of work and track resource utilization throughout the project life cycle. ProjectManager’s Gantt chart, for example, syncs with real-time dashboards that allow you to monitor the utilization of project resources in real time and workload charts that let you balance your team’s workload.
Create Project Baselines and Compare Planned vs. Actual Results
Gantt charts should be used to map your project plan, but also record the actual results of your project. ProjectManager’s Gantt chart allows you to compare the estimated costs and due dates of your tasks against the actual values so you can determine whether your project is being executed within the boundaries of your project budget or schedule.
The Gantt chart is one, if not the most important project management tool to plan, schedule and track projects. Here are some of the main pros and cons of using Gantt charts to manage projects from any industry.
- Gantt charts allow project managers to turn complex project plans into a visual project timeline that’s easy to understand.
- Gantt charts are the perfect tool to compare the actual performance of your project team against the original project plan, schedule and cost baselines to determine whether a project is being completed on time and under budget .
- Gantt charts allow project managers to understand both the scope of a project and its schedule from start to end, including task dependencies.
- Gantt charts are also considered a resource management tool because they allow project managers to understand how they’re allocating their resources .
Even though Gantt charts are one of the most important project management tools, there are some cases in which they might not be the ideal solution.
- Gantt charts can be hard to understand for some team members and stakeholders who aren’t used to them.
- Not all Gantt chart software available in the market offers the same features, which is something to look out for as some lack important features.
- Other project tools such as task lists or kanban boards can be an easier method to keep track of tasks, such as when managing small teams, or short-term projects.
- Gantt charts operate in a linear fashion and aren’t very dynamic for agile projects.
Gantt charts are not the only project management chart you can use to create a project schedule or manage project tasks. There are other tools you can use such as PERT charts, kanban boards or network diagrams . Here’s how Gantt charts compare to these tools.
Gantt Chart vs. Network Diagram
Network diagrams are a project planning chart that can help you visualize the order in which tasks must be completed, so everyone on your team has a clear idea of how work will be executed. Additionally, project network diagrams can help identify task dependencies that might be in your project plan, which is an important factor to consider when creating a project schedule.
In project management, network diagrams are used as part of the program evaluation and review technique (PERT) and the critical path method (CPM), which are two important project scheduling methods.
However, network diagrams can only help you during the project scheduling process, but can’t be used for tracking the progress of your project, as they lack task, resource or cost-tracking features.
Gantt Chart vs. PERT Chart
PERT charts are a network diagram that allows you to map the task sequences that make up your project, estimate its total duration and identify critical path activities.
To do so, you’ll need to use the PERT chart formula, which factors in the start and finish dates of your project tasks, dependencies between them and estimated duration.

However, PERT charts aren’t as versatile as Gantt charts as they won’t allow you to assign tasks to your team members, create a project timeline or monitor the percentage of completion of tasks.
Gantt Chart vs. Kanban Board
Kanban boards are a popular task management tool that can be used for managing projects across industries. A kanban board consists of a set of columns and cards. The columns indicate the status of a project task, such as “to do” or “completed” while kanban cards represent project tasks.
Kanban boards are a great task management tool for managing the everyday tasks and workflows of your team but they won’t allow you to create a project timeline or get a high-level view of your project plan like a Gantt chart would. This makes Gantt charts a better tool than kanban boards for project planning and scheduling.
This doesn’t mean you can’t use Gantt charts and kanban boards for managing your projects. In fact, this is greatly advised, as each of these project management tools can help you manage your projects from different perspectives.
Once computers introduced new ways of working, project managers found they could save time in creating and updating their Gantt charts. Gantt chart software, also called project planning, project management, or even project scheduling software, was created to automate the process to support more advanced Gantt requirements like creating task dependencies, adding milestones or identifying the critical path of a project plan.
Watch the video below for a quick introduction to ProjectManager’s online Gantt chart maker and its benefits.

Many project managers traditionally used local desktop programs like Microsoft Project —and many still do. But today, most Gantt chart makers and project management software have moved online, enabling anyone to create shareable and collaborative Gantt charts and project plans.
Choosing the right project management tool for your team is an essential task, so we’ve reviewed the best free and paid Gantt chart software and ranked them based on their key features, pros and cons. It’ll help you better understand what to look for when comparing Gantt chart software.
Must-Have Gantt Chart Software Features
While no two Gantt chart tools are the same, there are key features that you'll need to get the most out of your Gantt chart tool:
Milestones are represented by a diamond symbol on the Gantt diagram and have no duration. A milestone marks the end of a piece of work, task sequence or project management phase. They’re often fixed dates or important dates on your project schedule that you need to be aware of. Read more: Learn how to use milestones in your scheduling.

Task Dependencies
These show which tasks are linked together. Links are shown with lines on the Gantt chart, and the arrow points to the task that comes next. Task dependencies can be set up as start-to-finish, start-to-start, finish-to-finish or finish-to-start. Read more: Learn how to manage task dependencies.
Summary Tasks
A summary task is a skinny ‘umbrella’ task above various individual tasks. It’s a good way of using a Gantt diagram to group activities together, especially as part of a project stage or phase. You can ‘roll up’ your tasks (in other words, hide them from view) so that only the summary task is shown. The summary task also displays the task progress with shading, so you can view the progress of all tasks underneath in that one bar.

Collaboration
A Gantt chart without collaboration is just a static plan. It’s nice to have, but it isn’t helping you advance the work your team is doing. Be sure that you can chat or comment around tasks to keep the workflow documented. Your team will then get alerts every time a task has been updated, so they know when new activity has occurred.

File Sharing
It’s important as you collaborate to also be able to attach files, images, videos or other notes to document the task progress and keep all the task information together. That way, you always know where to look to find the files related to the tasks you’re scheduling on your Gantt diagram.

Planned vs. Actual Progress
This is represented in a couple different ways on the Gantt diagram. Shading on the bar indicates how complete the planned work is. When the bar is shaded, the task is finished. You can also see just a view of the actual progress anytime in the settings. Don’t forget to set a baseline for the best tracking experience.

How to Make a Gantt Chart Online With Gantt Chart Software
Onboarding your team members with ProjectManager’s Gantt chart maker allows you to better plan, schedule and track all types of projects . Once you’ve invited your team members to the new Gantt chart tool, you can start improving the way you manage tasks, resources and timelines. But before we get to the benefits of using online Gantt chart software, let’s go through a step-by-step guide to making a Gantt chart in ProjectManager.
It’s easy for anyone to create a Gantt chart online in ProjectManager. You can import a task list from a CSV file, an Excel Gantt chart template, or a Microsoft Project file or create one from scratch. Unlike Gantt chart Excel templates, our Gantt chart maker does the heavy lifting so you can focus on what’s important.
Simply add project tasks to the tool, fill in the information and a fully-fledged Gantt chart will generate automatically. Our Gantt chart has advanced project management features that’ll let you set task dependencies, identify the critical path and use timesheets for resource tracking, just to name a few.
Also, since it’s an online Gantt chart maker, you and your team members can build the Gantt chart together in real time while you share files and documents with unlimited storage.
Now, without further ado, here’s a step-by-step guide to creating a Gantt chart with ProjectManager , one of the best Gantt chart software available in the market.
1. Create a New Project
When you first log in, you simply enter a project name and select “Create.” You’ll be directed to the Gantt chart view.
2. Add Project Tasks to Your Gantt Chart
As you add tasks, the default date will be today. Since you haven’t added a longer due date than today, the tasks appear in the Gantt chart tool to the right as circles, representing that they start and end today. The dotted line represents today’s date.

3. Assign Tasks to Team Members
You can easily assign or re-assign tasks to team members based on their availability in real time, which is ideal for workload management . When people are assigned tasks, their name appears above the taskbar on the Gantt chart. The Gantt chart maker lets you know whether your team members are available, or if they’re already scheduled for other tasks.

4. Add Due Dates to Your Gantt Chart
As you extend the start and end dates, the task bars on the Gantt chart view extend too, showing you how long each task will take. Add those dates under the planned start and planned finish columns.
5. Prioritize Your Project Tasks
The Gantt chart maker has a task prioritization feature that allows you to establish a priority level for each task so you and your team can focus your efforts on the most important activities. Best of all, this priority tag can also be used in other project views, like task lists and kanban boards for better task tracking.
6. Estimate Task Costs
Add the estimated costs for each task. Our Gantt chart maker helps you estimate labor costs for each project task based on how many team members are working on it and their hourly rate. On top of that, these labor costs are also updated on timesheets you can easily share with your team members.
7. Link Task Dependencies Using the Gantt Chart Timeline
Linking task dependencies is an advanced project planning feature that lets you create a realistic project schedule. There are four types of task dependencies that allow you to understand how your projects’ task sequences are interrelated. In the picture below, you can see how Gantt chart bars are connected by arrows, which indicates there’s a dependency between tasks.

8. Identify Critical Path Activities & Project Milestones
The Gantt chart maker automatically identifies the critical path of your project, which helps you focus on the critical tasks or the tasks that must be completed on time so that your project is completed on time. In addition, you can mark any project task as a milestone, which lets you pinpoint an important achievement, deliverable or the end of a project stage for detailed project tracking .

9. Customize Your Gantt Chart
You can customize your Gantt charts in whatever way suits your team. Here, you can see that different people are represented by different colors on the Gantt taskbars so it’s easy to see at a glance who is responsible for which tasks. Others might use colors on the stacked bar chart to represent different phases of a project or different teams responsible for a group of tasks.

10. Attach Files, Comments or Notes
When your team works collaboratively on an online Gantt chart maker, you can do so much more than just plan tasks. You can add images, videos, links, notes or comments right at the task level, so all the relevant task work is captured and easily accessible in one place.
11. Track Your Team’s Progress
All the updates on the Gantt diagram can be seen in one view. You can see what the team is working on and when tasks have been updated. Team collaboration is easy with online Gantt charts.
It used to be that Gantt charts were the exclusive tool of formally trained project managers. These were people planning complex projects of all different types: construction , engineering, military, manufacturing, infrastructure, IT and more. Creating long task lists and complex project schedules with lots of moving parts, required training in the art and science of task management, critical path analysis, baselining and so on.
Today, nearly everyone can use a Gantt chart to help them visualize their tasks. Because all the difficult work is now done by project management software, anyone can just create a simple task list , add start and end dates, and the software does the work instantly by displaying your tasks over a project timeline.
Gantt charts can be used by all kinds of teams, such as:
- IT & software development teams
- Project management teams
- Marketing teams
- Professional services teams
- Engineering & architectural teams
- Construction teams
- Manufacturing teams
- Product development teams
Here are some examples of potential users of Gantt charts:
- Project managers
- General managers
- Team leaders
- Operations managers
- Scheduling managers
- Marketing managers
- Executives such as CEOs & CTOs
- Anyone who wants an instant view of a project timeline
If you still need help setting up and understanding your Gantt chart, watch this video by Jennifer Bridges, PMP.
If you still have questions about Gantt charts, they should be answered in the following frequently asked questions.
Can You Make a Gantt Chart Online?
Yes, there are online Gantt chart tools such as ProjectManager that allow you to create a Gantt chart online without having to install any software on your Mac or PC.
Can You Make a Gantt Chart in Excel?
Microsoft Excel doesn’t have a Gantt chart feature but you can create one by customizing the stacked bar chart or using one of the free Gantt chart templates available online.
We’ve created a how-to guide with detailed instructions on how to make a Gantt chart in Excel from scratch. Learning to do so allows you to better understand how an Excel Gantt chart works as well as its key features and limitations.
Can You Make a Gantt Chart In Word?
Making a Gantt chart in Word can be very useful as most project teams use Word for creating their project documents. You can create a Gantt chart in Word by inserting a stacked bar chart into a document, adding your project schedule information (such as start, end dates and duration) and customizing the Gantt diagram for greater readability.
Then, once you’ve created your Gantt diagram in Word , you can copy and paste it into any project document you’d like such as a project plan or project proposal.
Can You Make a Gantt Chart in PowerPoint?
Like Word or Excel, PowerPoint allows you to insert stacked bar charts which can be transformed into a Gantt chart. We’ve created a how-to guide with detailed instructions you can follow along if you’d like to make a Gantt chart in PowerPoint.
The best part is that once you create a PowerPoint Gantt chart , you can use it for all your project presentations. Simply copy and paste the PowerPoint Gantt chart into a new presentation and edit its data.
Can You Make a Gantt Chart in Microsoft Project?
Yes, Microsoft Project is project management software equipped with a Gantt chart tool. Some of the key features of Microsoft Project’s Gantt chart are its cost and resource monitoring, critical path analysis, task dependency mapping and milestone tracking.
If you’d like to try Microsoft Project’s Gantt diagram, but need help to get started with this tool, check out our blog on how to make a Gantt chart in Microsoft Project . This blog also goes over the key features, pros and cons of a Microsoft Project Gantt chart.
Can You Make a Gantt Chart in Google Sheets?
To make a Gantt chart in Google Sheets, open a new blank spreadsheet, add the tasks data for your project (including duration, start and end dates), insert a stacked bar graph and then transform the bar graph into a Gantt chart. There are Gantt chart templates for Google Sheets too.
We also have a blog that explains how to make a Gantt chart in Google Sheets , with easy-to-understand steps and images, which makes it ideal for sharing with your team members.
What Does Gantt Stand For?
The Gantt chart was named after Henry Gantt , and many think he was the one who first had the idea of project planning on bar charts. This isn’t entirely true.

Left: Henry Gantt | Right: Karol Adamiecki
Karol Adamiecki devised the first Gantt diagram back in 1896. He was a Polish engineer turned management professor who came up with the idea of displaying processes visually so that he could make it easier to see production schedules. (He did most of his work in the steel industry.) He called it the harmonogram (a much better word) but Adamiecki published his articles on it in Polish and Russian, so the English-speaking world didn’t know much about it.
Henry Gantt had the same idea as Karol Adamiecki, but about 15 years later. In 1910, Gantt started planning visually with bar charts to allow supervisors in the steelworks to see if production was on track or behind schedule. It was Gantt’s name that got attached to this way of project planning, but today it’s generally recognized that Adamiecki had the idea first.
Gantt Chart Resources
- Gantt Chart Software
- Project Scheduling Software
- Project Planning Software
- Project Management Templates
- Work Breakdown Structure (WBS) Template
- Gantt Chart Template for Excel
- Gantt Chart Template for PowerPoint
- Project Plan Template
- Best Gantt Chart Software: Paid & Free Options Ranked
- Gantt Chart Task Dependencies
- Easy Ways to Make a Gantt Chart with Google Sheets
- How to Make a Gantt Chart on Mac
- How to Make a Gantt Chart In PowerPoint
- How to Make a Project Schedule
- How to Make a Project Plan
- The Ultimate Guide to the Critical Path Method
- The Ultimate Guide to Work Breakdown Structure (WBS)
Start your free 30-day trial
Deliver faster, collaborate better, innovate more effectively — without the high prices and months-long implementation and extensive training required by other products.
.css-s5s6ko{margin-right:42px;color:#F5F4F3;}@media (max-width: 1120px){.css-s5s6ko{margin-right:12px;}} Discover how today’s most successful IT leaders stand out from the rest. .css-1ixh9fn{display:inline-block;}@media (max-width: 480px){.css-1ixh9fn{display:block;margin-top:12px;}} .css-1uaoevr-heading-6{font-size:14px;line-height:24px;font-weight:500;-webkit-text-decoration:underline;text-decoration:underline;color:#F5F4F3;}.css-1uaoevr-heading-6:hover{color:#F5F4F3;} .css-ora5nu-heading-6{display:-webkit-box;display:-webkit-flex;display:-ms-flexbox;display:flex;-webkit-align-items:center;-webkit-box-align:center;-ms-flex-align:center;align-items:center;-webkit-box-pack:start;-ms-flex-pack:start;-webkit-justify-content:flex-start;justify-content:flex-start;color:#0D0E10;-webkit-transition:all 0.3s;transition:all 0.3s;position:relative;font-size:16px;line-height:28px;padding:0;font-size:14px;line-height:24px;font-weight:500;-webkit-text-decoration:underline;text-decoration:underline;color:#F5F4F3;}.css-ora5nu-heading-6:hover{border-bottom:0;color:#CD4848;}.css-ora5nu-heading-6:hover path{fill:#CD4848;}.css-ora5nu-heading-6:hover div{border-color:#CD4848;}.css-ora5nu-heading-6:hover div:before{border-left-color:#CD4848;}.css-ora5nu-heading-6:active{border-bottom:0;background-color:#EBE8E8;color:#0D0E10;}.css-ora5nu-heading-6:active path{fill:#0D0E10;}.css-ora5nu-heading-6:active div{border-color:#0D0E10;}.css-ora5nu-heading-6:active div:before{border-left-color:#0D0E10;}.css-ora5nu-heading-6:hover{color:#F5F4F3;} Read the report .css-1k6cidy{width:11px;height:11px;margin-left:8px;}.css-1k6cidy path{fill:currentColor;}
- Project management |
- What is a Gantt chart? A guide to mappi ...
What is a Gantt chart? A guide to mapping your project timelines

A Gantt chart is a horizontal bar chart used to illustrate a project’s schedule and related tasks or events during the project lifecycle. Find out how this type of chart can help you map tasks and keep deliverables on track.
While these charts can get quite complex, the basics aren’t hard to nail. In our guide, you’ll get a clear breakdown of what Gantt charts are, when to use them, tips for creating one, and more.
What is a Gantt chart?
A Gantt chart is a horizontal bar chart used to illustrate the timeline of a project and its tasks. This gives your team a visual overview of project information like your project schedule, upcoming milestones, and overall project timeline.
Each horizontal bar within the chart represents a task, and the length of each bar represents the amount of time that step or task will take. When you zoom out to look at the full picture, these charts give project managers and project teams an overview of what work needs to get done, who’s doing it, and when.
Gantt charts typically include the following components:
Task start date
Task duration
Task end date
Most Gantt charts also offer additional context about how project tasks connect to each other, who they’re assigned to, and what important deadlines and milestones are coming up. With a dynamic timeline, team members have at-a-glance insight into what they’re responsible for and how their work impacts the project as a whole.
Get started with a free template in Asana
Kick off work the right way, every time. Use templates to standardize and scale business processes across your organization.
History of the Gantt chart
Polish engineer Karol Adamiecki created the first iteration of a Gantt chart in 1896, which he called the harmonogram. Adamiecki published his findings in Russian and Poli
sh, which made them difficult to access in English-speaking countries. In 1910, American mechanical engineer Henry Gantt independently popularized a similar chart in the United States, which he devised in order to represent how long factory workers spent on a given task. These two systems have since been merged to create what we know today as the modern-day Gantt chart.
After tracking factory employees’ tasks, these charts became a popular way to track project schedules . Originally, these charts were drawn on paper, which meant that whenever the schedule changed, the charts had to be redrawn. Later, project managers used pieces of paper or blocks to represent the task bars, so they could move them around as needed.
Gantt chart example
Studying this example of a Gantt chart is helpful for understanding how to map out a project lifecycle effectively.
![[Product ui] Gantt chart project, organized timeline view in Asana with dependencies and due dates (Timeline)](https://assets.asana.biz/transform/aa091ca9-b87c-4fb0-96ad-47453f5473df/inline-project-management-gantt-chart-basics-2-2x?io=transform:fill,width:2560&format=webp "gantt chart research plan")
Initial steps: The project starts with the "Identify key stakeholders" activity, which lays the groundwork for all other tasks that follow.
Planning phase and project launch: Tasks like "Map out dependencies" are scheduled alongside "Define project goals," due by December 15 to indicate tasks that can occur simultaneously. While the "Kick off project" action establishes a key milestone and planning deadline.
Task management: Tasks such as "Measure performance against goals" and "Assign action items" suggest a cycle of continuous evaluation and task distribution.
Finalizing and reporting: Activities that help team members and stakeholders recognize the steps needed as the project culminates to a conclusion include "Prepare presentation" and "Present to leadership." While the final phases of the project are represented by tasks like "Communicate results" and "Complete project," which concentrate on project wrap-up and outcome communication.
While every chart will look different, this example will help you grasp the fundamentals of task sequencing and time management critical for any successful project.
What is a Gantt chart used for?
While you can use a timeline view for a variety of projects and programs, it’s helpful to understand what these charts are commonly used for and why:
Build and manage complex projects: The bigger the project, the more tasks there are to manage. Gantt charts can help project managers when scheduling projects by allowing them to easily visualize a project and break it down into smaller tasks.
Monitor task dependencies: Project delays happen. Visualizing work in a timeline helps project managers automate task dependencies, which ensures that the next phase or task doesn’t start until the previous one has finished.
Keep track of project progress: Track progress and milestones, so you can quickly adjust your project plan if needed.

1. Mapping out a marketing campaign
Larger marketing campaigns require a lot of team collaboration and coordination—and it’s easy to lose track of all the moving pieces. That's why it's so important to visualize all of your work as a sequence of tasks with assignees and details about how long each initiative will take. This way, teams don’t just know who’s responsible for what, but also how their work impacts others or the larger goal.
2. Outlining deliverables for a client
When you show clients a timeline of all of your deliverables , you can clearly set expectations around how long each will take. By outlining plans this way, you can give stakeholders and clients a clear idea of the scope of your deliverables, and how long each one will take to accomplish—so they won’t just know when you’re delivering an item, but also the timeframe in which you’ll be working on it.
3. Planning a product launch
For product launches, you might use a timeline to map out the entire plan, from ideation to launch and beyond. By visualizing this in a timeline, you’re then able to more easily spot conflicts before you begin, see dependencies between steps, and get a clear overview of everything that’s happening leading up to the launch and when.
Parts of a gantt chart
Have you ever wondered what makes up a Gantt chart and how each component contributes to effective project management? Understanding the anatomy of a Gantt chart can help you leverage its full potential in organizing and visualizing your project timelines. Here are the essential components of a Gantt chart, each with an example:
Task list: A vertical list of project tasks on the left side of the chart, serving as the foundation for plotting the project timeline. For example, a project to develop a new website might include tasks like "design homepage," "write content," and "code website."
Task bars: Horizontal bars that represent the duration of each task, showing the start and end dates. For instance, the task bar for "design homepage" might span two weeks in April, visually indicating its planned duration.
Milestones: Markers that signify key dates or achievements within the project timeline. An example is marking the completion of the website prototype as a milestone, which indicates a significant achievement in the project's progress.
Dependencies: Lines or arrows that connect tasks to indicate the sequence in which tasks must occur. If "write content" cannot start until "design homepage" is complete, a dependency arrow would connect these tasks.
Critical path: Highlights the longest sequence of dependent tasks that determine the project's duration. In our website project, the critical path might include tasks such as "code website," directly impacting the project's end date.
Resource allocation: Information on which resources are assigned to specific tasks is often included alongside the task bars. An example would be assigning a specific web designer to the "design homepage" task.
Dates and time scale: The top of the chart features a calendar or time scale that tasks and milestones are plotted against to provide a temporal context. For example, the entire project might be set against a six-month time scale from April to September. This helps stakeholders visualize the project timeline at a glance.
Each of these components plays an important role in providing a comprehensive overview of the project's scope, duration, and dependencies.
How to make a Gantt chart
While no two Gantt charts look exactly alike, there are some basic steps you’ll need to take to get you off the ground, no matter what project management software you use.
1. Define the time range
Your Gantt chart should be a project with a start and end date. Think of this chart as a way to represent your project over a timeline—your timeline needs a beginning and end point.
Tip: While all projects should have a clear end point, it’s likely that you’ll have some additional follow-up tasks with your client after crossing the finish line, so you may need to add in some dates after the fact for these items.
2. Add tasks with start and end dates
In order to effectively visualize your to-dos, make sure each individual task has a specified beginning and end date—this way they can be easily visualized on a bar chart. If you don’t add task start dates, then your tasks will show up as moments in time, which might be harder to visualize within the bigger picture.
Tip: Clear start and end dates also make it easy for your team to understand when they should begin working on a task. By doing this, they won't be unprepared for a big project that is due tomorrow.
3. Clarify dependencies
With large projects, it’s natural to have some tasks that can’t get started until other tasks are complete. To keep the project running smoothly and every team on the same page, you can visualize dependencies between tasks in your Gantt chart.
In the example below, the ability to publish the product blog post is dependent on reviewing the blog post, which in itself is dependent on drafting the blog post. Similarly, the team can’t launch the email campaign until it’s been drafted. Drawing dependencies between these tasks will help the next team stay up-to-date on what they’re able to start working on in their phase of the project.

4. Pinpoint milestones
Unlike most tasks in a Gantt chart, milestones are fixed points in time. Think of them as checkpoints to signify that large pieces of work are complete. They help your team know what to prioritize and can be great moments of celebration when they’re completed.
Tip: Milestones often take place at the end of project phases, but there’s no one single way to create milestones for your team, especially since every team and project looks different. Examples of milestones might look like:
Project approvals
Task starting points
Mid-phase check ins
Phase completion points
5. Modify work as plans change
Plans will inevitably change, which is why your Gantt chart software should be able to adapt to your needs. Look for a tool that allows you to easily drag and drop tasks, and that automatically updates dependencies in real time. That way, you can always keep your project on track, even as plans shift.
Gantt chart best practices
When teams first start using Gantt charts, they often encounter a few common hurdles. These challenges can lead to miscommunication, resource misallocation, and ultimately, project delays.
However, with the right best practices in place, Gantt charts become powerful tools for improving project visibility and team coordination. The following Gantt chart best practices are designed not just as tips but as solutions to these common initial stumbling blocks.
Determine the critical path
Establishing the critical path of a project timeline is key to understanding the sequence of tasks that directly affect the project's completion date. This practice involves identifying which tasks are critical (i.e., any delay in these tasks will delay the project) and which tasks have float (i.e., can be delayed without affecting the project timeline).
By focusing on the critical path, project managers can allocate resources more effectively and prioritize tasks that are essential for on-time project completion.
In a software development project, tasks such as requirement gathering, design, coding, testing, and deployment are mapped on a Gantt chart to identify the critical path. It reveals that delays in the coding phase directly affect testing and deployment timelines. However, tasks like documentation might have some float and can be adjusted if coding needs more time. This insight enables project managers to prioritize coding and allocate extra resources if necessary, ensuring the project remains on schedule despite potential bottlenecks.
Use a work breakdown structure
A work breakdown structure (WBS) is a fundamental step in project planning that involves dividing a project into manageable tasks and subtasks. When applied to a Gantt chart, a WBS helps organize tasks visually, making it easier to monitor progress and allocate resources efficiently.
Consider a project to develop a new website. By using a WBS, you would break down the project into smaller tasks such as design, content creation, and coding. Each task would then be represented on the Gantt chart timeline, giving team members a clear overview of the project scope that helps them understand their responsibilities and deadlines.
Identify task dependencies
Understanding task dependencies is crucial for creating an accurate Gantt chart. Task dependencies indicate the relationship between tasks and subtasks, showing which tasks must be completed before others can begin. This ensures that the project flows logically and resources are allocated appropriately.
For a construction project involving the building of a structure, it's essential to complete foundational subtasks before advancing to subsequent phases, such as erecting walls. The Gantt chart efficiently maps out these work dependencies to ensure contractors realize the importance of completing the foundation to avoid scheduling conflicts and inefficient resource use.
Allocate resources wisely
Resource allocation involves assigning the appropriate resources, including team members, equipment, and budget, to specific tasks. A Gantt chart with integrated resource allocation allows project managers to see not only when tasks are scheduled but also how resources are distributed across the project.
For an event planning project, a Gantt chart can show that while one team works on venue setup, another is arranging catering. Task visualization ensures that resources are not overstretched and that tasks are adequately staffed. This helps prevent burnout and ensures that all project aspects are covered.
Monitor progress regularly
A Gantt chart is not a set-and-forget tool; it requires regular updates to reflect the project's current status. Incorporating dashboards into this practice provides a centralized, real-time view of project progress, task completion, and resource allocation. Dashboards complement Gantt charts by offering an at-a-glance summary of key project metrics, enabling project managers and team members to quickly assess project health and make informed decisions.
During a software development sprint in an agile project , if a sprint is behind, a dashboard updated alongside the Gantt chart quickly highlights delays and resource issues. This allows for immediate adjustments to make certain the project stays on track without extensive meetings or email updates. This streamlined approach keeps everyone aligned and responsive to changes.
Pros and cons of Gantt charts
While these charts can be helpful, they aren’t always the best for every project. To better understand if this type of project chart is right for you and your project vs. a timeline, here are a few considerations before you leap into creating one.
Get a bird’s-eye view of your project timeline: A Gantt chart is a roadmap of your project . This tool helps you track when you should reach each milestone—and whether or not you’re on track to do so. This type of timeline view offers a bird’s-eye perspective on your work, making it a particularly useful tool to present to senior management or clients for a quick overview.
See how tasks relate to each other: By adding start and finish dates to each task and drawing dependencies, you can visualize how each piece of work affects another. This helps you identify problems and fix dependency conflicts before you start.
Improve team resource management : Adding an owner to each piece of work can help you see who’s doing what and when to better manage individual workloads. Since everything is plotted out sequentially, you’ll be able to see if an individual teammate or team has too much to do at one time, then reassign or reschedule tasks as needed.
More time consuming to set up: Setting up a Gantt chart can be time consuming, especially if you’re using a Microsoft Excel spreadsheet. Even if you use a template, you might still have to make adjustments to customize it to your team’s specific needs.
Difficult to manage the project in the same place you planned it: Traditional Gantt charts are most useful in the planning phase of a project. Once you’ve mapped out your work, you’ll likely need to use a different tool or platform to manage day-to-day activities, making it hard to know where your team’s single source of truth is.
Adding more details gets messy: Adding context around deadlines and collaborators to your project plan on a Gantt chart can turn it from easy-to-view map to overwhelming sheet of chaos.
Alternatives to traditional Gantt charts
Fortunately, there are alternatives to clunky charts that still give you a bird’s-eye view of how all your work fits together—without the typical limitations of a traditional, spreadsheet-based chart.
A work project management tool like Asana can help you manage, coordinate, and add details to your work in the same place you plan it—while also spending less time setting everything up.
For example, you could set up your project plan using Asana’s Timeline , a view that lets you map out how all the pieces of your project fit together. Like a Gantt chart, Timeline shows you when each step will happen, how long it will take, and who’s responsible. Unlike a Gantt chart, Timeline is easy to set up and maintain and lets your team collaborate on work in the same place you planned it.
Other types of visual project management
![[Product UI] Brand campaign project example (Boards)](https://assets.asana.biz/transform/0bf24409-8788-4d08-a745-84550c9502a2/inline-generic-boards-2x?io=transform:fill,width:2560&format=webp "gantt chart research plan")
Depending on the type of work you’re managing, a calendar or a Kanban board could work as a more lightweight and quicker-to-setup alternative to visualizing your project plan in a timeline . With Asana, you can also switch between project views. View any project in either Timeline, List, Boards, or Calendar View, so your team can see their work in the way they prefer. You can test out all of these views with a free Premium trial .
Plan projects like a pro with Asana
Whether you end up using a Gantt chart or a similar alternative, visualizing your project plan is a key step for every team—whether you’re a project manager or not. It allows you to show how all the pieces of your project fit together, share it with your team, and adapt your plan as work progresses to keep everything on track.
Map out your project plan and watch the pieces come together with Asana.
Gantt Chart FAQ
What types of teams commonly use Gantt charts? Any team that needs to keep track of task progress can use Gantt charts. Typically, Gantt charts are used by project managers and team leads, but they’re also useful for business owners and C-level executives. Common industries that employ Gantt charts include marketing, software engineering, construction, graphic design, and event planning.
What are the typical components of a Gantt chart? At its most basic, a simple Gantt chart is composed of a vertical axis, which contains a list of tasks, and a horizontal axis, which maps out the project’s timeline. By visually displaying your project plan in a constrained timeframe, Gantt charts help you see at a glance the step-by-step actions you need to take to ensure project success.
What should I look for in a Gantt chart tool? When setting up an online Gantt chart, you should look for a tool with a user-friendly interface and features that make planning and coordinating your work easy, like start and end dates, dependencies, and milestones. Additionally, tools that utilize integrations to connect the chart with apps, like Google Sheets and OneDrive , help streamline workflows.
Related resources

What is stakeholder analysis and why is it important?

How Asana uses work management to optimize resource planning

Understanding dependencies in project management

Program manager vs. project manager: Key differences to know
Gantt Chart Research Proposal

The #YouOnlyLiveOnce mindset thrives in the spirit of spontaneity and adventure. Although it can be fun, #YOLO will spell disaster outside the party scene. It is a terrible career and life advice that is equivalent to flushing your time and resources down the toilet. Smart and strategic project planning is the spine of every successful academic or business undertaking. Whether you are a student or a professional, you will benefit from mapping out your projects with Gantt charts and other progress-tracking illustrations. We have prepared the following pointers that will help you on your next big move.
21+ Gantt Chart Research Proposal Templates
Gantt charts are a useful productivity apparatus for project management. They are a bar chart derivative for task scheduling and progress tracking. The user plots the activity progress along the y-axis, with respect to the indicated time on the x-axis. The leftmost column contains the list of tasks while the top row displays project dates in uniform intervals. This chart is useful in visualizing the schedule of activities for your research proposals . When you use Gantt charts, you can monitor if your project goals are in sync with the actual work timeline.
1. Restaurant Gantt Chart Template

- Google Docs
- Google Sheets
Size: A4 & US Letter Sizes
You see the potential of a trend in increasing the revenue for your restaurant. How do you convince the management that your plan will work? Other than persuasive and well-researched content, your market research plan should contain a feasible work timetable. A realistic schedule of activities ensures that your proposed project is not just theoretical and that investing in it would not be a waste of resources. A Gantt chart works best for project timelines because it makes the project’s progress easy to monitor and relay. Add this template to your market research proposal!
2. Free Excel Gantt Chart Template

Size: A4 & US Sizes
The early Gantt charts were successful even before computers became mainstream in offices. Back then, you had to draw the charts manually. This means that when there would be revisions to the project proposals , you are required to recreate the entire diagram. The success of Gantt charts would not have survived the rigors of modern workspaces if there was no computer program for them. Fortunately, we have programs like Microsoft Excel and Apple Numbers where we can amend details without scrapping the entire chart. Get this free Gantt chart template now!
3. Free Progress Gantt chart with Events Template

There would be times that our project advisers would need a quick update on the progress of our research study. Give them a fast rundown of the development with this Gantt chart template! It gives a quick overview of the pace of the activities through percentage. It has a simple interface simple and is easy to navigate. You can also use this template when you’re presenting the progress of a specific task and its subtasks. Are you worried that adding a new activity might overlap with your previous assignments? Avoid that with this downloadable template!
4. Free Yearly Project Management Gantt Chart Template

Research, especially when it is an individual project, will challenge a person’s organization and project management competence. You will need to complete one task before you can proceed to another in your methodology . If you lag on one of your tasks, there will be a domino effect, and you will fall behind schedule. Even though some research studies can take a whole year or more, people usually find themselves short of time. Do not fall prey to this by being committing to a realistic schedule. Get started with this yearly Gantt chart template!
5. Free Sales Activity Gantt Chart Template

Instead of just plotting your research activity progress with respect to project dates, you can also monitor how much of the work is done! Although this is a sales activity template, you can use the same format for your research proposal . Each task is listed in the first column, while the percentage measures the amount of work done. With this monitoring format, you can picture the development of your research and the momentum of the activities. Boost your productivity with this free Gantt chart template now!
6. Free Marketing Plan Chart Template

With this Gantt chart template, make sure that you don’t fall behind your target deadlines again! The layout is specific down to the weeks of the month. You will be able to indicate at which week your research team started and completed the task. Did you hit the time allotted for each activity? The expected duration is placed next to the activity column for reference. You can use this template to present the schedule of events in your research proposal. The best part is that unlike other charts, you can keep updating this timeline during the entire project!
7. Free Basic Gantt Chart Template

The construction of the Hoover Dam started in 1931 and finished ahead of schedule. During the planning and construction, engineers referred to Gantt charts to keep track of the progress. Today, the charts are useful in different fields that need progress-tracking and project forecasts. It is helpful in your research proposals because you can define the timeline of your research as well as continually update the document for revisions. It is a reliable organization tool that you shouldn’t be sleeping on. Make use of such convenience in your research proposal with this template!
8. Free Monthly Gantt Chart Template

Gantt charts are an indispensable tool for project management. It gives you a birds-eye view of the entire research progress. Are you running out of time? Which of the following tasks can you adjust the schedule for? You can refer to it when you need to add or modify the activities. Monitor your progress better from start to end with this editable template! The design looks professional, and it won’t clash with the formality of your document. The landscape orientation lets you include more details into your timetable.
9. Research Proposal Gantt Chart Template

Size: 35 KB
10. Qualitative Research Proposal Gantt Chart Template

Size: 42 KB
11. Research Proposal Timeline Gantt Chart Template

Size: 38 KB
12. Nursing Research Gantt Chart Template

Size: 34 KB
13. Marketing Research Gantt Chart Template

14. Thesis Proposal Gantt Chart Template

Size: 30 KB
15. Sample Proposal Gantt Chart Template

Size: 37 KB
16. Medical Research Gantt Chart Template

17. Dissertation Research Gantt Chart Template

Size: 43 KB
18. Dissertation Proposal Gantt Chart Template

19. Business Research Gantt Chart Template

Size: 33 KB
20. Ph.D. Plan Gantt Chart

Size: 630 KB
Gantt charts are being used in doctoral dissertations as well. The attached PDF file is an example of a research timeline of a Ph.D. candidate. Most Gantt charts are in a landscape format to accommodate more content. The proponent structured his semestral schedule of activities in a monthly-basis. The designation of each main goal with different colors is smart. The chart shows that the proponent performed various activities under different goals per semester. Without a physical map, it is hard to picture the progress of his tasks. Like this Ph.D. candidate, organize your research endeavors with a Gantt chart!
21. Survey Planning Gantt Chart Sample

Size: 262 KB
Surveys are one of the effective methods of obtaining relevant information to answer queries. Despite its practicality and capacity to provide reliable data, the method isn’t a one-step process. You wouldn’t want to spend your resources on information that isn’t worth its price. You have to make sure that you get the right answers. You have to test the survey design first to a few people. Then there is still data analysis and report of findings. Is this method suitable for your research given the time available? Gain a reliable foresight by including a Gantt chart for your research proposal! Refer to this sample chart for guidance!
22. Task Gantt Chart Template

Size: 286 KB
A crammed research paper is not a good research paper . In the academe, students are given due dates to fulfill parts or sections of their thesis. Manage your deadlines well by tabulate your tasks and progress. By doing so, you can budget your time and adjust your working pace. Supplement your school hustle with a Gantt chart! It can be as straightforward as this sample, but its rewards on your scholastic performance are priceless!
Proposal Maker
Text prompt
- Instructive
- Professional
Generate a proposal for a new school recycling program
Compose a proposal for a school field trip to a science museum.
Jira Software
Project and issue tracking
Content collaboration
Jira Service Management
High-velocity ITSM
Visual project management
- View all products
Marketplace
Connect thousands of apps and integrations for all your Atlassian products
Developer Experience Platform
Jira Product Discovery
Prioritization and roadmapping
You might find helpful
Cloud Product Roadmap
Atlassian Migration Program
Work Management
Manage projects and align goals across all teams to achieve deliverables
IT Service Management
Enable dev, IT ops, and business teams to deliver great service at high velocity
Agile & DevOps
Run a world-class agile software organization from discovery to delivery and operations
BY TEAM SIZE
Small Business
BY TEAM FUNCTION
Software Development
BY INDUSTRY
Telecommunications
Professional Services
What's new
Atlassian together.
Get Atlassian work management products in one convenient package for enterprise teams.
Atlassian Trust & Security
Customer Case Studies
Atlassian University
Atlassian Playbook
Product Documentation
Developer Resources
Atlassian Community
Atlassian Support
Enterprise Services
Partner Support
Purchasing & Licensing
Work Life Blog
Atlassian Presents: Unleash
Product updates, hands-on training, and technical demos – catch all that and more at our biggest agile & DevOps event.
- Atlassian.com
- Agile project management
- Gantt chart examples
5 Gantt chart examples for better project management
Browse topics.
Gantt charts are indispensable tools in project management that visually represent project timelines, tasks, and dependencies. Gantt charts simplify task management, foster team collaboration, and enhance project visibility. We'll explore several Gantt chart examples and their diverse applications across various project types, from dependency mapping to date shifting and resource allocation. You'll discover how Gantt charts streamline every project phase, from project planning to execution, and adaptation, making them invaluable for both simple and complex projects.
Whether you're a project manager, team lead, or collaborator, understanding how to leverage Gantt charts effectively can elevate your project management capabilities.
What is a Gantt chart?
A Gantt chart is a visual project management tool that illustrates tasks and their timelines within a project workflow . It has three parts: a list of tasks on the left and a timeline on the right, with schedule bars representing the duration of each task.

A Gantt chart example can include additional details, such as task start and end dates, milestones, task dependencies, and the individuals or teams responsible for each task. It offers a comprehensive view of a project's tasks and their sequencing, making it a valuable resource for effective project management.
5 examples of Gantt charts for project management
Gantt charts aid in planning, scheduling, and tracking projects. While versatile, their core purpose is consistent: enhancing project visibility and aiding decision-making.
Let's explore several Gantt chart examples and how they aid in managing simple and complex projects.
1. Dependency mapping
Dependency mapping is a cornerstone in project management, not only for identifying, analyzing, and documenting task interdependencies but also for prioritizing them effectively.
Gantt charts are often the go-to visual tool for this purpose, with horizontal bars indicating the duration of each task and connecting lines specifying the dependencies among them. They offer dynamic benefits like enhancing sequencing and scheduling, particularly in projects with multifaceted dependencies.
Modern Gantt chart software further elevates the practice by providing real-time updates, allowing for Agile adaptability. These charts foster team collaboration by presenting a centralized, coherent view of the project, thereby minimizing misunderstandings and closing knowledge gaps.
Example : Imagine orchestrating a large-scale cybersecurity update across multiple teams. You need to complete some tasks, such as coding the software before rolling out the update. But other tasks, like employee training, can occur in parallel. Gantt charts illustrate these complex interdependencies, empowering project managers to allocate resources optimally and proceed with a well-timed execution.
2. Task management
Gantt charts offer a structured and visual approach to planning, scheduling, and resource allocation, making them invaluable in project management.
Here are some reasons why Gantt charts excel in task management:
- Task planning provides a clear project task overview regardless of complexity.
- Task allocation allows effortless assignment to team members, promoting collaboration.
- Timelines offer precise scheduling with defined start and end dates, preventing overwork.
- Task dependencies highlight interdependencies for correct task sequencing.
Progress tracking helps every stakeholder keep a tab on a project’s lifecycle through a chart.
Gantt charts streamline complex task information, facilitating decision-making, promoting organization, clarifying roles, and ensuring smoother project execution.
Example : A software development sprint includes coding, testing, and debugging. Gantt charts allow developers to assign tasks precisely, setting clear timelines for each sprint. Maintaining alignment, reducing overwork risks, and tracking progress visually helps teams meet release deadlines.
3. Project planning
Gantt charts provide an all-encompassing perspective on project scope, going beyond task enumeration to deliver strategic insight. These charts act as strategic roadmaps, meticulously aligning with overarching objectives.
They serve the dual purpose of guiding immediate action and facilitating long-term planning. Their high-level timelines are tailored for diverse project scales, from short-term bursts of activity to long-term strategic initiatives, offering stakeholders a robust framework for decision-making and resource allocation.
Beyond this, Gantt charts break down tasks into manageable steps, assigning ownership and establishing logical sequences. This task breakdown enhances resource optimization and accountability, while identifying dependencies ensures smooth project progress.
Gantt charts empower project planners to plan, visualize, and execute projects, making them invaluable for comprehensive project views, roadmap creation, and efficient task management.
Example : Marketing campaigns require the project team to juggle multiple tasks, such as market research, content creation, and campaign execution. Gantt charts serve as a visual roadmap for breaking down these tasks, assigning them to team members, and setting clear deadlines.
4. Date shifting
Gantt charts are versatile tools for managing project timelines and adapting to dynamic situations. They excel in date shifting, allowing you to add specific due dates for task alignment and clarity.
When adjustments are necessary, Gantt charts simplify the process with a user-friendly drag-and-drop feature, ensuring task flexibility. They also help manage scheduling delays by visualizing their impacts and enabling resource reallocation and schedule modifications.
During resource conflicts or unexpected emergencies, Gantt charts facilitate swift responses, providing the tools for task reassignment or deadline extensions. These capabilities make Gantt charts a reliable compass for navigating unexpected changes while keeping your project on course.
Example : Supply chain issues may delay a product launch. Using a Gantt chart, project managers can easily adjust the dates for dependent tasks, such as marketing and distribution. Adaptability minimizes the impact of delays and keeps the project on schedule.
5. Resource allocation
Resource allocation is a cornerstone of effective project management, and Gantt charts are instrumental in this process. Here's how to use Gantt charts for resource allocation:
- Identifying resource needs : Gantt charts document resource requirements, associating them with tasks or milestones for clarity.
- Checking availability : Gantt charts align resource timelines with project schedules, identifying conflicts and enabling adjustments.
- Managing constraints : Gantt charts accommodate limitations, such as working hours, allowing parameter definition for adherence.
- Optimizing usage : The visual representation of Gantt charts helps identify underutilization or overallocation, enabling task adjustments.
Example : Academic research projects use various resources, such as research assistants, lab equipment, and computing power. Gantt charts can determine when a project needs each resource, identify their availability, and optimize resource usage by avoiding bottlenecks.
A good Gantt chart example serves as a professional framework for resource allocation, ensuring judicious resource deployment, reducing bottlenecks, enhancing productivity, and achieving project goals within set timelines and budgets. Try out our Gantt Chart Template and get started managing your next project today!
Jira for software teams

Trusted by millions of high-performing agile teams, Jira is the leading project management tool for software development. It serves as a central hub throughout the development cycle, enabling effective planning, tracking, and release management.
Jira emphasizes the product backlog , prioritizing tasks from the project roadmap. This ensures high-priority items are at the forefront, enhancing development efficiency.
As an alternative to Gantt charts, teams can select tasks based on capacity using continuous flow ( Kanban ) or structured iterations ( Scrum ), aligning work with capabilities and improving responsiveness. While Gantt charts provide a visual representation of a project timeline with dependencies, Jira’s backlogs and timelines offer dynamic adaptability, accommodating change swiftly.
Jira for business teams
Jira is a valuable solution for diverse business teams, promoting seamless collaboration and efficient project delivery. Tailored for business teams such as marketing, operations, sales, and HR, Jira offers a user-friendly interface. For project planning, Jira uses dynamic calendars instead of traditional Gantt charts. Gantt charts show tasks in a fixed line, making it difficult to change plans. Dynamic calendars make it easy to move tasks around, so teams can adapt more quickly.
With integrations such as Slack, HubSpot, and Google Workspace, Jira is highly customizable, giving business teams flexibility and control in managing their work efficiently.

Plans, available in the Premium edition of Jira , is a powerful tool for planning, tracking, and gaining insights into complex projects, especially for distributed teams.
Unlike traditional Gantt charts, it handles intricate scenarios with multiple teams, projects, and dependencies, offering a high-level view of work across teams.
Custom fields and labels categorize work, enhancing visibility and tracking. It simplifies dynamic planning, adapting to reorganizations or shifting priorities without manual adjustments. Integration with multiple Jira boards, projects, and filters allows customized planning.
It's a versatile and more robust alternative to Gantt charts, providing teams with efficient project management tools and clear progress visibility.
Create Gantt charts with Jira Software
Jira has a robust selection of agile project management features that support the needs of any team, such as dealing with complex timelines. More dynamic and robust than a Gantt chart, Jira makes it easy for teams to organize work, stay aligned, and build better products. Jira Plans , available in the Premium edition of Jira, enhances your planning with data-driven outcome forecasts. For teams seeking further diversification, Jira offers tailored solutions to meet specialized project management needs of business and product teams.
Gantt chart examples: Frequently asked questions
What types of projects are suitable for gantt charts.
Gantt charts are well-suited for various projects, including business plans, product management, and design projects. They offer a visual and organized way to outline tasks, allocate resources, and establish timelines, making them valuable tools for managing various project types effectively.
Can you use Gantt charts for team collaboration?
Yes, Gantt charts are a valuable tool for team collaboration. They provide a clear visual representation of project timelines, tasks, and dependencies, making it easier for team members and stakeholders to coordinate efforts, track progress, and communicate effectively throughout the project's lifecycle.
What software can I use to create Gantt charts?
If you're aiming to create Gantt charts, consider using Jira as your go-to platform. Jira excels in offering features for dependency mapping, team collaboration, and real-time project tracking, making it ideal for handling complex projects. Get started for free with Jira and explore Gantt chart functionalities as well as other planning tools.
Gantt Charts
A Gantt chart is a project management tool that illustrates a project plan. Learn how they can help and see an example of Gantt charts
Get started building an agile workflow
Agile process flows help bring structure to scale your software development process. Learn more about workflow management to support your agile program.

How it works
For Business
Join Mind Tools
Article • 10 min read
Gantt Charts
Planning and scheduling team projects.
By the Mind Tools Content Team
Think about how challenging it would be to juggle a dozen balls at once. You'd have to keep your eye on all of them, and know when to catch each one. If you missed just one, this could spoil your whole performance.
Project management is similar to this. To complete a project successfully, you must control a large number of activities, and ensure that they're completed on schedule. If you miss a deadline or finish a task out of sequence, there could be knock-on effects on the rest of the project. It could deliver late as a result, and cost a lot more. That's why it's helpful to be able to see everything that needs to be done, and know, at a glance, when each activity needs to be completed.
Gantt charts convey this information visually. They outline all of the tasks involved in a project, and their order, shown against a timescale. This gives you an instant overview of a project, its associated tasks, and when these need to be finished.
In this article, we'll look at why they are so useful, and we'll see how you can use them to organize projects and keep your team informed of progress.
The Origins of Gantt Charts
In the late 1800s, Polish engineer Karol Adamiecki developed a visual work flow chart that he called a "harmonogram."
In around 1910, Henry Gantt, a management consultant and engineer, took Adamiecki's concept to the next stage. His chart was designed to help manufacturing supervisors see whether their work was on, ahead of, or behind schedule, and it formed the foundation of the tool we use today.
Why Use Gantt Charts?
When you set up a Gantt chart, you need to think through all of the tasks involved in your project. As part of this process, you'll work out who will be responsible for each task, how long each task will take, and what problems your team may encounter.
This detailed thinking helps you ensure that the schedule is workable, that the right people are assigned to each task, and that you have workarounds for potential problems before you start.
They also help you work out practical aspects of a project, such as the minimum time it will take to deliver, and which tasks need to be completed before others can start. Plus, you can use them to identify the critical path – the sequence of tasks that must individually be completed on time if the whole project is to deliver on time.
Finally, you can use them to keep your team and your sponsors informed of progress. Simply update the chart to show schedule changes and their implications, or use it to communicate that key tasks have been completed.
Creating a Gantt Chart
You can see an example in figure 1, below:
Figure 1 – A Gantt chart

(Click here to expand this diagram.)
To create one for your project, follow these steps, using our example as a guide.
Step 1: Identify Essential Tasks
Gantt charts don't give useful information unless they include all of the activities needed for a project or project phase to be completed.
So, to start, list all of these activities. Use a work breakdown structure if you need to establish what the tasks are. Then, for each task, note its earliest start date and its estimated duration .
Your organization has won a tender to create a new "Software as a Service" product, and you're in charge of the project.
You decide to use a Gantt chart to organize all of the necessary tasks, and to calculate the likely overall timescale for delivery.
You start by listing all of the activities that have to take place, and you estimate how long each task should take to complete. Your list looks as follows:
Step 2: Identify Task Relationships
The chart shows the relationship between the tasks in a project. Some tasks will need to be completed before you can start the next one, and others can't end until preceding ones have ended. For example, if you're creating a brochure, you need to finish the design before you can send it to print.
These dependent activities are called " sequential " or "linear" tasks.
Other tasks will be " parallel " – i.e. they can be done at the same time as other tasks.
You don't have to do these in sequence, but you may sometimes need other tasks to be finished first. So, for example, the design of your brochure could begin before the text has been edited (although you won't be able to finalize the design until the text is perfect.)
Identify which of your project's tasks are parallel, and which are sequential. Where tasks are dependent on others, note down the relationship between them. This will give you a deeper understanding of how to organize your project, and it will help when you start scheduling activities on the chart.
In Gantt charts, there are three main relationships between sequential tasks:
- Finish to Start (FS) – FS tasks can't start before a previous (and related) task is finished. However, they can start later.
- Start to Start (SS) – SS tasks can't start until a preceding task starts. However, they can start later.
- Finish to Finish (FF) – FF tasks can't end before a preceding task ends. However, they can end later.
A fourth type, Start to Finish (SF) , is very rare.
Tasks can be sequential and parallel at the same time – for example, two tasks (B and D) may be dependent on another one (A), and may be completed at the same time. Task B is sequential in that it follows on from A, and it is parallel, with respect to D.
To minimize delivery times, you'll need to do as much work in parallel as you sensibly can. You also need to keep the scope of the project as small as possible.
* P: Parallel, S: Sequential
Step 3: Input Activities Into Software Or a Template
You can draw your charts by hand or use specialist software, such as Gantto , Matchware , or Microsoft Project . Some of these tools are cloud-based, meaning that you and your team can access the document simultaneously, from any location. (This helps a lot when you're discussing, optimizing, and reporting on a project.)
Several Gantt templates have been created for Microsoft Excel , and you can also find free templates with a quick search online.
Figure 2 – Example Gantt chart

Step 4: Chart Progress
As your project moves along, it will evolve. For example, in our scenario, if quality assurance of core modules revealed a problem, then you may need to delay training, and halt development of the management information system until the issue is resolved.
Update your chart to reflect changes as soon as they occur. This will help you to keep your plans, your team, and your sponsors up to date.
Gantt charts are useful for planning and scheduling projects. They help you assess how long a project should take, determine the resources needed, and plan the order in which you'll complete tasks. They're also helpful for managing the dependencies between tasks.
Gantt charts are useful for monitoring a project's progress once it's underway, too. You can immediately see what should have been achieved by a certain date and, if the project is behind schedule, you can take action to bring it back on course.
You've accessed 1 of your 2 free resources.
Get unlimited access
Discover more content
Understanding strategic compensation.
Creating the Right Pay Structure
Animated Video
Managing Expectations With The Project Triangle
Weighing up cost, time and quality
Add comment
Comments (1)
A very convenient service for creating Gantt Diagarm. We have been using the company for 2 years, try it too, you might like it https://ganttpro.com/go/cliqto

Try Mind Tools for FREE
Get unlimited access to all our career-boosting content and member benefits with our 7-day free trial.
Sign-up to our newsletter
Subscribing to the Mind Tools newsletter will keep you up-to-date with our latest updates and newest resources.
Subscribe now
Business Skills
Personal Development
Leadership and Management
Member Extras
Most Popular
Newest Releases

Team Briefings

Onboarding With STEPS
Mind Tools Store
About Mind Tools Content
Discover something new today
New pain points podcast - perfectionism.
Why Am I Such a Perfectionist?
Pain Points Podcast - Building Trust
Developing and Strengthening Trust at Work
How Emotionally Intelligent Are You?
Boosting Your People Skills
Self-Assessment
What's Your Leadership Style?
Learn About the Strengths and Weaknesses of the Way You Like to Lead
Recommended for you
Understanding workplace values.
How to Find People Who Fit Your Organization's Culture
Business Operations and Process Management
Strategy Tools
Customer Service
Business Ethics and Values
Handling Information and Data
Project Management
Knowledge Management
Self-Development and Goal Setting
Time Management
Presentation Skills
Learning Skills
Career Skills
Communication Skills
Negotiation, Persuasion and Influence
Working With Others
Difficult Conversations
Creativity Tools
Self-Management
Work-Life Balance
Stress Management and Wellbeing
Coaching and Mentoring
Change Management
Team Management
Managing Conflict
Delegation and Empowerment
Performance Management
Leadership Skills
Developing Your Team
Talent Management
Problem Solving
Decision Making
Member Podcast
Run and collaborate on creative projects more smoothly.
Plan, manage, and track product launches and campaigns.
Stay organized and communicate critical details to teams.
Streamline and scale manufacturing operations.
See how TeamGantt helps teams like yours meet deadlines, streamline communication.
Successful marketing project starts with a plan.
Track event details and to-dos.
Scope out roadmaps and manage backlogs.
Manage design, copy, and video work.
Learn all about gantt charts and how to use them to manage projects more easily.
Hear real testimonials from real TeamGantt customers.
What Is a Gantt Chart? A How-to Guide with Examples for Project Management
Whether you’re a project management rookie or veteran, you’ve probably heard of a gantt chart. While gantt charts might seem intimidating, they’re not as mystifying as you might think.
In this guide, you’ll learn everything you need to know about the gantt chart—from its definition and parts to how to create one quickly and easily. Find out how gantt charts work and why so many project teams use them in project management.
Watch this video for a quick breakdown of the basics.

What is a gantt chart?: Definition & overview
A gantt chart is a horizontal bar chart used in project management to visually represent a project plan over time. Gantt charts typically show you the timeline and status—as well as who’s responsible—for each task in the project.
Here’s a quick look at the details a gantt chart enables you to capture at a glance:
- How a project breaks down into tasks
- When each task will begin and end
- How long each task will take
- Who’s assigned to each task
- How tasks relate to and depend on each other
- When important meetings, approvals, or deadlines need to happen
- How work is progressing in a project
- The full project schedule from start to finish
In other words, a gantt chart is a super-simple way to communicate what it will take to deliver a project on time and budget. That means it’s a whole lot easier to keep your project team and stakeholders on the same page from the get-go.
Who invented the gantt chart?
The first project management chart was invented by Karol Adamiecki in 1896. So why isn’t it called an Adamiecki chart? Good question!
Although Adamiecki created his precursor to the gantt chart—called the harmonogram—in the late 19th century, he didn’t publish it until 1931. It got limited exposure at the time because it was only published in Polish.
Meanwhile, Henry Gantt published his own project management system in the 1910s to a much wider audience.
Here’s a quick history of gantt charts:
- 1896 : Karol Adamiecki creates the first project management chart: the Harmonogram, a precursor to the modern gantt chart.
- 1931 : Adamiecki publishes the harmonogram (but in Polish with limited exposure).
- 1910-1915 : Henry Gantt publishes his own project management system, the gantt chart.
- Today : Gantt charts are the preferred tool for managing projects of all sizes and types.
Basic components of a gantt chart
Gantt charts may seem complicated at first. But once you learn how to read them, you’ll be able to tell exactly where your projects are and what needs to happen to guide them to success.
Reading a gantt chart really comes down to understanding how the different elements come together to make a gantt chart work. Here’s a simple gantt chart example with explanations of the core components:

Let’s break down the basic parts of a gantt chart so you understand how they function in a project plan.
- Task list : Runs vertically down the left of the gantt chart to describe project work and may be organized into groups and subgroups
- Timeline : Runs horizontally across the top of the gantt chart and shows months, weeks, days, and years
- Dateline : A vertical line that highlights the current date on the gantt chart
- Bars : Horizontal markers on the right side of the gantt chart that represent tasks and show progress, duration, and start and end dates
- Milestones : Yellow diamonds that call out major events, dates, decisions, and deliverables
- Dependencies : Light gray lines that connect tasks that need to happen in a certain order
- Progress : Shows how far along work is and may be indicated by percent complete and/or bar shading
- Resource assigned : Indicates the person or team responsible for completing a task
What is a gantt chart used for in project management?
In project management, gantt charts are used for planning and scheduling projects. A gantt chart is incredibly useful because it allows you to simplify complex projects into an easy-to-follow plan and track the status of tasks as work progresses.
Gantt charts also help you keep track of project deadlines, milestones, and hours worked so you can spot and address delays or overages before they wreak havoc on your project.
Who uses gantt charts?
Gantt charts are used by project managers, business owners, team leaders, and executives in many different industries across various departments. Here are just a few types of companies and teams that use gantt charts to plan, schedule, and execute their projects:
- Construction
- Consulting agencies
- Engineering firms
- Event planning
- Human resources
- Marketing teams
- Manufacturing
- Software development
When should you use a gantt chart?
A gantt chart comes in handy when your project requires more planning than a basic to-do list. Here are a few sure signs you’re going to need a gantt chart to get the job done:
- Your project has a hard deadline.
- Multiple people or teams are involved in the project and need to be coordinated.
- A boss, client, or team member wants to see a visual timeline of the project from beginning to end.
- Your project involves even just a little complexity, such as tasks that need to be done in a specific order.
- Team members work on multiple projects at a time, and you need to manage their workloads.
- You have a good idea of roughly how long each task should or can take.
If ANY of the conditions above apply to your project, use a gantt chart!
Gantt chart examples
Now let’s look at 7 examples of gantt charts you could use for different project types. Use these ideas as an easy starting point for making a gantt chart for your projects.
Software project gantt chart
Taking a hybrid approach to an upcoming software project? This software development plan shows you how to use a gantt chart for an Agile project . Tasks have been organized into groups based on sprints, with milestones for sprint planning and deployment.
Try this template for free!

Design project gantt chart
This sample gantt chart is perfect for planning a website build or redesign. It breaks activities down into basic phases from discovery, content, and design to development, launch, and maintenance. Feel free to keep your website development plan simple or build it out to cover all your project bases.

Media production gantt chart
Want to get one step closer to lights, camera, action? We designed this video production schedule to help you hit your release dates right on time. In this gantt chart example, tasks are organized and color-coded by the 3 phases of a media project: pre-production, production, and post-production.

Marketing gantt charts
Writing your first marketing plan can feel daunting. This digital marketing plan makes it easy to outline key strategies for meeting your objectives. Use this gantt chart to track goal progress and keep your team and stakeholders informed. In this example, we grouped quarterly initiatives by project type.

Need to plan an integrated digital marketing campaign ? The gantt chart sample below shows you how to build a tactical plan across all your digital media. It’s got tasks for foundational planning, content, and design work, plus subgroups for different marketing channels so you can outline a strategy for each one.

Event planning gantt chart
This event plan checklist breaks your event plan down into all the granular details. You can group tasks by planning phase and even vendor. In this example, we’ve used milestones to track important meetings, decisions, and deadlines and added dependencies between tasks that must get done before the next one can start.

Construction gantt chart
Construction project managers rely on gantt charts to manage moving parts across large projects. In this sample construction schedule , each phase of the construction process has been broken down into its own group of tasks. Important contract sign-off and inspections are represented by milestones.

How to make a gantt chart
Now that you’ve got the gantt chart basics down, you’re ready to roll up your sleeves and create a gantt chart of your own! Let’s walk through the process of how to build a gantt chart for your next project.
In this section, we’ll go over:
What you need to create a gantt chart
How to build a basic gantt chart in minutes, best practices for creating an effective gantt chart.
You can’t build a gantt chart without knowing some basic project information. That’s why it’s important to answer a few simple questions first.
These questions can help you gather all the right details so you can sketch out a project plan before you sit down to create your gantt chart. Get a more detailed look at how to write a good project plan.
What to consider when making a gantt chart
- What are the major deliverables?
- How will we get to those deliverables and the deadline ?
- What are the milestones we need to hit?
- Are there dependencies that could impact the project timeline ?
- Who is on the project team, and what role will they play in those deliverables?
There are lots of different ways to make a gantt chart. Some people use traditional desktop apps to create a gantt chart, while others use collaborative project management software .
In this tutorial, we’ll show you how it’s done in TeamGantt. If you’d rather use a spreadsheet to build your gantt chart, we’ve got guides for that too.
- How to make a gantt chart in Excel
- How to make a gantt chart in Google Sheets
Just be sure to choose a gantt chart builder that gives you the features you need.

Follow the steps and examples below to learn how to build a gantt chart in TeamGantt in minutes. Sign up for a free account to follow along and create a gantt chart of your own.
Step 1: Set up your project details
Before you start mapping out tasks on a timeline, you need to gather a few basic project details.
To create a new gantt chart in TeamGantt, click the New Project button in the upper right corner of the My Projects screen.

Give your project a name and start date, and select the days of the week you want to include in your project.

Tip : You have 2 options for fast-tracking your build if you don’t want to create a gantt chart from scratch: create a project from a template or import a project via CSV.
Once you’ve completed these basics, click Create New Project to move on to adding tasks.
Step 2: Add tasks to your project
Adding tasks to your gantt chart is the first step in creating your project timeline. To create tasks, click on the Add Task link ( +Task ), and type the name of your first task.

Hit enter to add another task. Repeat this process until you have all (or most) of your tasks added to the task list.
Step 3: Schedule your tasks
Now that you’ve got a full list of work to be done, it’s time to schedule all those tasks. TeamGantt makes scheduling tasks super-simple because you can drag and drop each task on your timeline.
To place the taskbar on your gantt chart, simply click on the timeline below the date you'd like to schedule your task. Then drag either side of the taskbar to shorten or extend the task's duration.

Step 4: Add important project milestones
Adding milestones to your gantt chart makes it easy to track project deadlines, approvals, meetings, and other key deliverables or events. In TeamGantt, a milestone appears as a yellow diamond on your gantt chart.
To add a milestone to your gantt chart, simply click on the Milestone link, give your new milestone a name, and drag the milestone icon across the gantt chart to schedule it on the timeline.

Repeat this process until you have all your milestones added to the list.
Step 5: Add dependencies to the tasks that need them
Now that your tasks and milestones are entered and scheduled, hover over a task, and click the gray dot that appears.

Click and drag the dependency line to the task you want to link it to.

Step 6: Invite people to your project and assign tasks to those responsible
Click the Invite People button at the upper right corner of your project to go to your project’s People page. From there, click the blue Invite People link, located just below the list of people who are already part of your project.

If the user already exists in your account:
Simply select the checkbox next to the person you want to add to your project, then click the blue Add to Project button that appears. This person will automatically receive an invitation to log into TeamGantt and access the project.

If the user does not exist in your account yet:
Click the Add New Person link. Then enter the person’s name and email address, select their company-level permission , and click the Add User to Company button. (Note: Guest users and Basic users are automatically added with View Only project permission, while Advanced users are added with Edit Chart project permission.)
Feel free to add your own custom notification message, then click Add to Project to finalize the invite. This person will automatically receive an invitation to get set up in TeamGantt and access the project.
Learn more about inviting people to your project in TeamGantt.
Step 7: Apply task colors to enhance visualization on your gantt chart
Color is a great way to make your gantt chart easy to understand at a quick glance.
Hover over a taskbar, and click on the colored square. Choose a new color, and you’re all done!
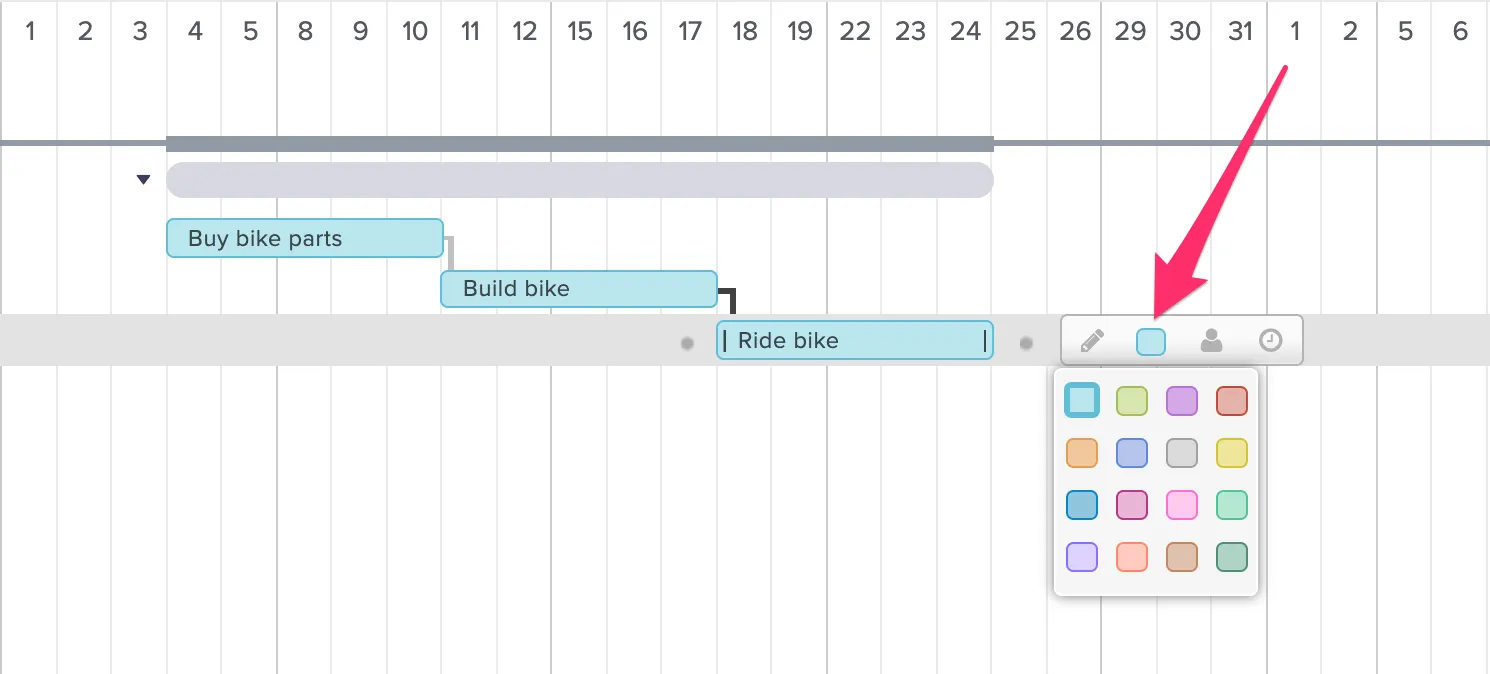
Tip : You can set a default color for each person on your team in TeamGantt. Simply select the People tab at the top of your project, then click none next to each user to assign a default task color. Now, each task you assign to that person will automatically be the color you selected.
If you want to build a gantt chart everyone can use and navigate, there are a few simple rules you should keep in mind. Follow these simple tips and best practices to make a good gantt chart that’s easy to update and manage.
Do get granular with tasks.
The more detail you can spell out when it comes to tasks, the better you’ll be able to track progress and steps leading up to a deliverable. Refer back to your work breakdown structure , and list the steps you used to create that.
Do organize tasks into groups or phases.
Creating groups of tasks will make your plan easier to scan and understand. It’ll also allow your team and stakeholders to see what tasks are part of a deliverable or a phase.
Here’s a quick look at how subgroups work in TeamGantt.
Do add important details and documents to tasks.
Sometimes your team and clients may forget what they committed to. Or maybe they don’t fully understand the intent of a task or group.
Use the notes section of your plan (most gantt chart software should provide this) to spell things out. While you’re at it, be sure to upload key files directly to the task so everything’s ready and waiting for work to begin.
In the project sample below, we added notes about the scope of the task and uploaded a copy of the creative brief for more detail.

Do label tasks by responsible party.
This tip comes in handy for any project, but it’s especially useful for client projects. Identifying which team or company is responsible for each task makes your gantt chart super-easy to scan.
When creating a task, you can assign labels you've set up on the People tab or simply put the company name (or an acronym) in front of the task. Here’s how we tagged tasks in the following gantt chart example:
- PT = Product Team
- GM = Gantt Museum

Of course, you’ll also want to take that a step further and assign each task to the person responsible. This will help you with resource allocation and accountability.
Do display start and end dates for each task
Seems like a silly tip, but it’s easy to hide this info in some apps! If you’re using TeamGantt, you’ll see the dates in the gantt view.
Regardless of what tool you’re using, you want to make it clear not only when a task ends, but when it starts. Again, this will help to keep your team and clients accountable.
Don’t skip dependencies.
If you’re not going to move forward on the project without an approval—or one task must be done before another—now’s your chance to note it.
Not every planning tool offers dependency functionality, and it can be a huge help. As your plan shifts, the flow of the work will stay intact.
Don't assign work without checking team availability.
If you’re lucky enough to use a product that shows you overall team availability, use it! Knowing how booked your team is and what projects they’re part of will play a huge role in delivering work on time and maintaining team morale.
Having an overall view of your team’s availability and conflicting work will help you adjust your plan to either meet the needs of existing project work or shift the milestones you’ve put in your plan.
Here's how to view team availability directly from your gantt chart in TeamGantt.
Don’t overlook holidays and time off.
Now is your chance to block time off in your plan. This is important now because as soon as your timeline shifts (you know it will, don’t fight it), you’ll open yourself up to making an error and dropping a deadline on a date that should be blocked. If you note them in your plan, that won’t happen.
Don’t forget to ask for feedback.
If you deliver a plan that has a mistake, misinterprets a task, or even misses a date, it can create confusion and delays. So grab a teammate and ask them to review your gantt chart before you post it for review.
Of course, you’ll also want to be ready to get some feedback on your plan. Formalizing a plan means you’re taking a set of ideas and expanding on them. That also means you might interpret something differently than a teammate. That’s okay!
Don’t set it and forget it.
A gantt chart is a living, breathing document that should keep up with project changes—not a fixed plan that’s set in stone. Invite your team to collaborate on work and track progress in real time so your gantt chart’s always up-to-date.
How to use gantt charts to manage projects
Now you know how to make a gantt chart to plan and schedule project tasks. But that’s not all they’re designed to do!
Let’s explore some easy ways you can use a gantt chart to manage and track your projects in TeamGantt.
Collaborate with your team and stakeholders
Successful projects run on communication and collaboration. When project files and updates are scattered across different email threads and other platforms, it’s hard to get a good sense of what needs to get done and how close you are to the finish line.
With an online gantt chart , you can streamline communication through a single channel that centers around your project plan.
Here’s how to use a gantt chart to boost collaboration with your team and stakeholders.
Use comments to discuss tasks and share project files
Got a mockup that’s ready for design review? Or need more info to get started on your task? Add a comment to the task, and be sure to tag the person you’re updating so they’ll get automatically notified.
You can also upload documents directly to a task, group, or project. TeamGantt supports version control, so it's easy to find the latest version of any document.
And if you need to share important details up front, that’s what sticky notes are for. For instance, you might want to document how many hours have been scoped for a task or outline specs for a design project.
Watch this video to see team collaboration in action in TeamGantt.
Share your gantt chart with external stakeholders
Need to share project updates with contractors, clients, or other stakeholders? In TeamGantt, you have several options for sharing your gantt chart with external users :
- Invite someone as a guest to your project : Inviting someone as a guest enables them to see and comment on tasks in a single project without making edits to the gantt chart itself.
- Send a view-only link to your gantt chart : This option is great if you want to enable a client or stakeholder to monitor project progress without inviting them to become a user on your account.
- Export your gantt chart as a PDF : This option enables you to filter a gantt chart down to only the information you want to share so clients and stakeholders can get a quick snapshot of the project.
Integrate your gantt chart with other collaboration apps
If your team uses multiple apps to collaborate on projects, why not integrate them with your gantt chart so everything connects back to the plan? Here are a few popular integrations you can use to keep your people and projects in sync:
- Trello : See your cards in a project timeline, create dependencies between cards, and view workloads—all without ever leaving Trello.
- Slack : Create tasks from chats, check your daily task list, and get notified about new comments and assignments right from Slack.
- Dropbox : Share important documents more easily by uploading Dropbox files directly to your tasks and projects.
- Zapier : Automate work and streamline collaboration by connecting TeamGantt to your other favorite apps.
- TeamGantt API : Got a developer on hand? Build custom integrations with your TeamGantt data using our public API!
Manage resources and team workloads
It’s hard to finish any project on time and budget when your team is overloaded and overwhelmed. A gantt chart plots everyone’s work on a visual timeline so you can see how tasks stack up across your projects.
In TeamGantt, you can check and adjust workloads right from your gantt chart to avoid overbooking your team as you schedule new tasks.

Take a closer look at how to use gantt charts for project resource management.
Estimate project time and effort
Assigning hourly estimates to tasks in your gantt chart makes it easier to assess project scope , balance team workloads, and monitor project budget once work gets underway.
TeamGantt’s Advanced plan comes with hourly estimation and time tracking. You can use these features to track and compare estimated vs. actual hours directly from your gantt chart. With that kind of visibility, you can keep a close eye on potential overages and get ahead of issues before they throw your whole project off course.

Estimating hours at the task level also gives you a more granular view of availability when assigning and scheduling work for your team. That way you can feel more confident your team can get the work done without missing deadlines.
Learn more about hourly estimation in TeamGantt.
Track progress against deadlines and estimates
One of the best things about using a gantt chart is the ability to see where a project stands at any given moment. After all, clients, bosses and other project stakeholders expect you to stick to your promises (aka: budgets and deadlines).
That’s why it’s important to monitor tasks to ensure you’re on track to deliver work on time and budget. If things start to go sideways, you can adjust the gantt chart to get things back on track and reset expectations along the way.
Here’s how to track progress and spot issues early in TeamGantt.
Update and monitor progress
Checking things off a list is a pretty satisfying thing to do. What’s even more satisfying is updating the % Complete of a big task and watching the taskbar fill in until it’s 100% done.
Seeing the status of your teammates’ and coworkers’ tasks can be a healthy motivating force too. When you know the up-to-the-minute status of other tasks—especially those tasks that may rely on your tasks—it keeps everyone moving in the right direction.
How to request a progress update in TeamGantt
Need to know where someone stands on a particular task? TeamGantt makes it easy to do a quick status check and remind team members to update their progress.
Here's how it works:
- Click the chat bubble to the left of the task to open the comment window.
- Click Request a progress update at the top of the comment window.
- TeamGantt will send anyone who's assigned to that task an email asking them to update their progress.

Hourly estimate vs. actual progress
TeamGantt’s Advanced plan enables you to compare hourly estimates with actual progress so you can easily spot tasks that are taking longer than expected. Simply look for the thin striped line in the middle of each taskbar on your gantt chart, and pay attention to its color and length.

These indicators signal task trouble:
- The striped line is red : This task (or group) is over-budget. More hours have been tracked than were originally estimated for the task.
- The striped line is longer than the progress indicated for a task : The hours tracked are outpacing actual progress. That means this task (or group) is at risk for going over budget or missing a deadline.
Remember how I said no matter how much planning you do, it’s likely something will come up that requires you to move your timeline? It’s handy to know how much you’ve had to move things over the course of a project. Enter: baselines.
What is a baseline in a gantt chart?
A baseline is a “snapshot” of your project in time. When you create a baseline set, you’re grabbing a picture of your whole project so you have something to compare to when things inevitably shift for one reason or another.
Baselines are extremely important because they give you the “real” picture of shifts that have occurred. It’s easy to think things are looking pretty good, when in reality you’re 3 weeks behind and $10,000 over budget. Things can creep slowly, and without a set of baselines to compare to, it can be easy to get behind and not even fully realize it.
Learn how baselines work in TeamGantt.
Using multiple baseline sets in your gantt chart
A single baseline is great, but a single point doesn’t show trends. Stringing multiple baseline sets together will give you a much clearer picture of when and why your project slipped. Was it due to consistently dragging manufacturing estimates? Or was it that the client was consistently slow in approving designs and signing contracts? Baselines can tell you exactly what you need to know so you can improve your estimating practices.
Baselines aren’t just for showing you the negatives of your project. They’re equally useful for seeing where things have gone better than expected. Just like you have to shift things around when tasks are delayed, you may have to make adjustments when things run ahead of schedule.
As you get better at tracking your project’s slippage, you’ll get better at making realistic estimates on timelines. Once you’ve mastered that skill, you’ll have customers lining up because they know that when you plan a project, they have a timeline they can count on.
How does a gantt chart compare to other alternatives?
Project managers use a variety of tools—from gantt charts and kanban boards to spreadsheets and task lists—to keep up with project details, deadlines, and to-dos.
So what separates gantt charts from the rest of the pack when it comes to time-sensitive or complex projects? Spreadsheets, kanban boards, and task lists fall short when it comes to important project management tasks, like building a timeline, outlining dependencies, and managing workloads.

Without these 3 gantt chart features , you’ll have a tough time communicating the plan to your team, clients, and stakeholders. Here are just a few examples of questions a gantt chart can help you answer:
- Can we take on more work?
- How will we get from point A to point B?
- What needs to happen first?
- Can we meet a requested deadline?
- Who has the bandwidth to tackle these tasks?
- Are we on track to finish on time?
- How are we performing?
The good news is, you can use a gantt chart without foregoing other alternatives. Your team may prefer kanban boards for managing daily tasks or using a spreadsheet to create a RACI chart , and that’s okay.
With TeamGantt, you’ve got choices. View and manage projects as a gantt chart, task list, calendar, or kanban board, and upload important spreadsheets to the project documents. No matter how you look at things, everything ties back to your plan.
Let’s take a closer look at how a gantt chart can help you manage projects better.
Gantt chart pros and cons
What’s to love about gantt charts? And what should you be aware of before diving in? Here’s a quick snapshot of the pros and cons so you can decide if a gantt chart is right for your projects.
What are the pros of using a gantt chart?
A gantt chart is like a front-row seat to the project action. All the tiny details you never noticed from the nosebleed section suddenly come to life in full color right before your very eyes. It’s nearly impossible to miss a game-changing move!
Let’s explore some of the biggest gantt chart pros in project management .
Visualize your entire project
A project plan is one thing. How it plays out is another. A gantt chart gives you a start-to-finish view of your entire project timeline so you can see how tasks are progressing in real time. That means you can provide up-to-the-minute status reports to managers and stakeholders in a flash.

See how tasks are connected
Let’s face it: Things change. Lucky for you, modern gantt charts make it easy to shift tasks around without breaking your stride. With dependencies —a star feature of any gantt chart—you can keep tasks connected even when your timeline gives you the ol’ switcheroo.

Keep everyone on the same page and on time
Clear communication is a must-have in any project. Without it, you risk project delays and cost overruns. Web-based gantt charts, like TeamGantt, ensure no one’s left in the dark. That’s because all your project info and discussion threads live in one central hub that everyone can access, making team collaboration a breeze.

Know who’s busy and who isn’t
If you want to make smart business decisions, you’ve got to have a good grasp on your resources. With gantt charts, resource management is no longer a guessing game. You can see who’s got bandwidth to take on new tasks at a glance.

See a full list of gantt chart benefits.
Do gantt charts have limitations?
Some folks think gantt charts are too complicated to build, read, and update. While traditional desktop apps have their limitations, most of the cons people associate with gantt charts don’t apply to the online gantt chart software you’ll find today.
That’s because modern gantt charts ushered in a whole new era of project management. Now gantt charts offer clean and simple design with drag and drop scheduling so you can build and adjust project plans in an instant. And because everything happens online, it’s easy to share plans, collaborate on work, update tasks, and track progress in real time.
Let's look at how modern gantt charts compare to traditional desktop apps.
Modern gantt charts vs. desktop apps
Gantt charts come in many forms—from good old-fashioned paper to desktop apps and even web-based software.
Bringing gantt charts online transforms them from a static document that quickly becomes obsolete to a living, collaborative representation of a project’s current state. Team members can update their progress in real time, and stakeholders can check in on project status without having to go through you. Plus, it's easy to stay in sync and push projects across the finish line more quickly.
See how TeamGantt’s modern gantt chart tool compares to 2 popular desktop apps:
- TeamGantt vs. Microsoft Excel
- TeamGantt vs. Microsoft Project
Advanced features to look for in a modern gantt chart
A good modern gantt chart should be a part of a complete project management solution. Look for these advanced gantt chart software features to ensure your team and projects stay on track:
- Team collaboration
- Multiple project views, including kanban boards, task lists, and calendar views
- Time tracking and hourly estimation
- Workload management
- Mobile access
- Integrations
TeamGantt has all of this! Try it for free.
Continue learning about gantt charts
Now that you know how to make a gantt chart, you’re ready to move on to the next step! Keep reading to learn how to use your gantt chart to manage your team's time and availability more easily.
Plan your next project in minutes
When you’re a project manager, every minute counts. So why waste time building out a bunch of complicated spreadsheets just to keep tabs on a project?
At TeamGantt, you don’t have to. Our free online gantt chart software enables you to stay focused on the tasks that move the needle. Whip up a project plan in minutes, and watch your team cross the finish line faster. It really is that simple.
Try TeamGantt for Free
Creating awesome Gantt charts for your PhD timeline

It’s a common scenario: you have never heard about Gantt charts. Then, when writing a PhD application or planning your PhD timeline for the upcoming years, someone suggests: You should include a Gantt chart! No need to worry. Here is all you need to know about Gantt charts for your PhD timeline.
What are Gantt charts?
Why are gantt charts frequently used for phd timelines, what information is included in gantt charts for phd timelines, creating a phd timeline gantt chart in microsoft excel, creating a phd timeline gantt chart in microsoft powerpoint, creating a phd timeline gantt chart in a microsoft word, creating a phd timeline gantt chart with an online tool, best gantt chart template for phd timelines in microsoft excel, best gantt chart template for phd timelines in microsoft powerpoint, best gantt chart template for phd timelines in microsoft word, gantt chart phd timeline example in microsoft excel, gantt chart phd timeline example in microsoft powerpoint, gantt chart phd timeline example in microsoft word.
A Gantt chart is a visual representation of a project schedule and a widely used tool in project management.
Gantt charts belong to the family of bar charts. In a Gantt chart, bars depict different project tasks. The length of each bar is proportionate to the task duration and indicates both start and finish dates.
Gantt charts are named after Henry Gantt. He lived from 1861-1919 and developed these types of charts as part of his work as a management consultant.
A Grantt chart is a great way to provide an overview of project tasks, activities and milestones.
Gantt charts are frequently used to illustrate PhD timelines because doing a PhD essentially means creating, managing and implementing a project with many components over several years.
Therefore, Gantt charts are popular tools among (aspiring) PhD students.
They are often featured in PhD proposals: Through visual representations, Gantt charts help communicate milestones, plans and estimated task durations.
Furthermore, Gantt chart PhD timelines allow PhD students to track their progress. They can also help PhD students to stay on track with their work.
You may also like: How to develop an awesome PhD timeline step-by-step
Gantt charts can include all kind of information, based on the specific project they are focusing on. When it comes to Gantt chart PhD timelines, there are several elements that are commonly featured:
- Extensive PhD proposal/plan
- Data collection
- Experiments
- Data analysis
- Writing plan
- Publications
- Conferences
- Courses/Coursework
Of course, every PhD project is unique. This uniqueness should be reflected in your Gantt chart. For instance, your Gantt chart PhD timeline will look different if you write a PhD based on articles or if you write a monograph .
For a PhD based on published articles, different bars in a Gantt chart PhD timeline could for example represent individual papers. For a monograph, it may be smarter to focus on research stages.
How do you create a Gantt chart for your PhD timeline?
Unfortunately, creating a Gantt chart in Microsoft Excel is far from straightforward as Excel does not provide its own Gantt chart template.
You can create a table, turn it into a bar chart and manually edit it until it looks like a Gantt chart. If you have some experience with Excel, it is doable. Detailed instructions on the process can be found in this manual from Ablebits.com.
However, why go through all the hassle when you can simply download a template? You can use Microsoft’s own free Gantt project planner template and adjust it to your PhD project.
Manually creating a PhD timeline Gantt chart in PowerPoint is a bit easier than in Excel. Therefore, I will explain the process here.
First, you need to open a blank PowerPoint slide. Then click on Insert (1.), then Chart (2.). A popup will appear. Select Bar (3.) and finally select the Stacked Bar option (4).
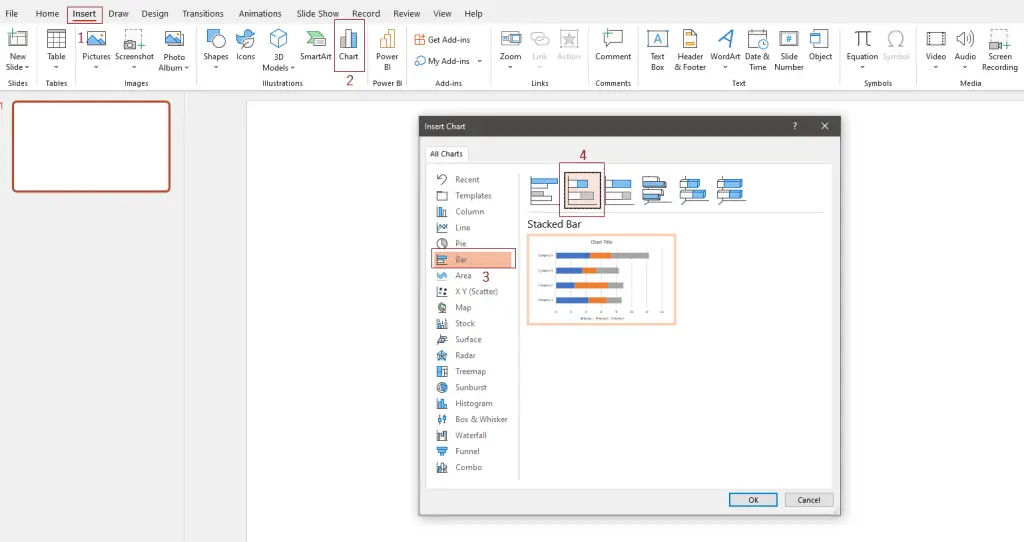
A standard bar chart will appear on your slide and a small Excel table with open next to it. The first column in the Excel table is called Categories . You can replace categories with the PhD tasks that you want to display. For instance, Literature Review, Interviews, Transcribing and Analysis. You can add more categories or delete existing ones by removing a row in the small Excel table.
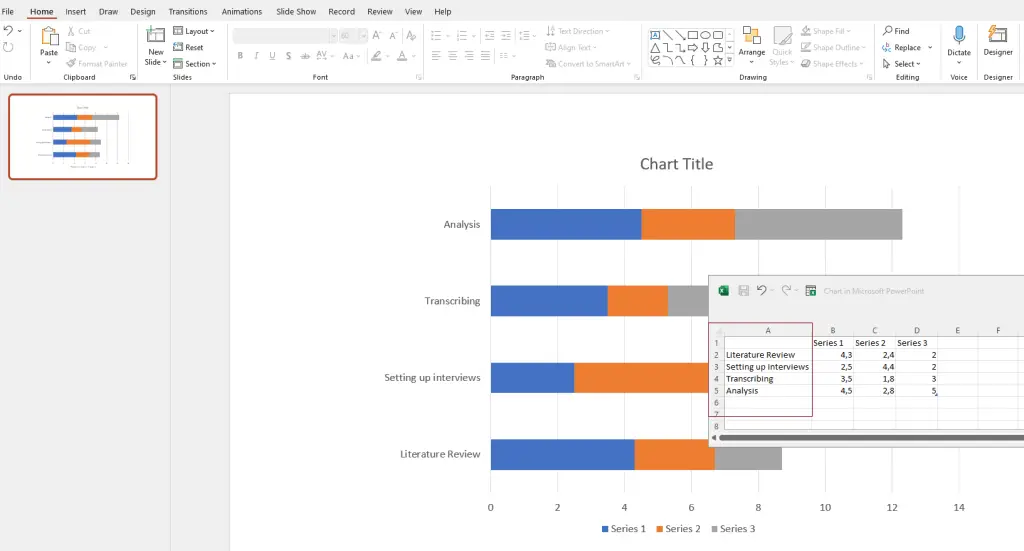
Next to the Categories (now tasks) column, you see three more columns: Series 1 , Series 2 , Series 3 . You can use these columns to showcase the length of tasks. Rename Series 1 into Start Date and Series 2 into End Date . Series 3 indicates the overall length. Depending on the timeframe you want to showcase, you can opt for instance for Length (weeks) or Length (months) .
In the example below, I decided to plan PhD tasks for a year. Thus, 1 means January, 2 means February, 3 means March and so forth. The length of tasks is also indicated in months:
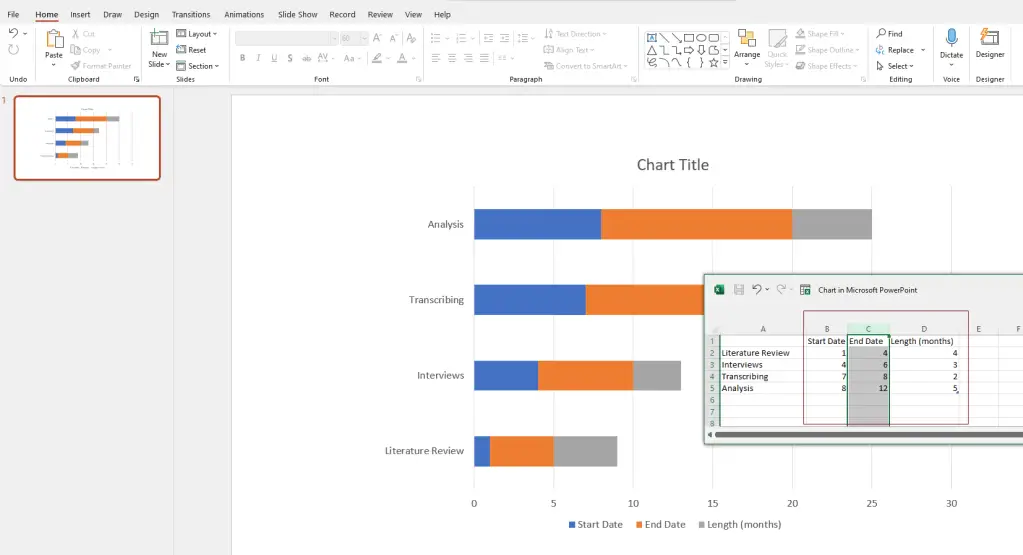
Next, click on your chart and three icons will appear in the upper-right corner next to it. Click on the bottom one, the Chart filters , remove the tick of the check box of End Date , and click on Apply. You will see that the bar chart will start to look like a Gantt chart:
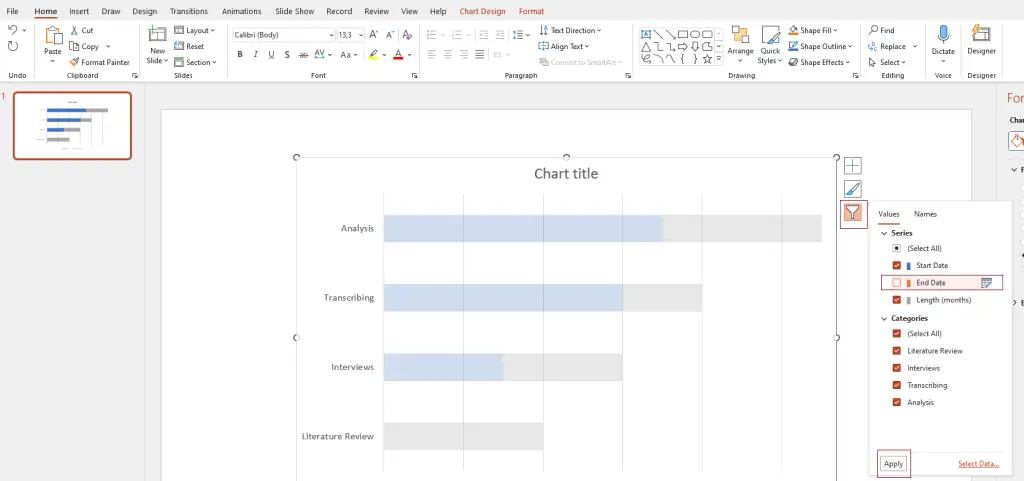
Now, the blue parts of the bar, indicating the Start Dates, need to be removed. Just click on one of them, and on the righthand side, Format Data Series should appear. Select No fill. Alternatively, in the upper menu, select Format , go to Shape fill, and select No fill .
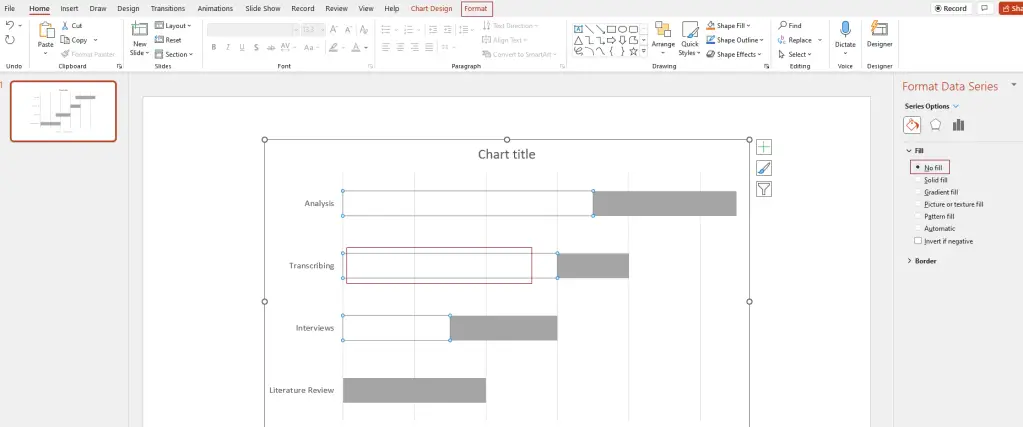
Now comes the fun part, namely decorating. You can add a chart title, colour the bars in the colour of your choice, edit the legend and the axis descriptions. Just play with it to explore the options.
One more thing I did was changing the value of the axis, because I want to illustrate the months of a year. Thus, it was a bit weird that the horizontal axis started with 0 and ended with 13 while I needed 1-12 to indicate each month of a year. You can simply change this by clicking on the axis. On the righthand side, Format Axis will appear. Go to Axis Options , Bounds , and enter 1 for Minimum and 12 for Maximum .
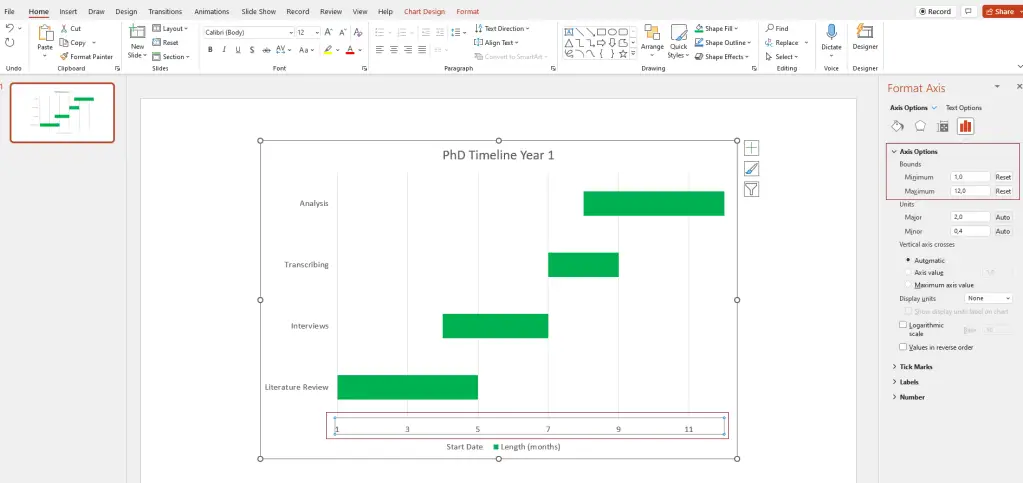
And voila! Your Gantt chart is ready.
The nice thing about learning how to create a Gantt chart in Microsoft PowerPoint is that you basically teaches you how to create one in a Word file as well! The process is very similar.
To start the process in Word, it is smart to first change the orientation of your page to Landscape . In the top menu, click on Layout , then select Orientation , then choose Landscape .
Next, select Insert , then Chart , and select a Stacked Bar chart again.
A basic bar chart will appear on your page:
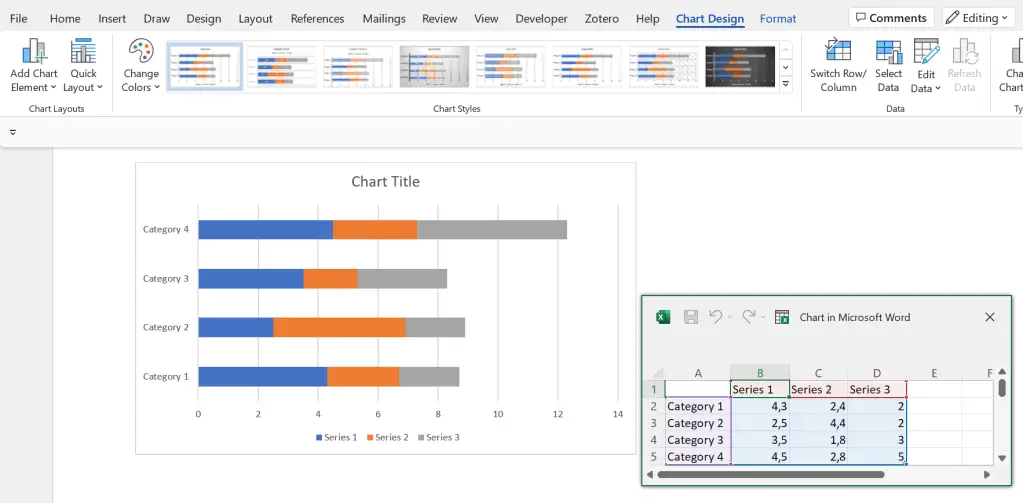
Looks familiar? Yes! From here, it is basically the same process as editing the bar chart in PowerPoint.
If you don’t want to go through the hassle of creating your own Gantt chart but are not convinced by any templates, you can make use of online tools and software.
There are some paid providers out there, but in my opinion, it is not worth paying to create an awesome PhD timeline.
You can use a free provider (or make do with one of the many Gantt chart templates that exist on the internet). One free online tool is the Free Online Gantt Chart Software :
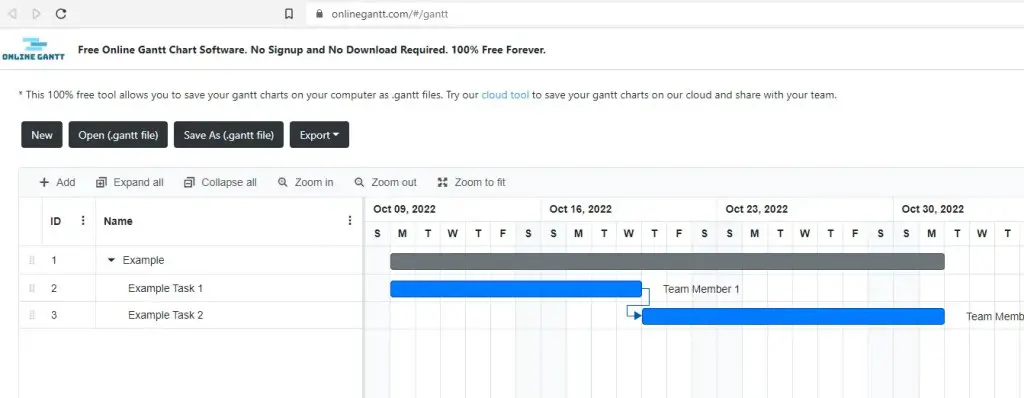
The site requires no signup. You can editing and simply start filling in the Gantt chart, and export it as an Excel, Image or PDF file when you are done!
PhD timeline Gantt chart templates
A great way to create a detailed Gantt chart in Microsoft Excel is by using Microsoft’s free Gantt project planner template . The level of detail and functionality exceeds those of simple, manually created Gantt charts. This makes this type of Gantt chart especially useful to track detailed PhD progress.
A useful Gantt chart template for PhD timelines in PowerPoint can be downloaded here via OfficeTimeline.com This Gantt chart is particularly great to provide a rough overview of plans over a longer period. For instance, with a few edits, you can illustrate a nice 3-year PhD timeline.
Useful Gantt chart templates for Microsoft Word can be downloaded here from TemplateLAB. I like these templates as they can be easily adjusted to the needs of a PhD timeline. For instance, a weekly Gantt chart template can be useful to establish a detailed plan with weekly objectives to keep your PhD progress on track.
PhD timeline Gantt chart examples
Using the template provided by Microsoft above, an example PhD timeline to track regular progress on tasks could look, for instance, like this:
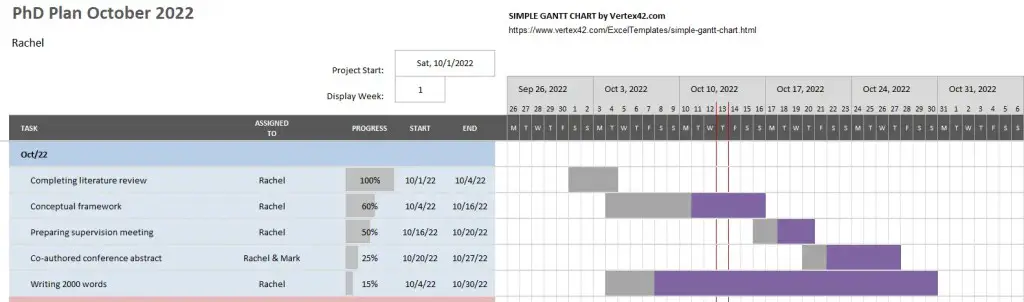
Using the Gantt chart PowerPoint template by OfficeTimeline.com above, an example PhD timeline to present a plan for a 3 year PhD could look, for instance, like this:
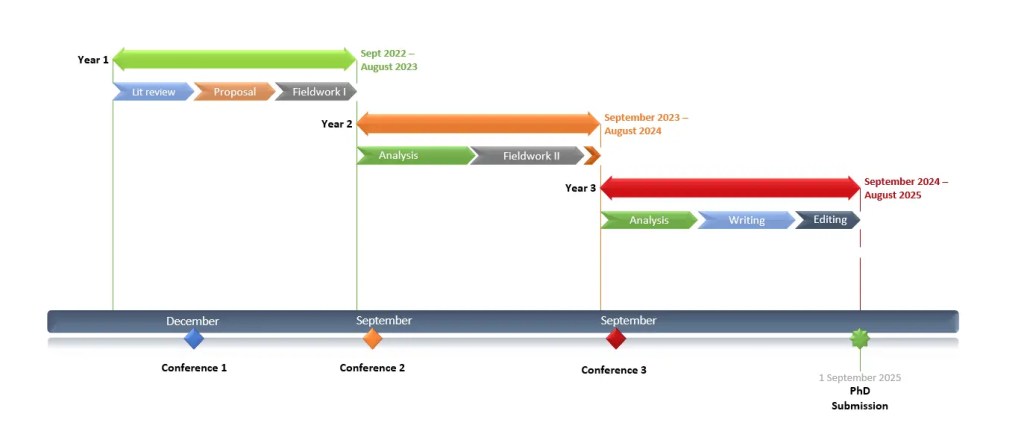
Using a weekly Gantt chart template from TemplateLab mentioned above, an example PhD timeline with weekly tasks and objectives could look, for instance, like this:
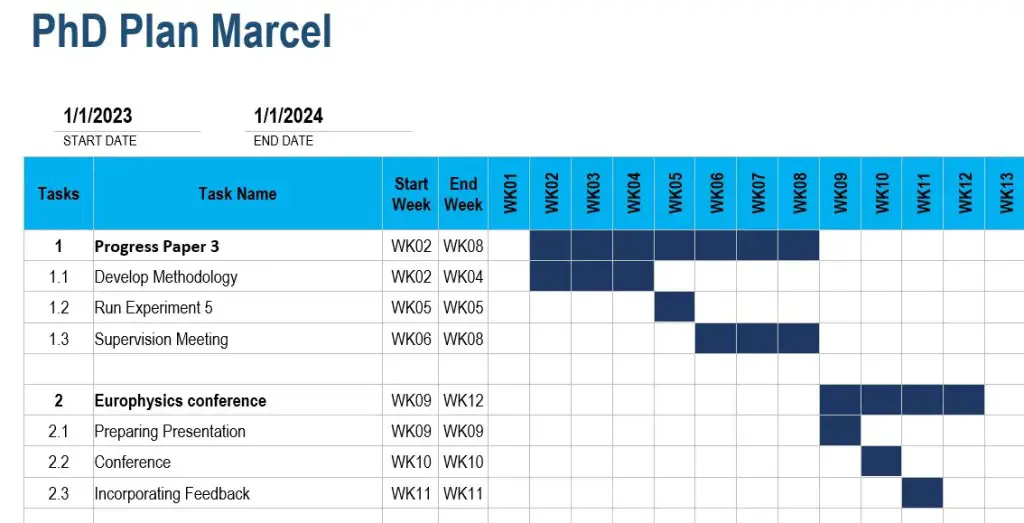
Get new content delivered directly to your inbox!
Subscribe and receive Master Academia's quarterly newsletter.
10 reasons NOT to do a master's degree
9 smart questions to ask a professor about graduate school, related articles.

Reviewer comments: examples for common peer review decisions

Types of editorial decisions after peer review (+ how to react)

Public speaking in academia and how to practice it

Reject decisions: Sample peer review comments and examples
How to Prepare a PhD Research Plan/Schedule?
PhD research plan is a structured schedule for completing different objectives and milestones during a given timeframe. Scholars are usually unaware of it. Let us find out how to prepare it.
Between March 2021 to 2022, I read almost 15 different research proposals from students (for their projects) and only a single one, I found, with a comprehensive research plan for 3 years. Which is still not, kind of practical, probably copied from other students.
Such entities are not known to over 90% of students, if some know that because their university asked for but unfortunately, this basic procedure lacks penetration among students. I don’t know the exact reason, but students lack a basic understanding of the research process.
Meaning, that they don’t know or perhaps don’t complete their course work needly. PhD research requires many documents, SOPs and write-ups, before even starting it. For example, a rough research plan, research proposal, initial interview, competence screening, grant proposal and so on.
However, the requirement varies among universities and thus knowledge regarding basic procedures often also varies among students. So I’m not blaming students but certainly, it is the fault of the university side, as well.
When you come up with a research proposal with a research schedule or entire plant, certainly it will create a positive image and good reputation. So it is important. But how to prepare it?
Hey, there I’m Dr Tushar, a PhD tutor and coach. In this article, we will understand how we can prepare a structured plan for the PhD research and how to execute it.
So let’s get started.
How to prepare a PhD research plan/schedule?
A PhD research plan or schedule can be prepared using the GANTT chart which includes a month, semester or year-wise planning of the entire PhD research work.
First, enlist goals and objectives.
It’s not about your research objective enlisted in your proposal. I’m talking about the objectives of your PhD. Take a look at some of the objectives.
Note that these are all the objectives that should be completed during the PhD, but not limited to a specific subject. Note you have to show how you can complete or achieve each objective during the entire tenure of your work.
And that is what the plan/schedule is all about. Next, explain the time duration. The time required to complete each goal, roughly. For example, a semester or a year to complete the course work or 4 to 8 months for completion of ethical approval.
Now two things must be known to you, at this point in time.
- First, enlist the time required to complete each objective, as aforementioned.
- Second, what goals would you complete during each semester?
For instance, course work takes a semester to complete, but during the period a scholar can also craft their PhD research title, research proposal, ethical approval and grant proposals.
Now it is also crucial to know that there is no time bound to complete goals, but it should be completed as you explained. Let’s say you can plant it for 3 years, 4 or even 5 years depending on the weightage of your work.
In summary, the answer to the question of how to prepare a research plan is,
- Enlist your goals or objectives.
- Decide the time required to complete each goal.
- Prepare a GANTT chart.
Now you have prepared zero-date planning for your research but how to present it? The answer is a GANTT chart.
GANTT chart for PhD research plan:
GANTT chart is a task manager and graphical presentation of how and how many tasks are completed or should be completed against a given time duration. Take a look at the image below.

How can you prepare one?
Open MS Excel (on Windows) or numbers (on Mac).
Enlist goals or objectives in a column.
Enlist years (duration of PhD) in a row and bifurcate them into individual semesters. You can also prepare a month-wise plan, that’s totally up to you. In my opinion, semester-wise planning is good because research is a lengthy and time-consuming process. So monthly planning would not work.
To make a chart more attractive and readable use colors, as I used. Now mark a ‘cell’ against a column and row showing the objective which you are going to complete in a semester. Take a look.
After the end of this, your GANTT chart would look like this.

You can prepare a month-wise planning, individual semester-wise planning and goal-wise planning etc. I will explain these things in upcoming articles on 5 different types of GANTT charts for PhD.
Custom writing services:
If you find difficulties in preparing a research plan, synopsis, proposal or GANTT chart. We can work on behalf of you. Our costume services are,
- Synopsis writing
- Project writing
- Research proposal writing
- Research planning and GANTT chart preparation.
You can contact us at [email protected] or [email protected] to get more information.
Wrapping up:
Planning and executing a research schedule are two different things. Oftentimes, students just prepare as per the requirements and then do work as per their convenience. Then they are stuck in one place and just work around the time.
Plan things. Make your own GANTT chart, put it on your work table or stick it on a wall so that you can see it daily. Try to achieve each goal in time. Trust me things will work and you will complete your PhD before anyone else.

Dr. Tushar Chauhan is a Scientist, Blogger and Scientific-writer. He has completed PhD in Genetics. Dr. Chauhan is a PhD coach and tutor.
Share this:

- Share on Facebook
- Share on Twitter
- Share on Pinterest
- Share on Linkedin
- Share via Email
About The Author
Dr Tushar Chauhan
Related posts.

Why is it called a Doctor of Philosophy?

Preparing for a PhD Viva
Leave a comment cancel reply.
Your email address will not be published. Required fields are marked *
Save my name, email, and website in this browser for the next time I comment.
Notify me of follow-up comments by email.
Notify me of new posts by email.
All Formats
Table of Contents
Free 10+ research gantt chart templates in pdf | ms word, 1. research project gantt chart, 2. research centre gannt chart, 3. masters research proposal gantt chart, 4. research proposal gantt chart, 5. research framework gantt chart, 6. managing research project gantt charts, 7. operational research gantt chart, 8. research gantt chart for students, 9. research implementation gannt chart, 10. recruitment research gannt chart, 11. research phase gantt chart, 5 steps to create the research gantt chart, what are the purpose of the research gantt chart, what are the examples of the research gantt chart, how does the research gantt chart works, what are the drawbacks of the research gantt chart.
- Graphic Design
The Research Gantt Chart is utilised to represent the project schedule that involves the duration of the individual tasks, the stages and its depencies and ordering. It keeps up the process of the planning by calculating its duration, the identification of resources, and lays out the order in which the research work need to be completed. It calculates the starting and the end point of the completion of project.

Step 1: Two methods used in creating gantt chart
Step 2: mention research’s start and end line, step 3: gathering all the information, step 4: evaluating activities depending on other, step 5: create graph including timeline and list, more in charts, research project gantt chart template, marketing gantt chart template, nursing research gantt chart template, marketing research gantt chart template, research proposal gantt chart template, qualitative research proposal gantt chart template, research process gantt chart template, medical research gantt chart template, research proposal timeline gantt chart template, research report gantt chart template.
- 15+ Recruitment Process Flowchart Templates in PDF | MS Word
- 8+ Logistics Process Flow Chart Templates in PDF
- 4+ Logistics Flow Chart Templates in PDF | MS Word
- 16+ Simple Flow Chart Templates in Word
- 14+ Medication Chart Template – Sample, Example, Format Download!
- 10+ Business Succession Plan Templates in Google Docs | Word | Pages | PDF
- 50+ Flow Chart Templates
- 9+ Offboarding Workflow Templates in PDF | Word | Pages | Google Docs
- 10+ Onboarding Process Templates in Excel | Word | Numbers | Pages | PDF | Google Docs
- 21+ Printable Shoe Size Chart Templates
- 26+ Blank Guitar Chord Charts
- 10+ Revenue Recognition Templates in Google Docs | Google Sheets | PDF | Numbers | Pages | Word | Excel
- 10+ Business Liability Insurance Templates in Google Docs | Word | Pages | PDF
- 9+ Revenue Model Templates in Google Docs | Google Sheets | Word | Excel | Numbers | Pages | PDF
- Blood Pressure Chart Template – 36+ Free Word, Excel, PDF Format Download!
File Formats
Word templates, google docs templates, excel templates, powerpoint templates, google sheets templates, google slides templates, pdf templates, publisher templates, psd templates, indesign templates, illustrator templates, pages templates, keynote templates, numbers templates, outlook templates.
Library Guides
Dissertations 1: getting started: planning.
- Starting Your Dissertation
- Choosing A Topic and Researching
- Devising An Approach/Method
- Thinking Of A Title
- Writing A Proposal
Planning Your Time
The dissertation is a large project, so it needs careful planning. To organise your time, you can try the following:
Break down the dissertation into smaller stages to complete (e.g., literature search, read materials, data collection, write literature review section…).
Create a schedule. Working backwards from your deadline, decide when you will complete each stage.
Set aside time to regularly work on the dissertation.
Consider what times of day you are most alert and what makes a suitable space to study.
Identify a specific task to work on.
If overwhelmed, try to identify one task that needs doing rather than focusing on the larger project.
Leave time to redraft, proof-read, format, and complete the reference list.
Gantt Charts
As the dissertation project involves certain processes to take place simultaneously, rather than in a sequence, you can use a Gantt chart to organise your time.
A Gantt chart is a bar chart which shows the schedule for a project. The project is broken down into key tasks/elements to be completed. A start and finish date for each task/element of the project is given. Some tasks are scheduled at the same time or may overlap. Others will start when a task has been completed.
To produce a Gantt chart, you can use Word, Excel (see example in the attachment) or an online planner.
- Tom's Planner . There's an example for you to use to complete your plan.
- Excel: example of Gantt Chart in Excel . This is an example of a Gantt chart which can be used to generate a plan of work (timeline) for your dissertation. You can download and edit it as you please. The chart has been created by the University of Leicester.

Research Data Management
This video helps you to understand the importance of research data management and how you can plan, organise, store, preserve, and share your data.
- Link to video on Research Data Management
- Feedback Form Please give us feedback on our videos!
- << Previous: Thinking Of A Title
- Next: Writing A Proposal >>
- Last Updated: Aug 1, 2023 2:36 PM
- URL: https://libguides.westminster.ac.uk/starting-your-dissertation
CONNECT WITH US
How to Create and Use a Gantt Chart for PhD Studies

A Gantt chart is a common tool used in the project management field. It is used for schedule planning of a project and its tasks and activities. It shows the tasks, their start and end dates, and the duration needed to complete them.
A PhD is a project and may last from as few as three years to as long as six years depending on the university and department a student is enrolled in.
In order to successfully complete a PhD program, one needs to plan when each of the tasks will be completed from the word go. A Gantt chart is very useful in doing this.
A PhD student can create one comprehensive Gantt chart or several smaller Gantt charts for each of the major deliverables.
This article discusses a Gantt chart for a general PhD program that has both coursework and dissertation components.
Benefits of a Gantt chart for planning PhD studies
Steps involved in creating a gantt chart for phd studies, how to effectively use the phd gantt chart, final thoughts on the phd gantt chart.
Creating a Gantt chart at the beginning of PhD studies has the following benefits:
- It is easy to create. A student can use the traditional pen-and-paper method or existing digital tools or softwares to create a Gantt chart.
- It is easy to read. The visual presentation of the Gantt chart makes it easy for the student to read and know what is expected of him at any point in time.
- A Gantt chart makes it easy to monitor progress of PhD studies. The user can choose to use different colors for tasks that have already been completed, tasks that are close to completion, and tasks that require more time and effort to complete.
- It forms the basis for monthly, weekly, and daily planning of the PhD studies. Depending on how detailed a student wants to go in terms of planning, the Gantt chart comes in handy when writing out the monthly, weekly and even daily plans.
Step 1: List all the deliverables expected of your PhD program. In this example, the PhD program has the following requirements:
- Coursework, divided into 4 modules each lasting 2 weeks. All 4 modules need to be completed within the first year of study.
- A comprehensive written exam at the end of the fourth module.
- An oral exam once a student passes the written exam.
- Submission of a concept note.
- Submission of a research proposal once a student passes the oral exam.
- Writing a business management case study.
- Three journal papers.
- At least two conference papers.
- A dissertation.
Step 2: For each of the requirements listed above, note the start and end dates. For the above example, the PhD program lasts a minimum of 3 years and a maximum of 6 years. Assuming the minimum of 3 years (beginning January 2021), the activities’ start and end dates are as follows:
Step 3: Using the above information, create the Gantt chart using Microsoft Word, Powerpoint or Excel.
The following are useful resources for creating a Gantt chart using:
- Microsoft Powerpoint: https://www.youtube.com/watch?v=wp0vr6OkW8Y
- Microsoft Excel: https://www.youtube.com/watch?v=00s5efQWrgU&t=10s
- Microsoft Word: https://www.youtube.com/watch?v=F90RdA5X4G0
The Gantt chart created from the above data is shown below. The chart was created using Microsoft Powerpoint.

Step 4: Once the Gantt chart is complete, print it out and hang it on the wall of your study room/area. This serves as a constant reminder of the tasks that need to be done at any point in time, as well as of the progress that has been made so far.
The greatest strength in using the Gantt chart for PhD studies lies in its ability to help one plan ahead. Using the Gantt chart above as an example, the user can plan as follows:
- At the beginning of every month, look at what is required of you. For instance, the student above needs to complete module one of the coursework and at the same time start working on proposal writing.
The student can plan for module one in advance by going through the course structure and expected readings, and reading in advance before the start of the module so that he is able to follow and understand what is being taught. If there are pre- and post-module exams, the student can also prepare for them in advance.
Preliminary tasks for proposal writing can include: discussing your proposed topic with your supervisor, and searching for and quick review of literature to identify the gap that your topic will be addressing. All these can be done in the first month before the actual proposal writing starts.
- The Gantt chart can help you identify the skills that are required for the successful completion of your dissertation. For instance, the student above is expected to write a Business Management case study by June of year 2.
If the student does not have case study writing skills, he can start looking for courses that teach case study writing and complete them way before the deadline for the case study. Same case for skills such as preparing and writing a journal paper, writing a conference paper, data analysis using softwares such as Stata, SPSS, NVivo etc.
- The Gantt chart can help you plan for academic-related events such as conferences.
In the example provided above, the student is expected to attend two scientific conferences (in November of year 2 and March of year 3) and make presentations.
The student can start looking for conferences related to his field that are held during the proposed times and mark the key dates and requirements of the conferences (for instance, abstract submission deadlines, abstract submission guidelines, registration deadlines etc).
- The Gantt chart can help you create monthly and weekly plans for longer tasks such as proposal writing.
In the above sample Gantt chart, proposal writing and defense spans a period of 15 months. By March of the second year, the student is expected to defend his proposal. This may seem like such a long period of time but in reality it is not. This is because it is not the only task that the student will undertake during this period. As a result, it is easier to focus on the tasks at hand and forget about the tasks that seem to have adequate time.
Proposal writing is a daunting task and requires constant reading and updating. To ensure that the student submits his proposal in time, he can create monthly and weekly plans for the task. An example of monthly planning for the proposal writing is provided in the table below:
The monthly plan is based on assumptions, for instance, that the supervisor will review the document within the scheduled timeframe. This may or may not hold, depending on the supervisor.
It is therefore important to allow ample time for such factors that are out of your own control in order to ensure that the task is completed by the deadline.
The monthly plans can further be broken down into weekly (and even daily) plans, for instance:
- Number of papers to read per week (day).
- Number of words to write per week (day).
- How many citations and bibliographies to insert (update) every week (day).
- Number of additional articles to search and add to your library each week etc.
Each of these tasks contributes to the overall proposal writing and make the task completion easier and faster than waiting for the last few months to do it all at once.
A PhD is a medium- to long-term project depending on how long it takes to finish. It therefore requires effective and careful planning from the start of the program to ensure that each deliverable is completed within the stipulated time. The Gantt chart is an easy-to-create, and easy-to-use planning tool that can be used by all PhD students. Not only does it save the student time but it also gives him peace of mind knowing the progress of each and every task required.
Grace Njeri-Otieno
Grace Njeri-Otieno is a Kenyan, a wife, a mom, and currently a PhD student, among many other balls she juggles. She holds a Bachelors' and Masters' degrees in Economics and has more than 7 years' experience with an INGO. She was inspired to start this site so as to share the lessons learned throughout her PhD journey with other PhD students. Her vision for this site is "to become a go-to resource center for PhD students in all their spheres of learning."
Recent Content
SPSS Tutorial #12: Partial Correlation Analysis in SPSS
Partial correlation is almost similar to Pearson product-moment correlation only that it accounts for the influence of another variable, which is thought to be correlated with the two variables of...
SPSS Tutorial #11: Correlation Analysis in SPSS
In this post, I discuss what correlation is, the two most common types of correlation statistics used (Pearson and Spearman), and how to conduct correlation analysis in SPSS. What is correlation...

An official website of the United States government
The .gov means it’s official. Federal government websites often end in .gov or .mil. Before sharing sensitive information, make sure you’re on a federal government site.
The site is secure. The https:// ensures that you are connecting to the official website and that any information you provide is encrypted and transmitted securely.
- Publications
- Account settings
Preview improvements coming to the PMC website in October 2024. Learn More or Try it out now .
- Advanced Search
- Journal List
- v.20; 2019 Oct 25
Managing Ideas, People, and Projects: Organizational Tools and Strategies for Researchers
Samuel pascal levin.
1 Beverly, MA 01915, USA
Michael Levin
2 Allen Discovery Center at Tufts University, Suite 4600, 200 Boston Avenue, Medford, MA 02155-4243, USA
Primary Investigators at all levels of their career face a range of challenges related to optimizing their activity within the constraints of deadlines and productive research. These range from enhancing creative thought and keeping track of ideas to organizing and prioritizing the activity of the members of the group. Numerous tools now exist that facilitate the storage and retrieval of information necessary for running a laboratory to advance specific project goals within associated timelines. Here we discuss strategies and tools/software that, together or individually, can be used as is or adapted to any size scientific laboratory. Specific software products, suggested use cases, and examples are shown across the life cycle from idea to publication. Strategies for managing the organization of, and access to, digital information and planning structures can greatly facilitate the efficiency and impact of an active scientific enterprise. The principles and workflow described here are applicable to many different fields.
Graphical Abstract

Information Systems; Knowledge Management
Introduction
Researchers, at all stages of their careers, are facing an ever-increasing deluge of information and deadlines. Additional difficulties arise when one is the Principal Investigator (PI) of those researchers: as group size and scope of inquiry increases, the challenges of managing people and projects and the interlocking timelines, finances, and information pertaining to those projects present a continuous challenge. In the immediate term, there are experiments to do, papers and grants to write, and presentations to construct, in addition to teaching and departmental duties. At the same time, however, the PI must make strategic decisions that will impact the future direction(s) of the laboratory and its personnel. The integration of deep creative thought together with the practical steps of implementing a research plan and running a laboratory on a day-to-day basis is one of the great challenges of the modern scientific enterprise. Especially difficult is the fact that attention needs to span many orders of scale, from decisions about which problems should be pursued by the group in the coming years and how to tackle those problems to putting out regular “fires” associated with the minutiae of managing people and limited resources toward the committed goals.
The planning of changes in research emphasis, hiring, grant-writing, etc. likewise occur over several different timescales. The optimization of resources and talent toward impactful goals requires the ability to organize, store, and rapidly access information that is integrated with project planning structures. Interestingly, unlike other fields such as business, there are few well-known, generally accepted guidelines for best practices available to researchers. Here we lay out a conceptual taxonomy of the life cycle of a project, from brainstorming ideas through to a final deliverable product. We recommend methods and software/tools to facilitate management of concurrent research activities across the timeline. The goal is to optimize the organization, storage, and access to the necessary information in each phase, and, crucially, to facilitate the interconnections between static information, action plans, and work product across all phases. We believe that the earlier in the career of a researcher such tools are implemented and customized, the more positive impact they will exert on the productivity of their enterprise.
This overview is intended for anyone who is conducting research or academic scholarship. It consists of a number of strategies and software recommendations that can be used together or independently (adapted to suit a given individual's or group's needs). Some of the specific software packages mentioned are only usable on Apple devices, but similar counterparts exist in the Windows and Linux ecosystems; these are indicated in Table 1 (definitions of special terms are given in Table 2 ). These strategies were developed (and have been continuously updated) over the last 20 years based on the experiences of the Levin group and those of various collaborators and other productive researchers. Although very specific software and platforms are indicated, to facilitate the immediate and practical adoption by researchers at all levels, the important thing is the strategies illustrated by the examples. As software and hardware inevitably change over the next few years, the fundamental principles can be readily adapted to newer products.
Software Packages and Alternatives
A Glossary of Special Terms
Basic Principles
Although there is a huge variety of different types of scientific enterprises, most of them contain one or more activities that can be roughly subsumed by the conceptual progression shown in Figure 1 . This life cycle progresses from brainstorming and ideation through planning, execution of research, and then creation of work products. Each stage requires unique activities and tools, and it is crucial to establish a pipeline and best practices that enable the results of each phase to effectively facilitate the next phase. All of the recommendations given below are designed to support the following basic principles:
- • Information should be easy to find and access, so as to enable the user to have to remember as little as possible—this keeps the mind free to generate new, creative ideas. We believe that when people get comfortable with not having to remember any details and are completely secure in the knowledge that the information has been offloaded to a dependable system and will be there when they need it, a deeper, improved level of thinking can be achieved.
- • Information should be both organized hierarchically (accessible by drill-down search through a rational structure) and searchable by keywords.
- • Information should be reachable from anywhere in the world (but secure and access restricted). Choose software that includes a cell phone/tablet platform client.
- • No information should ever be lost—the systems are such that additional information does not clog up or reduce efficiency of use and backup strategies ensure disaster robustness; therefore, it is possible to save everything.
- • Software tools optimized for specific management tasks should be used; select those tools based on interoperability, features, and the ability to export into common formats (such as XML) in case it becomes expedient someday to switch to a newer product.
- • One's digital world should be organized into several interlocking categories, which utilize different tools: activity (to-dos, projects, research goals) and knowledge (static information).
- • One's activity should be hierarchically organized according to a temporal scale, ranging from immediate goals all the way to career achievement objectives and core mission.
- • Storage of planning data should allow integration of plans with the information needed to implement them (using links to files and data in the various tools).
- • There should be no stored paper—everything should be obtained and stored in a digital form (or immediately digitized, using one of the tools described later in this document).
- • The information management tasks described herein should not occupy so much time as to take away from actual research. When implemented correctly, they result in a net increase in productivity.

The Life Cycle of Research Activity
Various projects occupy different places along a typical timeline. The life cycle extends from creative ideation to gathering information, to formulating a plan, to the execution for the plan, and then to producing a work product such as a grant or paper based on the results. Many of these phases necessitate feedback to a prior phase, shown in thinner arrows (for example, information discovered during a literature search or attempts to formalize the work plan may require novel brainstorming). This diagram shows the product (end result) of each phase and typical tools used to accomplish them.
These basic principles can be used as the skeleton around which specific strategies and new software products can be deployed. Whenever possible, these can be implemented via external administration services (i.e., by a dedicated project manager or administrator inside the group), but this is not always compatible with budgetary constraints, in which case they can readily be deployed by each principal investigator. The PIs also have to decide whether they plan to suggest (or insist) that other people in the group also use these strategies, and perhaps monitor their execution. In our experience, it is most essential for anyone leading a complex project or several to adopt these methods (typically, a faculty member or senior staff scientist), whereas people tightly focused on one project and with limited concurrent tasks involving others (e.g., Ph.D. students) are not essential to move toward the entire system (although, for example, the backup systems should absolutely be ensured to be implemented among all knowledge workers in the group). The following are some of the methods that have proven most effective in our own experience.
Information Technology Infrastructure
Several key elements should be pillars of your Information Technology (IT) infrastructure ( Figure 2 ). You should be familiar enough with computer technology that you can implement these yourself, as it is rare for an institutional IT department to be able to offer this level of assistance. Your primary disk should be a large (currently, ∼2TB) SSD drive or, better, a disk card (such as the 2TB SSD NVMe PCIe) for fast access and minimal waiting time. Your computer should be so fast that you spend no time (except in the case of calculations or data processing) waiting for anything—your typing and mouse movement should be the rate-limiting step. If you find yourself waiting for windows or files to open, obtain a better machine.

Schematic of Data Flow and Storage
Three types of information: data (facts and datasets), action plans (schedules and to-do lists), and work product (documents) all interact with each other in defining a region of work space for a given research project. All of this should be hosted on a single PC (personal computer). It is accessed by a set of regular backups of several types, as well as by the user who can interact with raw files through the file system or with organized data through a variety of client applications that organize information, schedules, and email. See Table 2 for definitions of special terms.
One key element is backups—redundant copies of your data. Disks fail—it is not a question of whether your laptop or hard drive will die, but when. Storage space is inexpensive and researchers' time is precious: team members should not tolerate time lost due to computer snafus. The backup and accessibility system should be such that data are immediately recoverable following any sort of disaster; it only has to be set up once, and it only takes one disaster to realize the value of paranoia about data. This extends also to laboratory inventory systems—it is useful to keep (and back up) lists of significant equipment and reagents in the laboratory, in case they are needed for the insurance process in case of loss or damage.
The main drive should be big enough to keep all key information (not primary laboratory data, such as images or video) in one volume—this is to facilitate cloning. You should have an extra internal drive (which can be a regular disk) of the same size or bigger. Use something like Carbon Copy Cloner or SuperDuper to set up a nightly clone operation. When the main disk fails (e.g., the night before a big grant is due), boot from the clone and your exact, functioning system is ready to go. For Macs, another internal drive set up as a Time Machine enables keeping versions of files as they change. You should also have an external drive, which is likewise a Time Machine or a clone: you can quickly unplug it and take it with you, if the laboratory has to be evacuated (fire alarm or chemical emergency) or if something happens to your computer and you need to use one elsewhere. Set a calendar reminder once a month to check that the Time Machine is accessible and can be searched and that your clone is actually updated and bootable. A Passport-type portable drive is ideal when traveling to conferences: if something happens to the laptop, you can boot a fresh (or borrowed) machine from the portable drive and continue working. For people who routinely install software or operating system updates, I also recommend getting one disk that is a clone of the entire system and applications and then set it to nightly clone the data only , leaving the operating system files unchanged. This guarantees that you have a usable system with the latest data files (useful in case an update or a new piece of software renders the system unstable or unbootable and it overwrites the regular clone before you notice the problem). Consider off-site storage. CrashPlan Pro is a reasonable choice for backing up laboratory data to the cloud. One solution for a single person's digital content is to have two extra external hard drives. One gets a clone of your office computer, and one is a clone of your home computer, and then you swap—bring the office one home and the home one to your office. Update them regularly, and keep them swapped, so that should a disaster strike one location, all of the data are available. Finally, pay careful attention (via timed reminders) to how your laboratory machines and your people's machines are being backed up; a lot of young researchers, especially those who have not been through a disaster yet, do not make backups. One solution is to have a system like CrashPlan Pro installed on everyone's machines to do automatic backup.
Another key element is accessibility of information. Everyone should be working on files (i.e., Microsoft Word documents) that are inside a Dropbox or Box folder; whatever you are working on this month, the files should be inside a folder synchronized by one of these services. That way, if anything happens to your machine, you can access your files from anywhere in the world. It is critical that whatever service is chosen, it is one that s ynchronizes a local copy of the data that live on your local machine (not simply keeps files in the cloud) —that way, you have what you need even if the internet is down or connectivity is poor. Tools that help connect to your resources while on the road include a VPN (especially useful for secure connections while traveling), SFTP (to transfer files; turn on the SFTP, not FTP, service on your office machine), and Remote Desktop (or VNC). All of these exist for cell phone or tablet devices, as well as for laptops, enabling access to anything from anywhere. All files (including scans of paper documents) should be processed by OCR (optical character recognition) software to render their contents searchable. This can be done in batch (on a schedule), by Adobe Acrobat's OCR function, which can be pointed to an entire folder of PDFs, for example, and left to run overnight. The result, especially with Apple's Spotlight feature, is that one can easily retrieve information that might be written inside a scanned document.
Here, we focus on work product and the thought process, not management of the raw data as it emerges from equipment and experimental apparatus. However, mention should be made of electronic laboratory notebooks (ELNs), which are becoming an important aspect of research. ELNs are a rapidly developing field, because they face a number of challenges. A laboratory that abandons paper notebooks entirely has to provide computer interfaces anywhere in the facility where data might be generated; having screens, keyboards, and mice at every microscope or other apparatus station, for example, can be expensive, and it is not trivial to find an ergonomically equivalent digital substitute for writing things down in a notebook as ideas or data appear. On the other hand, keeping both paper notebooks for immediate recording, and ELNs for organized official storage, raises problems of wasted effort during the (perhaps incomplete) transfer of information from paper to the digital version. ELNs are also an essential tool to prevent loss of institutional knowledge as team members move up to independent positions. ELN usage will evolve over time as input devices improve and best practices are developed to minimize the overhead of entering meta-data. However, regardless of how primary data are acquired, the researcher will need specific strategies for transitioning experimental findings into research product in the context of a complex set of personal, institutional, and scientific goals and constraints.
Facilitating Creativity
The pipeline begins with ideas, which must be cultivated and then harnessed for subsequent implementation ( Altshuller, 1984 ). This step consists of two components: identifying salient new information and arranging it in a way that facilitates novel ideas, associations, hypotheses, and strategic plans for making impact.
For the first step, we suggest an automated weekly PubCrawler search, which allows Boolean searches of the literature. Good searches to save include ones focusing on specific keywords of interest, as well as names of specific people whose work one wants to follow. The resulting weekly email of new papers matching specific criteria complements manual searches done via ISI's Web of Science, Google Scholar, and PubMed. The papers of interest should be immediately imported into a reference manager, such as Endnote, along with useful Keywords and text in the Notes field of each one that will facilitate locating them later. Additional tools include DevonAgent and DevonSphere, which enable smart searches of web and local resources, respectively.
Brainstorming can take place on paper or digitally (see later discussion). We have noticed that the rate of influx of new ideas is increased by habituating to never losing a new idea. This can be accomplished by establishing a voicemail contact in your cell phone leading to your own office voicemail (which allows voice recordings of idea fragments while driving or on the road, hands-free) and/or setting up Endnote or a similar server-synchronized application to record (and ideally transcribe) notes. It has been our experience that the more one records ideas arising in a non-work setting, the more often they will pop up automatically. For notes or schematics written on paper during dedicated brainstorming, one tool that ensures that nothing is lost is an electronic pen. For example, the Livescribe products are well integrated with Evernote and ensure that no matter where you are, anything you write down becomes captured in a form accessible from anywhere and are safe no matter what happens to the original notebook in which they were written.
Enhancing scientific thought, creative brainstorming, and strategic planning is facilitated by the creation of mind maps: visual representations of spatial structure of links between concepts, or the mapping of planned activity onto goals of different timescales. There are many available mind map software packages, including MindNode; their goal is to enable one to quickly set down relationships between concepts with a minimum of time spent on formatting. Examples are shown in Figures 3 A and 3B. The process of creating these mind maps (which can then be put on one's website or discussed with the laboratory members) helps refine fuzzy thinking and clarifies the relationships between concepts or activities. Mind mappers are an excellent tool because their light, freeform nature allows unimpeded brainstorming and fluid changes of idea structure but at the same time forces one to explicitly test out specific arrangements of plans or ideas.

Mind Mapping
(A and B) The task of schematizing concepts and ideas spatially based on their hierarchical relationships with each other is a powerful technique for organizing the creative thought process. Examples include (A), which shows how the different projects in our laboratory relate to each other. Importantly, it can also reveal disbalances or gaps in coverage of specific topics, as well as help identify novel relationships between sub-projects by placing them on axes (B) or even identify novel hypotheses suggested by symmetry.
(C) Relationships between the central nervous system (CNS) and regeneration, cancer, and embryogenesis. The connecting lines in black show typical projects (relationships) already being pursued by our laboratory, and the lack of a project in the space between CNS and embryogenesis suggests a straightforward hypothesis and project to examine the role of the brain in embryonic patterning.
It is important to note that mind maps can serve a function beyond explicit organization. In a good mapped structure, one can look for symmetries (revealing relationships that are otherwise not obvious) between the concepts involved. An obvious geometric pattern with a missing link or node can help one think about what could possibly go there, and often identifies new relationships or items that had not been considered ( Figure 3 C), in much the same way that gaps in the periodic table of the elements helped identify novel elements.
Organizing Information and Knowledge
The input and output of the feedback process between brainstorming and literature mining is information. Static information not only consists of the facts, images, documents, and other material needed to support a train of thought but also includes anything needed to support the various projects and activities. It should be accessible in three ways, as it will be active during all phases of the work cycle. Files should be arranged on your disk in a logical hierarchical structure appropriate to the work. Everything should also be searchable and indexed by Spotlight. Finally, some information should be stored as entries in a data management system, like Evernote or DevonThink, which have convenient client applications that make the data accessible from any device.
Notes in these systems should include useful lists and how-to's, including, for example:
- • Names and addresses of experts for specific topics
- • Emergency protocols for laboratory or animal habitats
- • Common recipes/methods
- • Lists and outlines of papers/grants on the docket
- • Information on students, computers, courses, etc.
- • Laboratory policies
- • Materials and advice for students, new group members, etc.
- • Lists of editors, and preferred media contacts
- • Lists of Materials Transfer Agreements (MTAs), contract texts, info on IP
- • Favorite questions for prospective laboratory members
Each note can have attachments, which include manuals, materials safety sheets, etc. DevonThink needs a little more setup but is more robust and also allows keeping the server on one's own machine (nothing gets uploaded to company servers, unlike with Evernote, which might be a factor for sensitive data). Scientific papers should be kept in a reference manager, whereas books (such as epub files and PDFs of books and manuscripts) can be stored in a Calibre library.
Email: A Distinct Kind of Information
A special case of static information is email, including especially informative and/or actionable emails from team members, external collaborators, reviewers, and funders. Because the influx of email is ever-increasing, it is important to (1) establish a good infrastructure for its management and (2) establish policies for responding to emails and using them to facilitate research. The first step is to ensure that one only sees useful emails, by training a good Bayesian spam filter such as SpamSieve. We suggest a triage system in which, at specific times of day (so that it does not interfere with other work), the Inbox is checked and each email is (1) forwarded to someone better suited to handling it, (2) responded quickly for urgent things that need a simple answer, or (3) started as a Draft email for those that require a thoughtful reply. Once a day or a couple of times per week, when circumstances permit focused thought, the Draft folder should be revisited and those emails answered. We suggest a “0 Inbox” policy whereby at the end of a day, the Inbox is basically empty, with everything either delegated, answered, or set to answer later.
We also suggest creating subfolders in the main account (keeping them on the mail server, not local to a computer, so that they can be searched and accessed from anywhere) as follows:
- • Collaborators (emails stating what they are going to do or updating on recent status)
- • Grants in play (emails from funding agencies confirming receipt)
- • Papers in play (emails from journals confirming receipt)
- • Waiting for information (emails from people for whom you are waiting for information)
- • Waiting for miscellaneous (emails from people who you expect to do something)
- • Waiting for reagents (emails from people confirming that they will be sending you a physical object)
Incoming emails belonging to those categories (for example, an email from an NIH program officer acknowledging a grant submission, a collaborator who emailed a plan of what they will do next, or someone who promised to answer a specific question) should be sorted from the Inbox to the relevant folder. Every couple of weeks (according to a calendar reminder), those folders should be checked, and those items that have since been dealt with can be saved to a Saved Messages folder archive, whereas those that remain can be Replied to as a reminder to prod the relevant person.
In addition, as most researchers now exchange a lot of information via email, the email trail preserves a record of relationships among colleagues and collaborators. It can be extremely useful, even years later, to be able to go back and see who said what to whom, what was the last conversation in a collaboration that stalled, who sent that special protocol or reagent and needs to be acknowledged, etc. It is imperative that you know where your email is being stored, by whom, and their policy on retention, storage space limits, search, backup, etc. Most university IT departments keep a mail server with limited storage space and will delete your old emails (even more so if you move institutions). One way to keep a permanent record with complete control is with an application called MailSteward Pro. This is a front-end client for a freely available MySQL server, which can run on any machine in your laboratory. It will import your mail and store unlimited quantities indefinitely. Unlike a mail server, this is a real database system and is not as susceptible to data corruption or loss as many other methods.
A suggested strategy is as follows. Keep every single email, sent and received. Every month (set a timed reminder), have MailSteward Pro import them into the MySQL database. Once a year, prune them from the mail server (or let IT do it on their own schedule). This allows rapid search (and then reply) from inside a mail client for anything that is less than one year old (most searches), but anything older can be found in the very versatile MailStewardPro Boolean search function. Over time, in addition to finding specific emails, this allows some informative data mining. Results of searches via MailStewardPro can be imported into Excel to, for example, identify the people with whom you most frequently communicate or make histograms of the frequency of specific keywords as a function of time throughout your career.
With ideas, mind maps, and the necessary information in hand, one can consider what aspects of the current operations plan can be changed to incorporate plans for new, impactful activity.
Organizing Tasks and Planning
A very useful strategy involves breaking down everything according to the timescales of decision-making, such as in the Getting Things Done (GTD) philosophy ( Figure 4 ) ( Allen, 2015 ). Activities range from immediate (daily) tasks to intermediate goals all the way to career-scale (or life-long) mission statements. As with mind maps, being explicit about these categories not only force one to think hard about important aspects of their work, but also facilitate the transmission of this information to others on the team. The different categories are to be revisited and revised at different rates, according to their position on the hierarchy. This enables you to make sure that effort and resources are being spent according to priorities.

Scales of Activity Planning
Activities should be assigned to a level of planning with a temporal scale, based on how often the goals of that level get re-evaluated. This ranges from core values, which can span an entire career or lifetime, all the way to tactics that guide day-to-day activities. Each level should be re-evaluated at a reasonable time frame to ensure that its goals are still consistent with the bigger picture of the level(s) above it and to help re-define the plans for the levels below it.
We also strongly recommend a yearly personal scientific retreat. This is not meant to be a vacation to “forget about work” but rather an opportunity for freedom from everyday minutiae to revisit, evaluate, and potentially revise future activity (priorities, action items) for the next few years. Every few years, take more time to re-map even higher levels on the pyramid hierarchy; consider what the group has been doing—do you like the intellectual space your group now occupies? Are your efforts having the kind of impact you realistically want to make? A formal diagram helps clarify the conceptual vision and identify gaps and opportunities. Once a correct level of activity has been identified, it is time to plan specific activities.
A very good tool for this purpose, which enables hierarchical storage of tasks and subtasks and their scheduling, is OmniFocus ( Figure 5 ). OmniFocus also enables inclusion of files (or links to files or links to Evernote notes of information) together with each Action. It additionally allows each action to be marked as “Done” once it is complete, providing not only a current action plan but a history of every past activity. Another interesting aspect is the fact that one can link individual actions with specific contexts: visualizing the database from the perspective of contexts enables efficient focus of attention on those tasks that are relevant in a specific scenario. OmniFocus allows setting reminders for specific actions and can be used for adding a time component to the activity.

Project Planning
This figure shows a screenshot of the OmniFocus application, illustrating the nested hierarchy of projects and sub-projects, arranged into larger groups.
The best way to manage time relative to activity (and to manage the people responsible for each activity) is to construct Gantt charts ( Figure 6 ), which can be used to plan out project timelines and help keep grant and contract deliverables on time. A critical feature is that it makes dependencies explicit, so that it is clear which items have to be solved/done before something else can be accomplished. Gantt charts are essential for complex, multi-person, and/or multi-step projects with strict deadlines (such as grant deliverables and progress reports). Software such as OmniPlanner can also be used to link resources (equipment, consumables, living material, etc.) with specific actions and timelines. Updating and evaluation of a Gantt chart for a specific project should take place on a time frame appropriate to the length of the next immediate phase; weekly or biweekly is typical.

Timeline Planning
This figure shows a screenshot of a typical Gantt chart, in OmniPlan software, illustrating the timelines of different project steps, their dependencies, and specific milestones (such as a due date for a site visit or grant submission). Note that Gantt software automatically moves the end date for each item if its subtasks' timing changes, enabling one to see a dynamically correct up-to-date temporal map of the project that adjusts for the real-world contingencies of research.
In addition to the comprehensive work plan in OmniFocus or similar, it is helpful to use a Calendar (which synchronizes to a server, such as Microsoft Office calendar with Exchange server). For yourself, make a task every day called “Monday tasks,” etc., which contains all the individual things to be accomplished (which do not warrant their own calendar reminder). First thing in the morning, one can take a look at the day's tasks to see what needs to be done. Whatever does not get done that day is to be copied onto another day's tasks. For each of the people on your team, make a timed reminder (weekly, for example, for those with whom you meet once a week) containing the immediate next steps for them to do and the next thing they are supposed to produce for your meeting. Have it with you when you meet, and give them a copy, updating the next occurrence as needed based on what was decided at the meeting to do next. This scheme makes it easy for you to remember precisely what needs to be covered in the discussion, serves as a record of the project and what you walked about with whom at any given day (which can be consulted years later, to reconstruct events if needed), and is useful to synchronize everyone on the same page (if the team member gets a copy of it after the meeting).
Writing: The Work Products
Writing, to disseminate results and analysis, is a central activity for scientists. One of the OmniFocus library's sections should contain lists of upcoming grants to write, primary papers that are being worked on, and reviews/hypothesis papers planned. Microsoft Word is the most popular tool for writing papers—its major advantage is compatibility with others, for collaborative manuscripts (its Track Changes feature is also very well implemented, enabling collaboration as a master document is passed from one co-author to another). But Scrivener should be seriously considered—it is an excellent tool that facilitates complex projects and documents because it enables WYSIWYG text editing in the context of a hierarchical structure, which allows you to simultaneously work on a detailed piece of text while seeing the whole outline of the project ( Figure 7 ).

Writing Complex Materials
This figure shows a screenshot from the Scrivener software. The panel on the left facilitates logical and hierarchical organization of a complex writing project (by showing where in the overall structure any given text would fit), while the editing pane on the right allows the user to focus on writing a specific subsection without having to scroll through (but still being able to see) the major categories within which it must fit.
It is critical to learn to use a reference manager—there are numerous ones, including, for example, Endnote, which will make it much easier to collaborate with others on papers with many citations. One specific tip to make collaboration easier is to ask all of the co-authors to set the reference manager to use PMID Accession Number in the temporary citations in the text instead of the arbitrary record number it uses by default. That way, a document can have its bibliography formatted by any of the co-authors even if they have completely different libraries. Although some prefer collaborative editing of a Google Doc file, we have found a “master document” system useful, in which a file is passed around among collaborators by email but only one can make (Tracked) edits at a time (i.e., one person has the master doc and everyone makes edits on top of that).
One task most scientists regularly undertake is writing reviews of a specific subfield (or Whitepapers). It is often difficult, when one has an assignment to write, to remember all of the important papers that were seen in the last few years that bear on the topic. One method to remedy this is to keep standing document files, one for each topic that one might plausibly want to cover and update them regularly. Whenever a good paper is found, immediately enter it into the reference manager (with good keywords) and put a sentence or two about its main point (with the citation) into the relevant document. Whenever you decide to write the review, you will already have a file with the necessary material that only remains to be organized, allowing you to focus on conceptual integration and not combing through literature.
The life cycle of research can be viewed through the lens of the tools used at different stages. First there are the conceptual ideas; many are interconnected, and a mind mapper is used to flesh out the structure of ideas, topics, and concepts; make it explicit; and share it within the team and with external collaborators. Then there is the knowledge—facts, data, documents, protocols, pieces of information that relate to the various concepts. Kept in a combination of Endnote (for papers), Evernote (for information fragments and lists), and file system files (for documents), everything is linked and cross-referenced to facilitate the projects. Activities are action items, based on the mind map, of what to do, who is doing what, and for which purpose/grant. OmniFocus stores the subtasks within tasks within goals for the PI and everyone in the laboratory. During meetings with team members, these lists and calendar entries are used to synchronize objectives with everyone and keep the activity optimized toward the next step goals. The product—discovery and synthesis—is embodied in publications via a word processor and reference manager. A calendar structure is used to manage the trajectory from idea to publication or grant.
The tools are currently good enough to enable individual components in this pipeline. Because new tools are continuously developed and improved, we recommend a yearly overview and analysis of how well the tools are working (e.g., which component of the management plan takes the most time or is the most difficult to make invisible relative to the actual thinking and writing), coupled to a web search for new software and updated versions of existing programs within each of the categories discussed earlier.
A major opportunity exists for software companies in the creation of integrated new tools that provide all the tools in a single integrated system. In future years, a single platform will surely appear that will enable the user to visualize the same research structure from the perspective of an idea mind map, a schedule, a list of action items, or a knowledge system to be queried. Subsequent development may even include Artificial Intelligence tools for knowledge mining, to help the researcher extract novel relationships among the content. These will also need to dovetail with ELN platforms, to enable a more seamless integration of project management with primary data. These may eventually become part of the suite of tools being developed for improving larger group dynamics (e.g., Microsoft Teams). One challenge in such endeavors is ensuring the compatibility of formats and management procedures across groups and collaborators, which can be mitigated by explicitly discussing choice of software and process, at the beginning of any serious collaboration.
Regardless of the specific software products used, a researcher needs to put systems in place for managing information, plans, schedules, and work products. These digital objects need to be maximally accessible and backed up, to optimize productivity. A core principle is to have these systems be so robust and lightweight as to serve as an “external brain” ( Menary, 2010 )—to maximize creativity and deep thought by making sure all the details are recorded and available when needed. Although the above discussion focused on the needs of a single researcher (perhaps running a team), future work will address the unique needs of collaborative projects with more lateral interactions by significant numbers of participants.
Acknowledgments
We thank Joshua Finkelstein for helpful comments on a draft of the manuscript. M.L. gratefully acknowledges support by an Allen Discovery Center award from the Paul G. Allen Frontiers Group (12171) and the Barton Family Foundation.
- Allen D. Revised edition. Penguin Books; 2015. Getting Things Done: The Art of Stress-free Productivity. [ Google Scholar ]
- Altshuller G.S. Gordon and Breach Science Publishers; 1984. Creativity as an Exact Science: The Theory of the Solution of Inventive Problems. [ Google Scholar ]
- Menary R. MIT Press; 2010. The Extended Mind. [ Google Scholar ]
Get organized with Gantt chart templates
Gantt charts give you a visual timeline of the steps in your project, and they've never been easier to put together than with these templates. with just a glance, you'll know exactly when and how things will come together, and these templates will be just the beginning of your journey to a successful, well-run project..

Let these Gantt chart templates guide your success
Let these customizable Gantt chart templates help your business see into the future. This staple of project planning just got easier to outline with templates where all you need to do is bring your parameters and yourself to get started. A Gantt chart is the ideal tool to coordinate groups of people and simultaneous goals and keep all aspects of a plan moving when they're supposed to. With these easy-to-use templates, your Gantt chart can be as colorful and as detailed as your organized heart desires. Make sure everything's going smoothly for your grand opening by know exactly what you have to do and when you have to do it. Or, add a compelling visual to a presentation by laying out the various elements of your project in a comprehensive yet comprehendible way. Dive into timelines and deliverables and let the planning stage of your project be the easy part—a Gantt chart is your business's new best friend.
IMAGES
VIDEO
COMMENTS
Creating a Research project proposal Gantt chart using the Gleek App Step 1: Launching Gleek and Selecting 'New Diagram' First, ... ensuring a robust research plan. Step 5: Data Collection Phase. Following the planning stages is the critical 'Data Collection' phase, slated for four weeks. This phase involves meticulously gathering and ...
A Gantt chart is a bar chart popularized in the early 1900s by Henry Gantt. It lets you establish a detailed project plan according to when you need each task completed. If done correctly, a Gantt chart creates a realistic time frame for a project by establishing a start date for the whole project and each task.
2. Break Down the Project into Stages. Identify the key stages involved in completing your research, such as literature review, data collection, data analysis, and proposal writing. 3. List Tasks Within Each Stage. Now, delve deeper into each research stage and meticulously list all the specific tasks that need to be completed.
Some University departments require students to create a Gantt chart to represent a schedule for the research project. The Gantt chart shows the timelines of the various steps of the project including their dependencies and any resources needed.In other words, the chart depicts when an event is supposed to take place in your project by providing an outline regarding the order in which the ...
Step 6: Share Your Proposal and Gantt Chart. Share your research proposal and Gantt chart with your advisor, committee members, or anyone involved in your project. Their feedback can be invaluable in refining your plan and ensuring its feasibility. With your research proposal and Gantt chart in hand, you're ready to embark on your research project.
Draft key elements: about 1 week each. Testing: about 1 week each, but can start organising as soon as first element is drafted. Write up: 2 months. Final report: no time, really - just need to find a time to meet. Generally, I use weeks to estimate time. Anything that takes less than a week I round off to a week.
A basic Gantt chart can help you plan your research project in detail. You can use other templates to fine-tune other essential aspects of your project. Keyword power tools template. Our Keyword Power Tools Template uses a Gantt chart format to help you visualize project timelines and monitor each phase of your research projects from one ...
The Project Deliverables Gantt Chart Template by ClickUp is the perfect tool for managing deadlines and tasks associated with any project. This template helps you track progress at each stage of the process, ensuring that all deliverables are met on time and within budget. Plus, its intuitive design allows you to quickly make changes as needed ...
Optimizing the Use of Gantt Charts. To maximize the benefits of using Gantt charts in academic research, consider the following tips: Regular Monitoring and Updating: Keep the Gantt chart updated with the latest information on task progress, deadlines, or unforeseen challenges. This will ensure that the Gantt chart accurately represents the ...
This tutorial covers how to create a Gantt chart from start to finish. Feel free to ask any questions or leave a comment. Check out more resources on our blo...
The Gantt chart timeline is a stacked bar chart where each project task is represented by a bar that runs on the horizontal axis. The task bars start on the date that the work is scheduled to start and end on the date when it's expected to finish. The longer the bar, the longer the task will take.
At its most basic, a simple Gantt chart is composed of a vertical axis, which contains a list of tasks, and a horizontal axis, which maps out the project's timeline. By visually displaying your project plan in a constrained timeframe, Gantt charts help you see at a glance the step-by-step actions you need to take to ensure project success.
21+ Gantt Chart Research Proposal Templates. Gantt charts are a useful productivity apparatus for project management. They are a bar chart derivative for task scheduling and progress tracking. The user plots the activity progress along the y-axis, with respect to the indicated time on the x-axis. The leftmost column contains the list of tasks ...
Gantt charts empower project planners to plan, visualize, and execute projects, making them invaluable for comprehensive project views, roadmap creation, and efficient task management. Example : Marketing campaigns require the project team to juggle multiple tasks, such as market research, content creation, and campaign execution.
Gantt charts are useful for planning and scheduling projects. They help you assess how long a project should take, determine the resources needed, and plan the order in which you'll complete tasks. They're also helpful for managing the dependencies between tasks. Gantt charts are useful for monitoring a project's progress once it's underway ...
Gantt charts are used by project managers, business owners, team leaders, and executives in many different industries across various departments. Here are just a few types of companies and teams that use gantt charts to plan, schedule, and execute their projects: Construction. Consulting agencies. Engineering firms.
A Gantt chart is a visual representation of a project schedule and a widely used tool in project management. Gantt charts belong to the family of bar charts. In a Gantt chart, bars depict different project tasks. The length of each bar is proportionate to the task duration and indicates both start and finish dates.
A PhD research plan or schedule can be prepared using the GANTT chart which includes a month, semester or year-wise planning of the entire PhD research work. First, enlist goals and objectives. It's not about your research objective enlisted in your proposal. I'm talking about the objectives of your PhD.
The Research Gantt Chart is utilised to represent the project schedule that involves the duration of the individual tasks, the stages and its depencies and ordering. It keeps up the process of the planning by calculating its duration, the identification of resources, and lays out the order in which the resarch work need to be completed. It calculates the starting and the end point of the ...
A Gantt chart is a bar chart which shows the schedule for a project. The project is broken down into key tasks/elements to be completed. ... This video helps you to understand the importance of research data management and how you can plan, organise, store, preserve, and share your data. Link to video on Research Data Management. Feedback Form.
Steps involved in creating a Gantt chart for PhD studies. Step 1: List all the deliverables expected of your PhD program. In this example, the PhD program has the following requirements: Coursework, divided into 4 modules each lasting 2 weeks. All 4 modules need to be completed within the first year of study.
The planning of changes in research emphasis, hiring, grant-writing, etc. likewise occur over several different timescales. The optimization of resources and talent toward impactful goals requires the ability to organize, store, and rapidly access information that is integrated with project planning structures. ... Gantt charts are essential ...
A Gantt chart is the ideal tool to coordinate groups of people and simultaneous goals and keep all aspects of a plan moving when they're supposed to. With these easy-to-use templates, your Gantt chart can be as colorful and as detailed as your organized heart desires. Make sure everything's going smoothly for your grand opening by know exactly ...
To create a new project, find and click the + button on the menu on the left of your screen. There's one next to Me and another next to Active Projects. Either will work. Next, click New Project ...