
Want to create or adapt books like this? Learn more about how Pressbooks supports open publishing practices.
Quantitative Data Analysis With SPSS

10 Quantitative Analysis with SPSS: Getting Started
Mikaila Mariel Lemonik Arthur
This chapter focuses on getting started with SPSS. Note that before you can start to work with SPSS, you need to get your data into an appropriate format, as discussed in the chapter on Preparing Quantitative Data and Data Management . It is possible to enter data directly into SPSS, but the interface is not conducive to data entry and so researchers are better off entering their data using a spreadsheet program and then importing it.
Importing Data Into SPSS
In some cases, existing data will be able to be downloaded in SPSS format (*.sav is the file extension for an SPSS datafile), in which case it can be opened in SPSS by going to File → Open → Data and then locating the location of the file. However, in most cases, researchers will need to import data stored in another file format into SPSS. To import data, go to the file menu, then select import data. Next, choose the type of data you wish to import from the menu that appears. In most cases, researchers will be importing Excel or CSV data (when they have entered it themselves or are downloading it from a general-purpose site like the Census Bureau) or SAS or Stata data (when they are downloading it from a site that makes prepared statistical data files available).
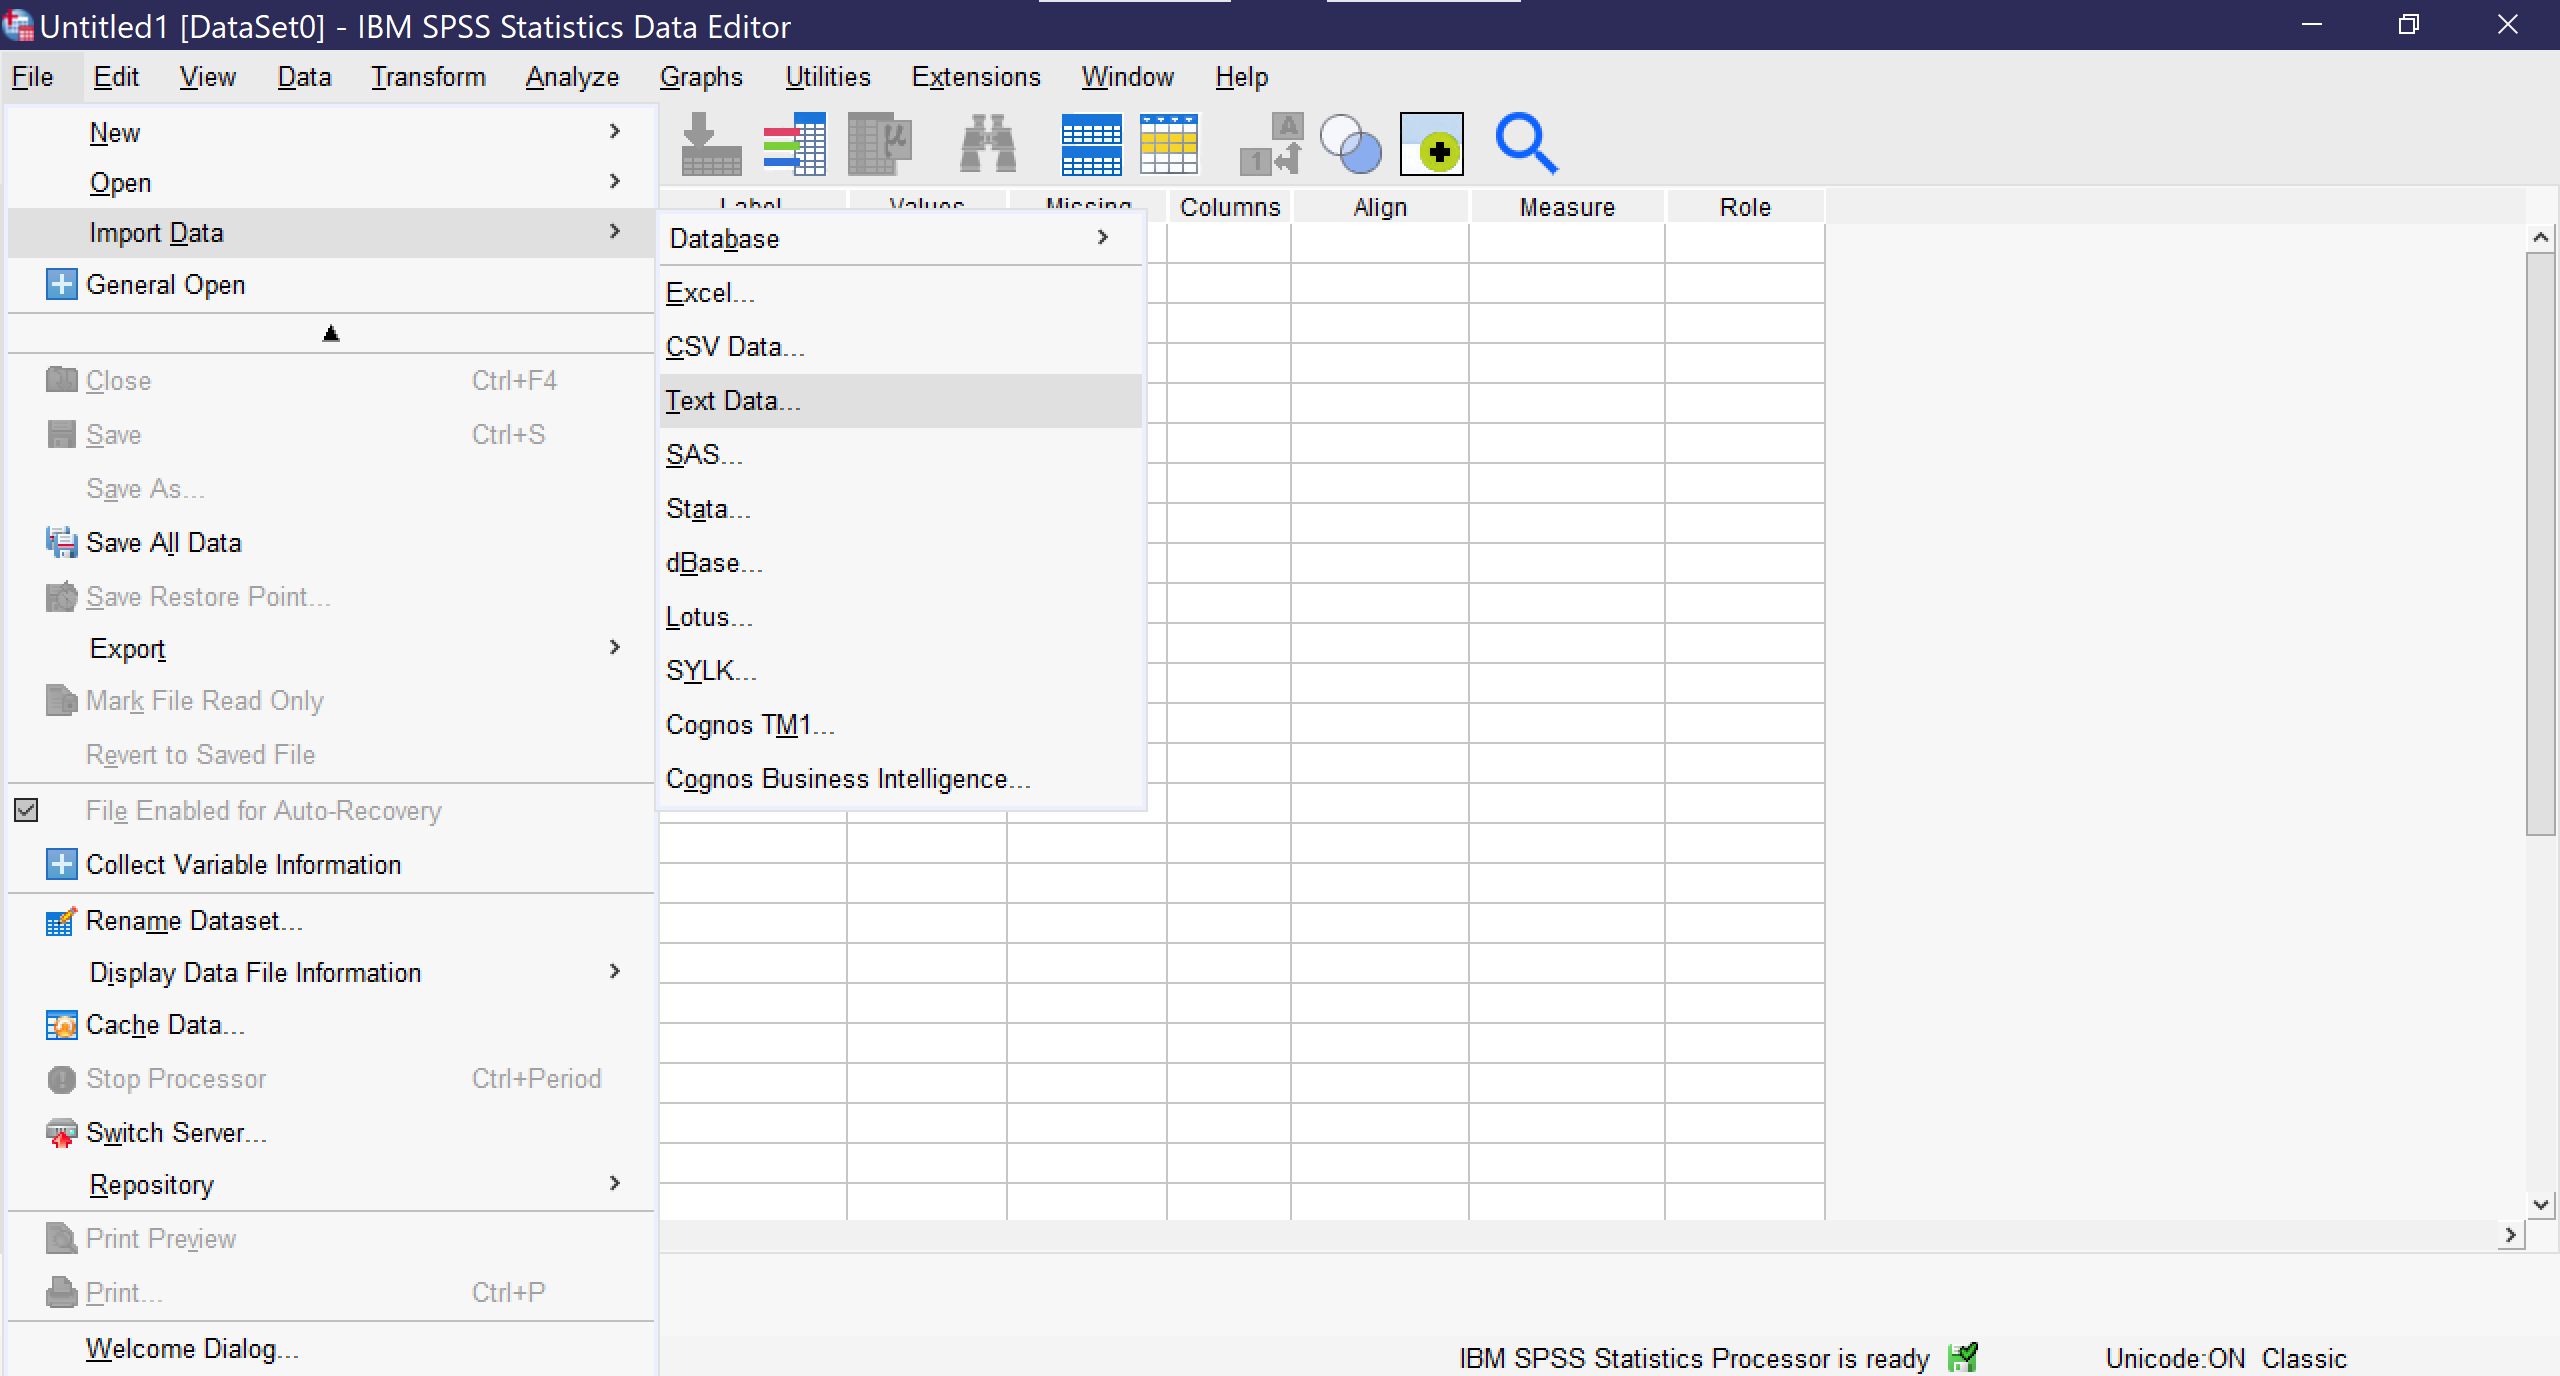
Once you click on a data type, a window will pop up for you to select the file you wish to import. Be sure it is of the file type you have chosen. If you import a file in a format that is already designed to work with statistical software, such as Stata, the importation process will be as seamless as opening a file. Researchers should be sure that immediately after importing, they save their file (File → Save As) so that it is stored in SPSS format and can be opened in SPSS, rather than imported, in the future. It is essential to remember that SPSS is not cloud-resident software and does not have an autosave function, so any time a file is changed, it must be manually saved.
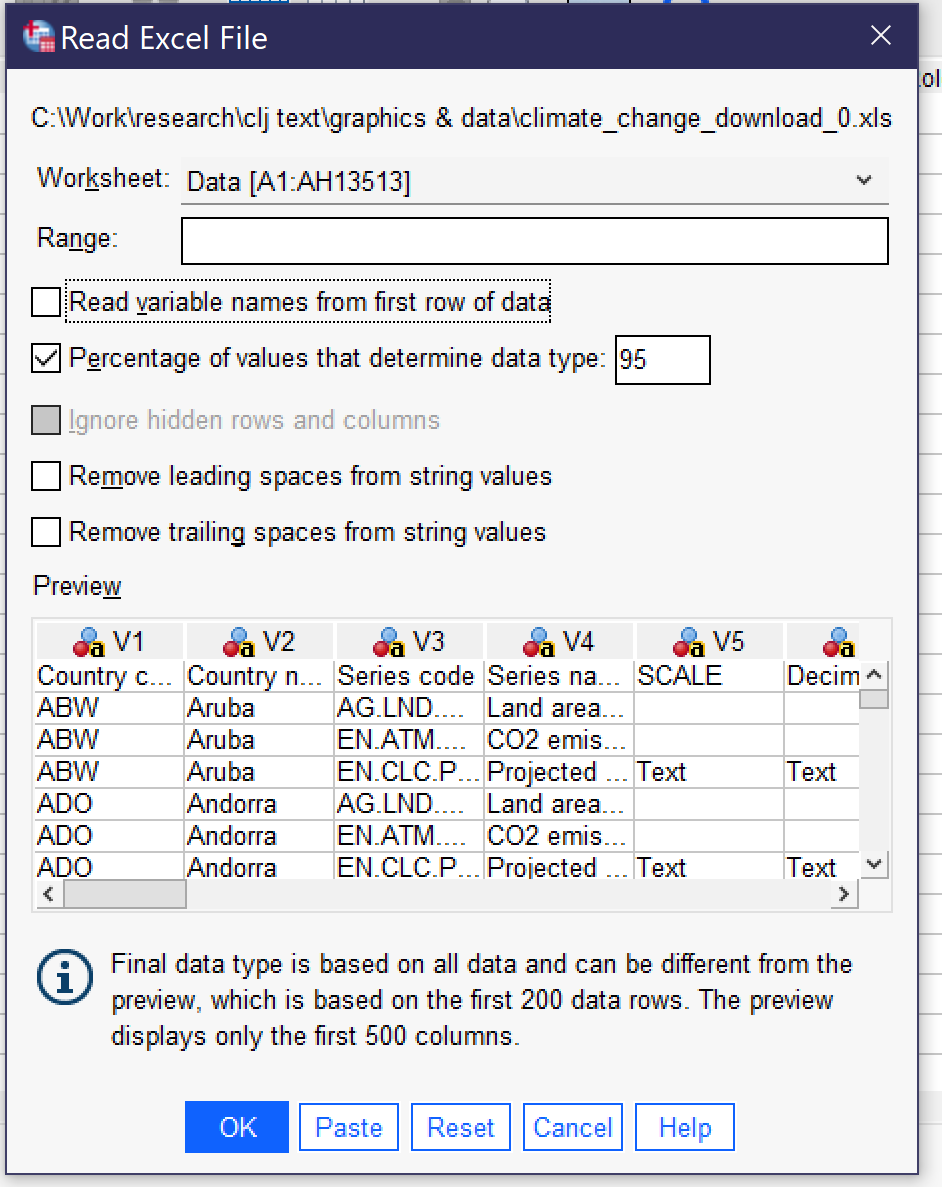
If you import a file in Excel, CSV (comma-separated values) or text format, SPSS will open an import wizard with a number of steps. The steps vary slightly depending on which file type you are importing. For instance, to import an Excel file, as shown in Figure 2, you first need to specify the worksheet (if the file has multiple worksheets—SPSS can only import one worksheet at a time). You can choose to specify a limited range of cells. Checking the checkbox next to “Read variable names from first row of data” will replace the V1, V2, V3, and so on column headers with whatever appears in the top row of data in the Excel file. You can also choose to change the percentage of values that are used to determine data type, remove leading and trailing spaces from string values, and—if your Excel file has hidden rows or columns—you can choose to ignore them. Below the options, a preview of your Excel file will be shown; you can scroll through the preview to see that data is being displayed correctly. Clicking OK will finalize the import.
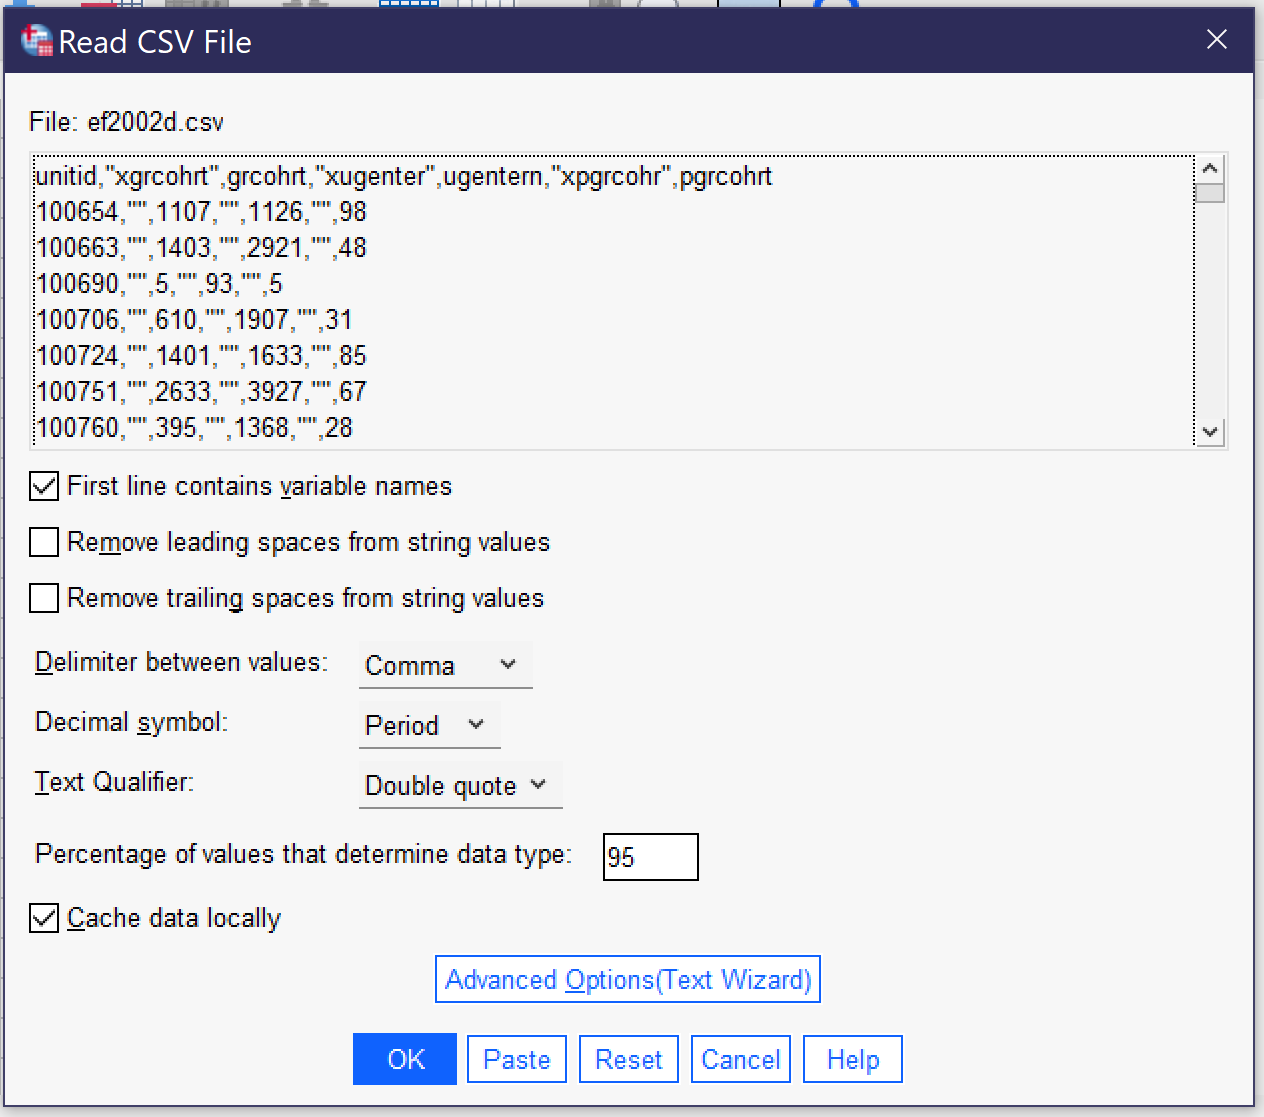
A different set of options appears when you import a CSV file, as shown in Figure 3. The top of the popup window shows a preview of the data in CSV format. While toggles related to whether the first line contains variable names, removing leading and trailing spaces, and indicating the percentage of values that determine the data type are the same as for importing data from Excel, there are additional options that are important for the proper importing of CSV data. First of all, the user must specify whether values are delimited by a comma, a semicolon, or a tab. While commas are the most common delimiters in CSV files, the other delimiters are possible, and looking at the preview should make clear which of the delimiters is being used in a given file, as shown in the example below.
Second, the user must specify whether the period or the comma is the decimal symbol. Data produced in the United States typically uses the period (as in 1238.67), as does data produced in many other English-speaking countries, while most of Europe and Latin America use the comma. Third, the user must specify the text qualifier (single quotes, double quotes, or none). This is the character used to note that the contents of a particular entry in the CSV file are textual (string variables) in nature, not numerical. If your data includes text, it should be clear from the preview which qualifier is being used. Users can also toggle whether data is cached locally or not; caching locally speeds the importation process.
Finally, there is a button for Advanced Options (Text Wizard). The text wizard offers the same window and options that users see if they are importing a text file directly, and this wizard offers more direct control over the importation process over a series of six steps. First, users can specify a predefined format if they have a *.tpf file on their computers (this is rare) and see a preview of what the data in the file looks like. In step two, they can indicate if the file is delimited (as above) or fixed-width (where values are stored in columns of constant size specified within the file); which—if any—row contains the variable names; and the decimal symbol. Note that some forms of fixed-width files may not be supported. Third, they indicate which line of the file contains the first line of data, whether each line represents a case or a specific given number of variables represents a case, and how many cases to import. This last choice includes the option to import a random sample of cases. Fourth, users specify the delimiter and the text qualifier and determine how to handle leading and trailing spaces in string values. Fifth, users can double-check variable names and formats. Finally, before clicking the “Finish” button, users can choose to save their selections as a *.tpf file to be reused or to paste the syntax (to be discussed later in this chapter).
In all cases, once the importation options have been selected and OK or Finish has been clicked, the data is imported. An output window (see Figure 4) may open with various warnings and details about the importation process, and the Data View window (see Figure 5) will show the data, with variable names at the top of each column. At this point, be sure to save the dataset in a location and with a name you will be able to locate later.
Before users are done setting up their dataset, they must be sure that appropriate variable information is included. When datasets are imported from other statistical programs, they will typically come with variable information. But when they are imported from Excel or CSV files, the variable information must be manually entered, typically from a codebook or related document. Variable information is entered using Variable View. Users can switch between Data View and Variable View by clicking the tabs at the bottom of the screen or using the Ctrl+T key combination. As you can see in Figure 6, a screenshot of a completed dataset, Variable View shows each variable in a row, with a variety of information about that variable. When a dataset is imported, each of these pieces of information need to be entered by hand for each variable. To move between columns by key commands, use the tab key; to open variable information that requires a menu for entry, click the space bar twice.
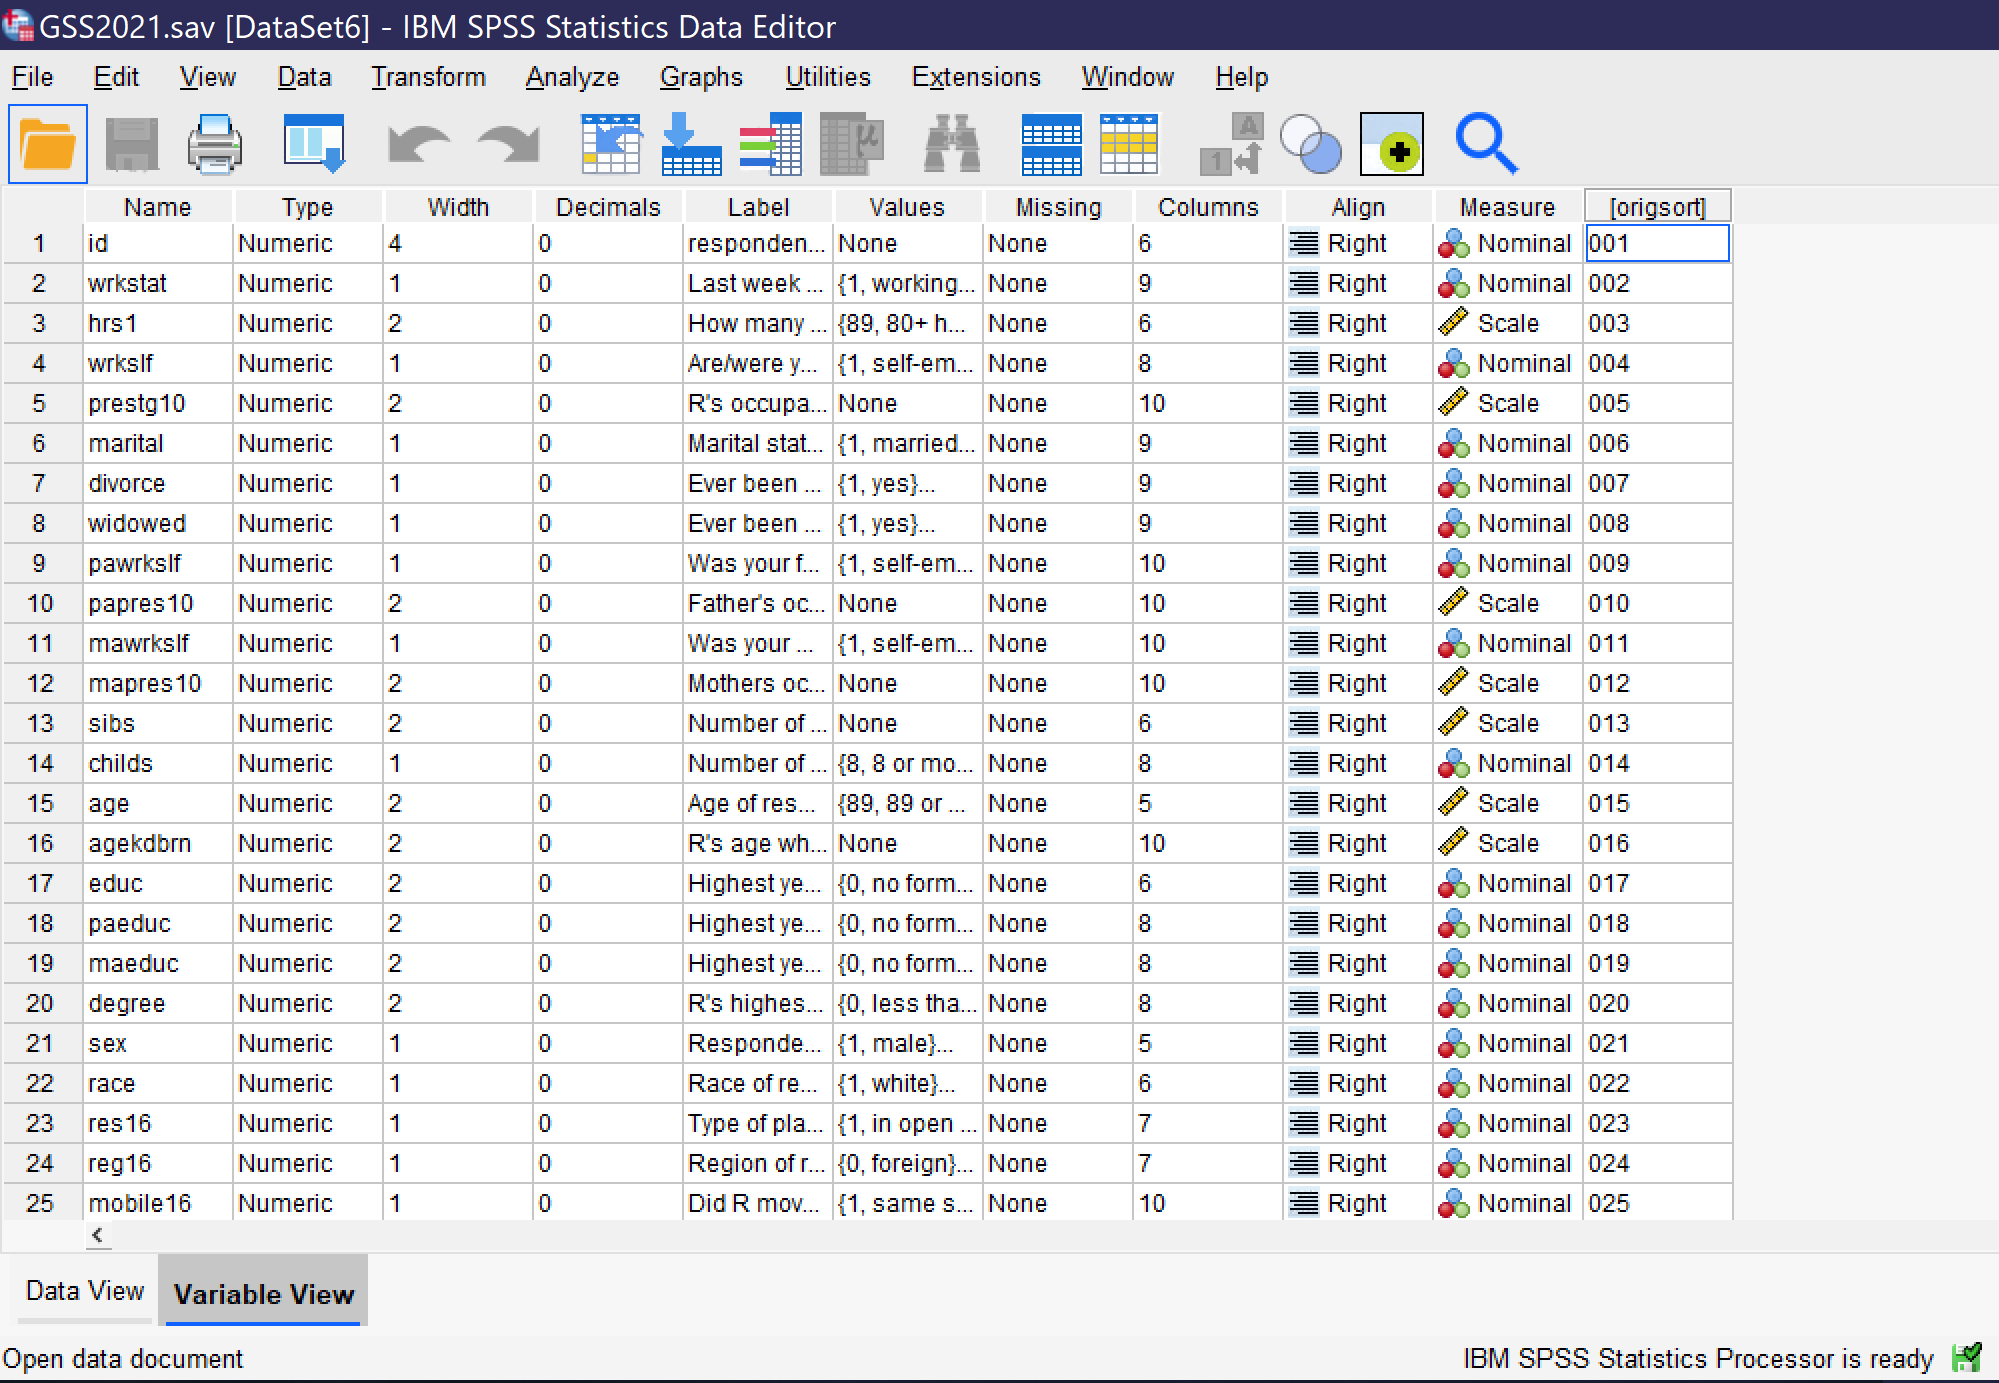
- Name requires that each variable be given a short name, without any spaces. There are additional rules about names, but in short, names should be primarily alphanumeric in nature and cannot be words or use symbols that have meaning for the underlying computer processing. Names can be entered directly.
- Type specifies the variable type. To open up the menu allowing the selection of variable types, click on the cell, then click on the three dots [.…] that appear on the right side of the cell. Users can then choose from among numeric, dollar, date, numeric with leading zeros, string, and other variable types.
- Width specifies the number of characters of width for the variable itself in data storage, while decimals specifies how many decimal places the variable will have. These can both be entered or edited directly or in the dialog box for Type.
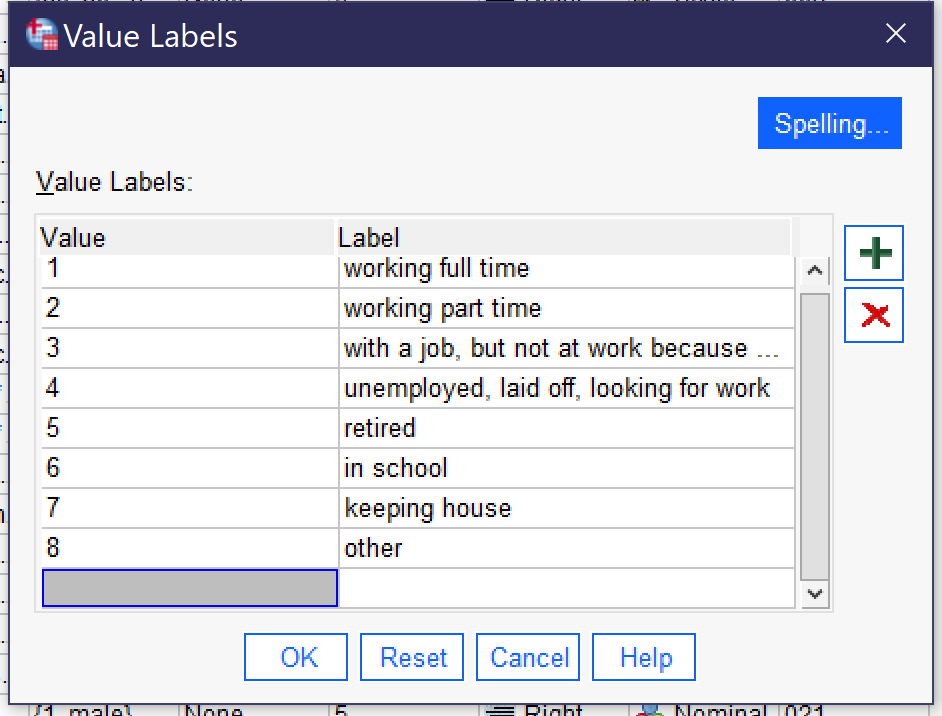
more completely what the variable is measuring. It can be entered directly.
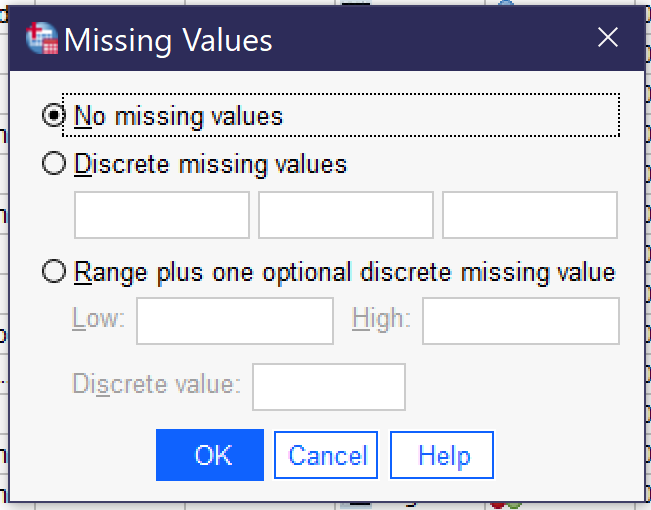
- Missing provides for the indication that particular values—like “refused to answer”—should be treated by the SPSS software as missing data rather than as analytically useful categories. Clicking the three dots [.…] opens a dialog box for specifying missing values. When there are no missing values, “no missing values” should be selected. Otherwise, users can select “discrete missing values” and then enter three specific missing values—the numerical values, not the value labels—or they can elect “range plus one optional discrete missing value” to specific a range from low to high of missing values, optionally adding an additional single discrete value.
- Columns specifies the width of the display column for the variable. It can be entered directly.
- Align specifies whether the variable data will be aligned right, center, or left. Users can click in the cell to make a menu appear or can press spacebar twice and then use arrows to select the desired alignment.
- Measure permits the indication of level of measurement from among nominal, ordinal, and scale variables. Users can click in the cell to make a menu appear or can press spacebar twice and then use arrows to select the desired level of measurement. Note that measure is often wrong in datasets and analysts should not rely on it in determining the level of measurement for selection of statistical tests; SPSS does not use this characteristic when running tests.
- Some datasets will have additional criteria. For example, the dataset shown in Figure 6 has a column called origsort which displays the original sort order of the dataset, so that if an analyst sorts the variables they can be returned to their original order.
When entering variable information, it is especially important to include Name, Label, and Values and be sure Type is correct and any Missing values are specified. Other variable information is less crucial, though clearly it is better to fully specify all variable information. Once all variable information is entered and double-checked and the dataset has been saved, it is ready for use.
When a user first opens SPSS, they are greeted with the “Welcome Dialog” (see figure 9). This dialog provides tips, links to help resources, and options for creating a new file (by selecting “new dataset”) or opening recently used files. There is a checkbox for turning off the Welcome Dialog so that it will not be shown in the future.
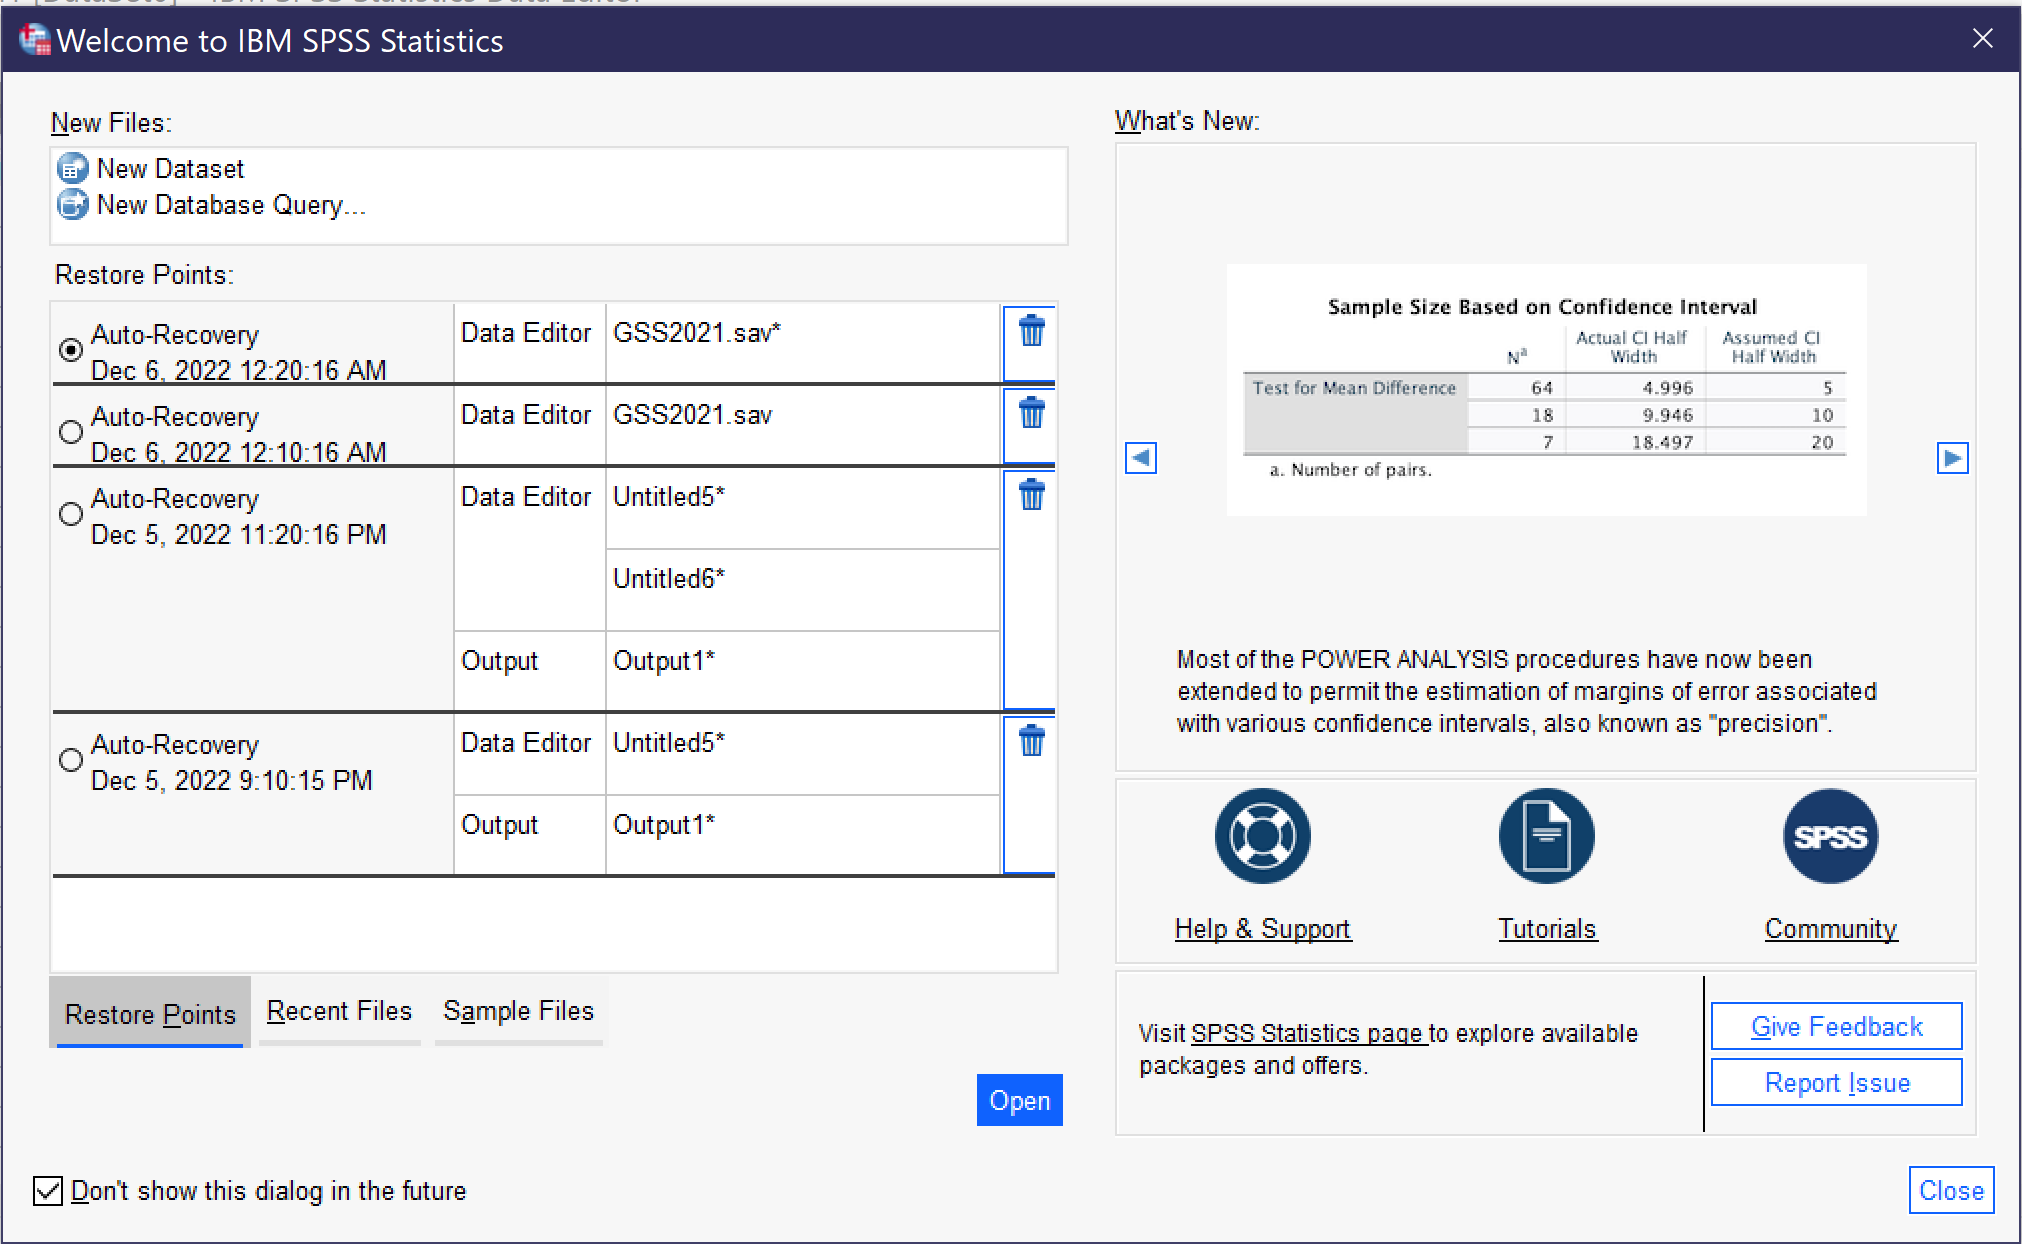
When the Welcome Dialog is turned off, SPSS opens with a blank file. Going to File → Open → Data (Alt+F, O, D) brings up the dialog for opening a data file; the Open menu also provides for opening other types of files, which will be discussed below. Earlier in this chapter, the differences between Data View and Variable view were discussed; when you open a data file, be sure to observe which view you are using.
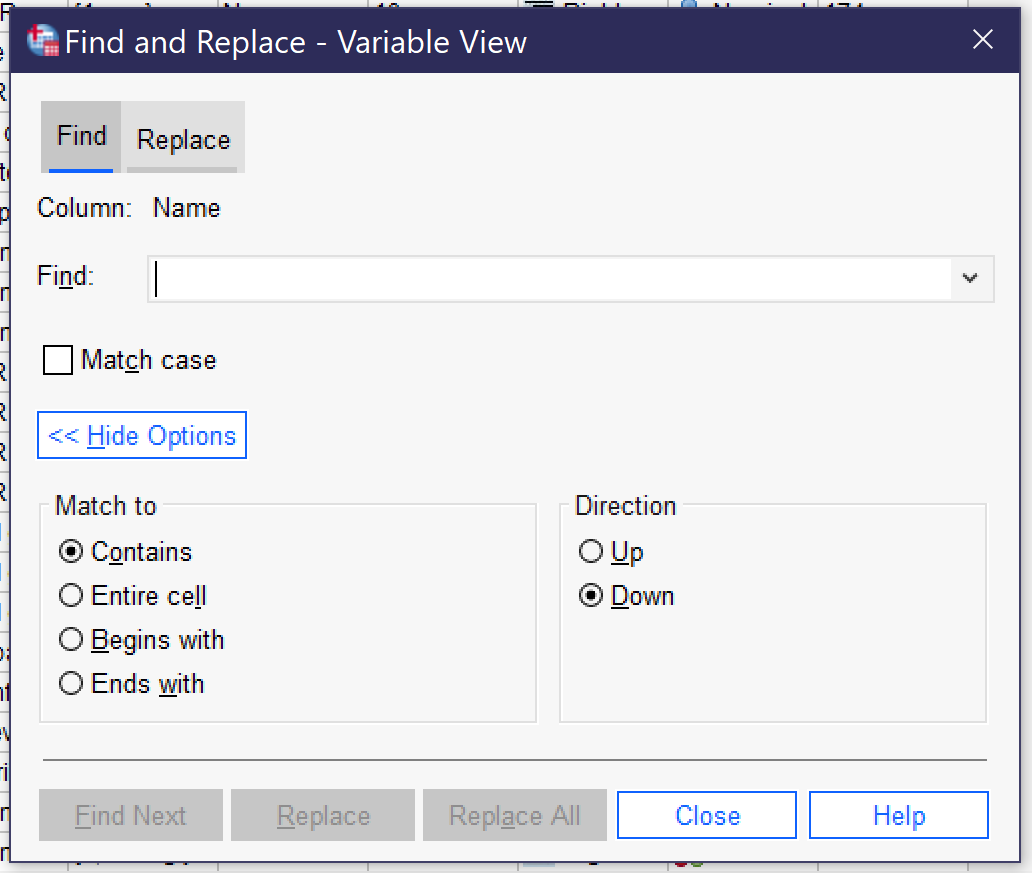
It can be useful to be able to search for a variable or case in the datafile. There are two main ways to do this, both under the Edit menu (Alt+E). [1] The Edit menu offers Find and Go To. Find, which can also be accessed by pressing Ctrl+F, allows users to search for all or part of a variable name. Figure 10 displays the Search dialog, with options shown after clicking on the “show options” button. (Users can also use the Replace function, but this carries the risk of writing over data and so should be avoided in almost all cases.) Be sure to select the column you wish to search—the Find function can only examine one column in Variable View at a time. Most typically, users will want to search variable names or labels. The checkbox for Match Case toggles whether or not case (in other words, capitalization) matters to the search. Expanding the options permits users to specify how much and which part of a cell must be matched as well as search order.
Users can also navigate to specific variables by using the Edit → Go to Case (to navigate to a specific case—or row in data view) and Edit → Go to Variable (to navigate to a specific variable—a row in variable view or a column in data view). Users can also access detailed variable information via the tool Utilities → Variables.
Another useful feature is the ability to sort variables and cases. Both types of sorting can be found in the data menu. Variables can be sorted by any of the characteristics in variable view; when sorting, the original sort order can be saved as a new characteristic. Cases can be sorted on any variable.
SPSS Options
The Options dialog can be reached by going to Edit → Options (or Alt+E, Alt+N). There are a wide variety of options available to help users customize their SPSS experience, a few of which are particularly important. First of all, using various dialogs and menus in the program is much easier if the options Variable List—Display Names (Alt+N) and Alphabetical (Alt+H) are selected under General. You can also change the display language for both the user interface and for output under Language, change fonts and colors for output under Viewer, set number options under Data; change currency options under Currency; set default output for graphs and charts under Charts; and set default file locations for saving files under File locations. While most of these options can be left on their default settings, it is really important for most users to set variables to display names and alphabetical before use. Options will be preserved if you use the same computer and user account, but if you are working on a public computer you should get in the habit of checking every time you start the program.
Getting More Out of SPSS
So far, we have been working only with Data View and Variable View in the main dataset window. But when researchers produce the results of an analysis, these results appear in a new window called Output—IBM SPSS Statistics Viewer. New Output windows can be opened from the File menu by going to Open → Output or from the Window menu by selecting “Go to Designated Viewer Window” (the later command also brings the output window to the foreground if one is already open). Output will be discussed in more detail when the results of different tests are discussed. For now, note that output can be saved in *.spv format, but this format can only be viewed in SPSS. To save output in a format viewable in other applications, go to File → Export, where you can choose a file location and a file format (like Word, PowerPoint, HTML, or PDF). Individual output items can also be copied and pasted.
SPSS also offers a Syntax viewer and editor, which can also be accessed from both the File and Window menus. While syntax is beyond the scope of this text, it provides the option for writing code (kind of like a computer program) to control SPSS rather than using menus and buttons in a graphical user interface. Experienced users, or those doing many similar repetitive tasks, often find working via syntax to be faster and more efficient, but the learning curve is quite steep. If you are interested in learning more about how to write syntax in SPSS, Help → Command Syntax Reference brings up a very long document detailing the commands available.
Finally, the Help menu in SPSS offers a variety of options for getting help in using the program, including links to web resource guides, PDF documentation, and help forums. These tools can also be reached directly via the SPSS website. In addition, many dialog boxes contain a “Help” button that takes users to webpages with more detail on the tool in question.
Go to https://www.baseball-reference.com/ and select 10 baseball players of your choice. In an Excel or other spreadsheet, enter the name, position, batting arm, throwing arm, weight in pounds, and height in inches, as well as, from the Summary: Career section, HR (home runs) and WAR (wins above replacement). Each player should get one row of the Excel spreadsheet. Once you have entered the data, import it into SPSS. Then use Variable View to enter the relevant information about each variable—including value labels for position, batting arm, and throwing arm. Sort your cases by home runs. Finally, save your file.
Media Attributions
- import menu
- import excel © IBM SPSS is licensed under a All Rights Reserved license
- import csv © IBM SPSS is licensed under a All Rights Reserved license
- output window © IBM SPSS is licensed under a All Rights Reserved license
- spss data view © IBM SPSS is licensed under a All Rights Reserved license
- variable-view © IBM SPSS is licensed under a All Rights Reserved license
- value labels © IBM SPSS is licensed under a All Rights Reserved license
- missing values © IBM SPSS is licensed under a All Rights Reserved license
- welcome dialog © IBSM SPSS is licensed under a All Rights Reserved license
- find and replace © IBM SPSS is licensed under a All Rights Reserved license
- Note that "Search," another option under the Edit menu, does not search variables or cases but instead launches a search of SPSS web resources and help files. ↵
A data type that represents non-numerical data; string values can include any sequence of letters, numbers, and spaces.
The possible levels or response choices of a given variable.
Social Data Analysis Copyright © 2021 by Mikaila Mariel Lemonik Arthur is licensed under a Creative Commons Attribution-NonCommercial-ShareAlike 4.0 International License , except where otherwise noted.
IBM SPSS Statistics provides a powerful suite of data analytics tools which allows you to quickly analyze your data with a simple point-and-click interface and enables you to extract critical insights with ease. During these times of rapid change that demand agility, it is imperative to embrace data driven decision-making to improve business outcomes. Organizations of all kinds have relied on IBM SPSS Statistics for decades to help solve a wide range of business and research problems .
Explore SPSS Statistics with our interactive tutorials
SPSS Statistics offers a comprehensive set of capabilities in support of the entire analytical process from data preparation to analysis and reporting. It simplifies and accelerates data analytics by offering a simple menu-driven user interface that allows you to get to insights with just a few clicks, without any coding.
Interactive, hands-on tutorials are one of the best ways to experience SPSS Statistics. Here are a few SPSS Statistics learning resources that can get you started:
Statistics 101
If you’re just starting out with IBM Statistics, this introductory tutorial can help you get up to speed. You’ll learn about descriptive statistics, variance, probability, correlation and data visualization. It starts you off gently with a coverage of the fundamentals including descriptive statistics and moves you through five self-paced modules that take you through the steps to data wrangling and more.
Get more information on the SPSS Statistics 101 tutorial here .
View SPSS Statistics in action
IBM experts have put together an array of demo videos and assets that allow you to deep-dive into powerful statistical procedures and tools included in this versatile statistical software. We recommend starting with the overview video below to explore the power of statistical analysis to enable timely and accurate decisions for your organization.
To help you along your learning journey, we have provided a detailed video library that includes demo videos around advanced statistics, data preparation and popular procedures like Regression. Visit the video library .
Are you wondering if SPSS Statistics enables you to deliver visualizations and other output? Watch this video about the output and visualization capabilities of SPSS Statistics to learn how to customize pivot tables and create publication-ready charts, tables and decision trees. Visit the IBM media center to view it.
These are just a few of the tutorials available to help you learn and become proficient with SPSS Statistics. For more basic to advanced tutorials and feature documentation, visit the SPSS product documentation .
Get more from SPSS Statistics with new algorithms and visualization tools
IBM recently launched SPSS Statistics 29. The latest version includes new statistical algorithms, enhancements to existing statistical procedures, new Relationship Maps for data visualization, and several usability improvements to make SPSS Statistics more user friendly for novices and experts alike. You can read all about the new release in this data sheet .
Sign up for our tech-talk series to stay up to date with the latest developments around SPSS Statistics. Register here
Ready to dive deeper into SPSS Statistics on your own and start turbocharging your research and business analysis?
Try SPSS Statistics at no cost for 30 days.
Get yearly subscription and save more
IBM offers simple subscription options to help you easily get started with SPSS Statistics and scale as your requirements grow. You can even choose the 12 months auto-renewal plan and save 10% on subscription and add-ons .
More from Artificial intelligence
The convergence of hpc and ai: driving innovation at speed .
3 min read - In today’s rapidly changing landscape, delivering higher-quality products to the market faster is essential for success. Many industries rely on high-performance computing (HPC) to achieve this goal. Enterprises are increasingly turning to generative artificial intelligence (gen AI) to drive operational efficiencies, accelerate business decisions and foster growth. We believe that the convergence of both HPC and artificial intelligence (AI) is key for enterprises to remain competitive. These innovative technologies complement each other, enabling organizations to benefit from their…
Enterprise generative AI made simple: IBM’s differentiated approach to delivering enterprise grade foundation models
5 min read - In 2023, organizational departments such as human resources, IT and customer care focused on generative artificial intelligence (AI) use cases such as summarization, code generation and question-answering to reduce costs and boost productivity. A Gartner executive poll indicates that 55% of organizations are already piloting or implementing generative AI. The major challenge facing enterprise decision-makers is achieving the right balance between operationalizing generative AI faster and mitigating foundational model-related risks, while staying on top of a rapidly evolving technology landscape. …
IBM secures Leadership in G2 Spring Reports
2 min read - IBM offerings were featured in more than 1,200 unique G2 reports, earning over 250 Leader badges across various categories. These accolades are given to offerings that receive positive reviews from verified users, compared to competitive products in their respective categories. Detailed information about G2’s scoring methodologies, G2 Market Report inclusion criteria, and sorting logic can be found on G2 platform. According to the most recent G2 Software Buyer Behavior Report, “Value, scalability, and ease are top considerations for software buyers.” Ninety-three percent of…
IBM Newsletters
- PRO Courses Guides New Tech Help Pro Expert Videos About wikiHow Pro Upgrade Sign In
- EDIT Edit this Article
- EXPLORE Tech Help Pro About Us Random Article Quizzes Request a New Article Community Dashboard This Or That Game Popular Categories Arts and Entertainment Artwork Books Movies Computers and Electronics Computers Phone Skills Technology Hacks Health Men's Health Mental Health Women's Health Relationships Dating Love Relationship Issues Hobbies and Crafts Crafts Drawing Games Education & Communication Communication Skills Personal Development Studying Personal Care and Style Fashion Hair Care Personal Hygiene Youth Personal Care School Stuff Dating All Categories Arts and Entertainment Finance and Business Home and Garden Relationship Quizzes Cars & Other Vehicles Food and Entertaining Personal Care and Style Sports and Fitness Computers and Electronics Health Pets and Animals Travel Education & Communication Hobbies and Crafts Philosophy and Religion Work World Family Life Holidays and Traditions Relationships Youth
- Browse Articles
- Learn Something New
- Quizzes Hot
- This Or That Game New
- Train Your Brain
- Explore More
- Support wikiHow
- About wikiHow
- Log in / Sign up
- Computers and Electronics
How to Analyse Data Using SPSS
Last Updated: July 18, 2023 Fact Checked
wikiHow is a “wiki,” similar to Wikipedia, which means that many of our articles are co-written by multiple authors. To create this article, volunteer authors worked to edit and improve it over time. This article has been fact-checked, ensuring the accuracy of any cited facts and confirming the authority of its sources. This article has been viewed 291,373 times. Learn more...
SPSS (The Statistical Package for the Social Sciences) software has been developed by IBM and it is widely used to analyse data and make predictions based on specific collections of data. SPSS is easy to learn and enables teachers as well as students to easily derive results with the help of a few commands. The implications of the results are fairly evident and are statistically valid. Using the software, one can conduct a series of studies quickly and effectively. If you are worried about conducting your data analysis on SPSS, here are a few guidelines and an overview of the process.

Community Q&A
- No study can be incomplete without the right research and therefore, SPSS plays a vital role in the life of a researcher. Thanks Helpful 2 Not Helpful 8

You Might Also Like

- ↑ https://scholar.valpo.edu/cgi/viewcontent.cgi?article=1000&context=psych_oer
- ↑ https://students.shu.ac.uk/lits/it/documents/pdf/analysing_data_using_spss.pdf
- ↑ https://med.und.edu/research/daccota/_files/pdfs/berdc_resource_pdfs/data_analysis_using_spss.pdf
About This Article
- Send fan mail to authors
Is this article up to date?

Featured Articles

Trending Articles

Watch Articles

- Terms of Use
- Privacy Policy
- Do Not Sell or Share My Info
- Not Selling Info
wikiHow Tech Help Pro:
Level up your tech skills and stay ahead of the curve

- Langson Library
- Science Library
- Grunigen Medical Library
- Law Library
- Connect From Off-Campus
- Accessibility
- Gateway Study Center

Email this link
Software for data analysis.
- Qualitative Data Analysis Software (Free)
- Python Libraries
- StoryMaps This link opens in a new window
- Other Helpful Tools - StatTransfer and OpenRefine
- DSS Programming Workshops
Online Learning -- Software & Coding
Safari Books Online - brings you ebooks and videos from 200+ respected publishers, including O’Reilly, Pearson, Wiley, Packt, Harvard Business Review, and Wharton Digital Press.
Excellent graphic user interface makes statistics analysis easier, including many most complex models. At the same time, the package still supports syntax programs which offers flexibility and time-effectiveness.
Where To Find It!
- SPSS is available from OIT as a $210 recharge for one year
- Campus - UCI's Virtual Computing Lab (VCL) and check the Computer Lab Software List
Online Tutorials
- SPSS Tutorials Modules address the basics, data analysis, ANOVA, T-Test, and Chi-Square Test.
- Getting Started with SPSS for Windows It's a tutorial by Indiana University. Its intro to the SPSS interface, data preparation, output are excellent for newbies to software. The tutorial also covers descriptive statistics and OLS.
- SPSS Learning Modules The tutorial is prepared by Academic Technology Services in UCLA. It has a starter kit for beginners, and also topics for a range of data analysis models. more... less... data analysis models, including, Probit Regression , Logistic Regression , Poisson Regression , One-way MANOVA , Canonical Correlation Analysis , etc.
- SPSS Syntax Many users choose SPSS for its user-friendly interface, however, don't satisfy yourself with it. The Syntax will provide great productivity, and this website will offer effectiveness in learning SPSS Syntax.
- SPSS Basics Word document
Recommended Books
- << Previous: Stata
- Next: SAS >>
- Last Updated: Feb 15, 2024 1:40 PM
- URL: https://guides.lib.uci.edu/dataanalysis
Off-campus? Please use the Software VPN and choose the group UCIFull to access licensed content. For more information, please Click here
Software VPN is not available for guests, so they may not have access to some content when connecting from off-campus.
Quantitative Data Analysis
How to install, learning resources.
- Quant Data & Methods Resources
SPSS is a software package used for statistical analysis. It can
- take data from almost any type of file
- generate tabulated reports
- plot distributions and trends
- create charts and graphs
- perform descriptive and complex statistical analyses
JMU community members can download SPSS to their computing resources.
- PC Instructions
- Mac Instructions
- SPSS Statistics Essential Training In this course, Barton Poulson takes a practical, visual, and non-mathematical approach to SPSS Statistics, explaining how to use the popular program to analyze data. This course is ideal for first-time researchers and those who want to make the most of data in their professional and academic work.
- SPSS for Academic Research Topics include t-tests, analysis of variance (ANOVA), and understanding the statistical measurements behind academic research. Yash Patel provides some general guidelines and assumptions, along with a challenge and solution exercise to practice what you've learned.
- << Previous: Home
- Next: R >>
- Last Updated: Feb 13, 2024 10:15 AM
- URL: https://guides.lib.jmu.edu/quant
- Interesting
- Scholarships
- UGC-CARE Journals
How to Use IBM SPSS for Research
Learn how to use IBM SPSS for research in this beginner's guide

Table of contents
Step 1: installing and entering data, step 2: preparing your data, step 3: understanding your data with descriptive statistics, step 4: visualizing your data, step 5: testing your hypotheses, step 6: analyzing and interpreting results, step 7: reporting your findings.
If you’re new to the world of data analysis and research, IBM SPSS (Statistical Package for the Social Sciences) can be a valuable tool to help you make sense of your data. In this beginner’s guide, iLovePhD walks you through the steps of using IBM SPSS for research, from data entry and preparation to statistical analysis and reporting. Don’t worry; we’ll keep it simple and easy to understand!
A Beginner’s Guide to Using IBM SPSS for Research
Before we dive into data analysis, you’ll need to install IBM SPSS on your computer. Once you have it set up, create a new data file or import your existing data from sources like Excel or CSV files. You can manually enter your data or import it with a few clicks.
Visit: https://www.ibm.com/products/spss-statistics/campus-editions
Data needs to be clean and error-free before analysis. Check for missing data or outliers and handle them appropriately. You can also recode variables or create new ones if needed. It’s a good idea to label your variables and their values to make the data more understandable.
Descriptive statistics help you get a clear picture of your data’s basic characteristics. IBM SPSS can calculate mean, median, standard deviation, and frequency distributions, making it easier for you to interpret your data.
Seeing is believing! IBM SPSS allows you to create charts and graphs to visually represent your data. Whether it’s bar charts, line graphs, or scatterplots, visualization can reveal patterns and trends that might not be apparent in raw numbers.
To answer your research questions, you’ll need to perform hypothesis testing. Don’t worry; you don’t have to be a statistician! IBM SPSS offers various tests, such as t-tests, ANOVA, chi-square, and correlation. Pick the appropriate one for your research and interpret the results it provides.
Once you’ve done the statistical tests, it’s time to analyze the results. Look for patterns and relationships in your data that can help you draw meaningful conclusions. Consider the practical implications of your findings and discuss their significance in your research context.
Now that you have your results, it’s time to present them in a clear and organized manner. IBM SPSS can help you generate comprehensive reports with charts and tables. You can export the results to other software, such as Microsoft Word or Excel, for further formatting and presentation.
Using IBM SPSS for research doesn’t have to be intimidating. With its user-friendly interface and powerful statistical tools, you can gain valuable insights from your data without being a statistics expert. Remember, practice makes perfect! As you become more familiar with IBM SPSS, you’ll be better equipped to tackle more complex research questions and contribute to the world of knowledge. Happy analyzing!
- beginner's guide
- Data Analysis
- data interpretation
- Data visualization
- hypothesis testing
- research data
- research projects
- statistical analysis
- user-friendly tools
10 Tips to Quickly Publish Research Article with ChatGPT
7 tips to increase your citation score, scientists are working on this in 2024 top 10 research areas revealed, email subscription.

iLovePhD is a research education website to know updated research-related information. It helps researchers to find top journals for publishing research articles and get an easy manual for research tools. The main aim of this website is to help Ph.D. scholars who are working in various domains to get more valuable ideas to carry out their research. Learn the current groundbreaking research activities around the world, love the process of getting a Ph.D.
WhatsApp Channel
Join iLovePhD WhatsApp Channel Now!
Contact us: [email protected]
Copyright © 2019-2024 - iLovePhD
- Artificial intelligence
A Step-by-Step Guide to Data Analysis Using SPSS: Iron Study Data
- First Online: 13 December 2023
Cite this chapter
- Amal K. Mitra 2
320 Accesses
The purpose of this chapter is to provide a step-by-step guide for beginners on how to use SPSS to analyze health data. An example of the Iron Supplementation Study conducted by the author will be used to demonstrate data analysis techniques. The readers will first get familiar with a few basic steps before starting the data analysis process, including the study’s objectives, variable characteristics, data entry, data cleaning, and a data analysis plan. An in-depth, step-by-step method of data analysis and interpretation of the data output will be provided. Data analysis will include basic descriptive statistics, data distribution, normality tests, and commonly used parametric and nonparametric tests, depending on the data distribution. The statistical tests include: independent sample t -test, paired t -test, confidence intervals, chi-square test, ANOVA tests, repeated analysis, correlation, linear regression, logistic regression, and selected nonparametric tests.
- SPSS data analysis
- Test of normality
- Student’s t -test
- Paired t -test
- Confidence intervals
- Chi-square test
- Repeated analysis
- Correlation
- Regression tests
This is a preview of subscription content, log in via an institution to check access.
Access this chapter
- Available as PDF
- Read on any device
- Instant download
- Own it forever
- Available as EPUB and PDF
- Durable hardcover edition
- Dispatched in 3 to 5 business days
- Free shipping worldwide - see info
Tax calculation will be finalised at checkout
Purchases are for personal use only
Institutional subscriptions
Mitra AK, Khoury A. Universal iron supplementation: a simple and effective strategy to reduce anaemia among low-income, postpartum women. Public Health Nutr. 2012;15(3):546–53. https://doi.org/10.1017/S1368980011001261 . Available at: https://www.cambridge.org/core/services/aop-cambridge-core/content/view/9F4DADAD18B159C234495CE363852B43/S1368980011001261a.pdf/div-class-title-universal-iron-supplementation-a-simple-and-effective-strategy-to-reduce-anaemia-among-low-income-postpartum-women-div.pdf
Article PubMed Google Scholar
Mishra P, Pandey CM, Singh U, Gupta A, Sahu C, Keshri A. Descriptive statistics and normality tests for statistical data. Ann Card Anaesth. 2019;22(1):67–72. https://doi.org/10.4103/aca.ACA_157_18 .
Article PubMed PubMed Central Google Scholar
Ghasemi A, Zahediasl S. Normality tests for statistical analysis: a guide for non-statisticians. Int J Endocrinol Metab. 2012;10(2):486–9. https://doi.org/10.5812/ijem.3505 .
Curran-Everett D. Explorations in statistics: the assumption of normality. Adv Physiol Educ. 2017;41:449–53. https://doi.org/10.1152/advan.00064.2017 .
Daniel WW, Cross CL. Biostatistics: a foundation for analysis in the health sciences. 10th ed. Hoboken: John Wiley & Sons; 2013.
Google Scholar
Download references
Author information
Authors and affiliations.
Department of Epidemiology and Biostatistics, Jackson State University, Jackson, MS, USA
Amal K. Mitra
You can also search for this author in PubMed Google Scholar
Corresponding author
Correspondence to Amal K. Mitra .
Editor information
Editors and affiliations, rights and permissions.
Reprints and permissions
Copyright information
© 2024 The Author(s), under exclusive license to Springer Nature Switzerland AG
About this chapter
Mitra, A.K. (2024). A Step-by-Step Guide to Data Analysis Using SPSS: Iron Study Data. In: Mitra, A.K. (eds) Statistical Approaches for Epidemiology. Springer, Cham. https://doi.org/10.1007/978-3-031-41784-9_20
Download citation
DOI : https://doi.org/10.1007/978-3-031-41784-9_20
Published : 13 December 2023
Publisher Name : Springer, Cham
Print ISBN : 978-3-031-41783-2
Online ISBN : 978-3-031-41784-9
eBook Packages : Medicine Medicine (R0)
Share this chapter
Anyone you share the following link with will be able to read this content:
Sorry, a shareable link is not currently available for this article.
Provided by the Springer Nature SharedIt content-sharing initiative
- Publish with us
Policies and ethics
- Find a journal
- Track your research
- Address: 13th Street. 47 W 13th St, New York, NY 10011, USA.
- +1(424)-285-0253
- 24/7 Support
- 100+ Subjects
- 500+ PhD statisticians
What Our Customers Say About Our Data Analysis Services

6 Steps To Follow When Analyzing Data Using SPSS
SPSS, which stands for Statistical Package for Social Sciences is a strong statistical tool mainly used for analysing the data in different ways. No matter if you’re working on a research project, using SPSS in data analysis for a dissertation, or a business report, or just exploring something on your own, SPSS can help you arrange, change, and visualize your data. It also helps you check your ideas and make decisions based on the data. In this article, you’ll discover six steps to use SPSS for understanding and analyzing data.
1. Step 1: Define your research questions/ hypotheses
Before you dive into SPSS data analysis , it’s important to know what you’re looking for and what you think you might discover. This means, you always start with defining research questions or research hypotheses before analyzing data using SPSS . Also, when defining the research questions, you should be clear on what you wish to achieve and whether your variables are measured in your data. In other words, some of the factors you should consider when formulating research questions include:
- Relevance to Your Field : Ensure that your research questions are closely related to your field of study and contribute to existing knowledge.
- Clarity and Precision : Craft clear and specific questions that avoid ambiguity.
- Feasibility : Make sure your questions are realistic and can be answered within the scope of your dissertation.
- Originality : Aim for questions that address gaps in existing literature or offer a unique perspective.
- Measurability : Ensure that your questions can be measured or assessed using appropriate methods and data.
Your hypothesis is like a guess about how things are connected or different. For instance, if you’re curious about how gender influences how well college students do in their studies, your research question could be: “Does gender make a difference in the academic performance of college students?” Your guess, or hypothesis, could be: “Female students do better in their studies than male students.”
2. Step 2: Prepare Your Data
Once you have your research question and hypothesis, you need to collect and prepare your data. Some of the tools you can use to collect data for SPSS data analysis include, survey questionnaires, existing databases, experiments and even observations. Once you have gathered data using your preferred data collection tool, you need to prepare and preprocess your data for analysis. That is, before analyzing data using SPSS, you need to perform some data transformation and organization to ensure it fits the suitable format that SPSS can read and process.
Some of the main steps you need to follow when preprocessing your data for spss data analysis include:
- Collect all the relevant data for your study and ensure it is well-organized.
- Store data in a format that is compatible with SPSS (e.g., Excel, CSV).
- Identify and handle missing data: Decide whether to remove cases with missing data, impute missing values, or use other appropriate techniques.
- Check for and correct any data entry errors or inconsistencies.
- Assign meaningful labels to categorical variables (e.g., convert numeric codes to labels for gender: 1 = Male, 2 = Female).
- Ensure consistency in coding throughout the dataset.
- If necessary, perform transformations like log or square root to make data more normally distributed.
- Create new variables or recode existing ones to suit your analysis (e.g., calculating a mean score from multiple survey items).
- Identify outliers using descriptive statistics or visualization techniques (e.g., box plots).
- Decide whether to remove, transform, or winsorize outliers, depending on the nature of your data and research objectives.
- Determine which variables are relevant to your research question and analysis. Remove irrelevant variables to simplify your dataset.
- Generate summary statistics and explore the distribution of your variables using SPSS descriptive statistics and visualizations (e.g., histograms, scatterplots).
Once you’ve completed these preprocessing steps, your data should be well-prepared for analysis in SPSS or any other statistical software, and you can proceed with your chosen statistical tests and research objectives.

Learn How to Analyze Data Using SPSS in 6 Steps
3. Step 3: Choose the Right Statistical Tests
There are various statistical tests available, each with its specific use cases. Depending on your research question and hypothesis, you need to select the most suitable statistical test that will help you answer your question and test your hypothesis.
SPSS offers a wide range of analysis methods, such as descriptive statistics, inferential statistics, correlation, regression, ANOVA, chi-square, t-test, and more. Remember that statistical tests highly rely on the level of measurements. Therefore, you need to be well-versed with the various levels of measurements.
Statistical Levels of Measurement
In statistics, there are four levels of measurement, which represent the different ways in which data can be categorized and analyzed. These levels are hierarchical, with each level including all the characteristics of the levels below it. The four levels of measurement are:
- Nominal data represents categories or labels for different groups or items.
- Data at this level cannot be quantitatively compared or ordered.
- Examples include gender (male, female), colors, types of animals, and yes/no responses.
- Statistical operations: Mode (most frequent category), frequency counts.
- Ordinal data includes categories with a specific order or ranking.
- While you can rank and order the categories, the intervals between them are not equal or meaningful.
- Examples include education levels (e.g., high school, bachelor’s, master’s, Ph.D.), Likert scale responses (e.g., strongly disagree, disagree, neutral, agree, strongly agree).
- Statistical operations: Mode, median, percentiles, non-parametric tests.
- Interval data has equal intervals between values, but it lacks a true zero point.
- You can perform arithmetic operations like addition and subtraction on interval data, but multiplication and division do not make sense in the absence of a meaningful zero.
- Examples include temperature in Celsius or Fahrenheit and IQ scores.
- Statistical operations: Mode, median, mean, standard deviation, parametric tests (e.g., t-tests, ANOVA).
- Ratio data has equal intervals between values and a true zero point.
- With a true zero, you can perform all arithmetic operations, including multiplication and division.
- Examples include height, weight, age, income, and counts (e.g., number of books).
- Statistical operations: Mode, median, mean, standard deviation, parametric tests, and ratio-based measures (e.g., income-to-debt ratio).
The level of measurement determines the types of statistical analysis that can be applied to the data. Typically, as you move up the hierarchy from nominal to ratio, you gain more analytical capabilities and precision. However, it’s important to choose the appropriate level of measurement for your data to ensure meaningful and accurate analysis. Using an inappropriate level of measurement can lead to incorrect conclusions and misinterpretation of results in statistical analysis.
Furthermore, you need to ensure that the assumptions for each statistical tests are met before proceeding with your analysis. For example, if you want to compare the means of two groups, you can use a t-test, but you need to check if your data is normally distributed and if the groups have equal variances. You will also need to understand the difference between parametric and non-parametric tests and when to use them.

4. Step 4: Analyzing Data Using SPSS
Once you’ve selected the most suitable statistical test, the next step is to conduct data analysis using SPSS and check your output. You can use the menus, the dialog boxes, or the syntax editor to run your analysis in SPSS. You can also customize your output options, such as tables, charts, graphs, or reports. You need to examine your output carefully and look for any errors, warnings, or messages that might indicate a problem with your data or analysis. You also need to interpret your output and look for the relevant statistics, such as means, standard deviations, p-values, coefficients, or effect sizes.
5. Step 5: Report your results and findings
Once you’ve figured out what your data is trying to tell you, it’s time to share your findings in a clear and simple way. You’ll want to follow the referencing guidelines such as APA, MLA, or Chicago style, to make it all look nice and organized.
You can share your results by writing about them, making tables or charts, and using the right words. Make sure to connect what you found to your original questions and hypothesis. For example, you might say something like this: The results of the t-test showed that female students had significantly higher academic performance than male students (M = 85.6, SD = 9.8; M = 79.4, SD = 10.2; t(98) = 3.12, p < 0.01). This means that the proposed research hypothesis has been proven thus confirming the hypothesis.
6. Step 6: Evaluate your analysis and interpretation
The last step involves carefully looking at your analysis and interpretation while thinking about their strengths and weaknesses. You should consider whether your analysis and interpretation are trustworthy and applicable to a broader context. It’s also essential to be aware of any potential biases, mistakes, or uncertainties that could affect your work and figure out how to minimize them. Additionally, you should suggest what your findings mean and any recommendations or future research ideas that might come from them.
For example, you could say: “Our study shows that gender plays a role in how well college students perform academically. However, we should keep in mind that our study had some limitations, like a small group of participants, only using one way to measure academic performance, and not taking into account other things that could affect academic success. So, it’s important to do more research to understand why there are differences between genders in how well students do in college.”

Still struggling with data analysis using SPSS? Worry no more! Online-SPSS have professional SPSS tutors to help you with any type of analysis using various statistical software.
15% OFF On Your 1st Order
Greetings! Looking for professional Data Analysis Help, SPSS Homework Help or Statistics Assignment Help? Online-spss.com is your go-to destination for professional data analysis services for dissertation, thesis paper, or even capstone project. Get 15% off when you place an order.
Main Services
SPSS Data Analysis Services
Data Analysis Help
Dissertation Data Analysis Help
Statistical Analysis Services
Biostatistics Homework Help
R Programming Homework Help
Do My SPSS Homework
Minitab Assignment Help
Statistics Help
Online-spss.com provides professional data analysis services to many clients globally. Our data analysis services are not restricted to US , UK , Canada and Australia but rather extends to many other countries across the world. Hire our Expert Statisticians For top-quality data analysis services.
Guaranteed Success
We are confident in our ability to deliver high-quality SPSS homework help. That's why we offer the following guarantees:
Have questions or need help? Our support team is available 24/7 to assist you.
Our expert statisticians ensure your assignments are accurate, well-structured, and meet the highest academic standards.
We stand behind our work. If you're unsatisfied, we offer a money-back guarantee (details on our policy page)
We understand deadlines are crucial. Your completed assignments will be delivered on time, every time.
Not satisfied with something? We offer unlimited revisions until you're happy with the final results.
How it Works
Getting started with Online SPSS is a breeze. Follow these straightforward steps to get A+ grades in all your assignments.
Start by clicking on the Order Now button, enter the required details, and upload supporting files to submit your data analysis project or assignment through our user-friendly order form.
Once you've made payments, our data analysis experts will start working on your data analysis project. We use paypal integration, which is quick and secure, & supporting different payment options.
Sit back and relax! You will receive complete solution via email before your stipulated deadline. Our solutions are always 100% original & plagiarism free.
Our Top Tutors
You can learn more about our Online SPSS tutors by checking their profiles below.

A proficient SPSS tutor and data analysis expert Sophia empowers individuals to harness the power of statistical software With her strong grasp of statistical concepts and practical application she equips learners with the skills to confidently analyze and interpret data using SPSS
Hire Writer

A knowledgeable statistician and SPSS consultant Isabella assists researchers in designing robust experiments and analyzing their data effectively With her expertise in multivariate analysis and data visualization she uncovers valuable insights to enhance research outcomes

As an SPSS specialist and skilled data analyst Liam thrives in solving intricate statistical problems With his deep understanding of research methodologies and command over SPSS he guides clients through data cleaning hypothesis testing and advanced statistical techniques

An experienced SPSS tutor and skilled statistician Ethan helps students navigate the complexities of data analysis With his strong analytical skills and patient teaching style he empowers learners to master SPSS and gain valuable insights from their research

A seasoned statistician and data analysis expert Noah excels in extracting meaningful patterns from complex datasets With his expertise in SPSS and statistical modeling he supports researchers in drawing accurate conclusions and making datadriven decisions

An experienced SPSS tutor and skilled statistician Emily helps students navigate the complexities of data analysis With her strong analytical skills and patient teaching style she empowers learners to master SPSS and gain valuable insights from their research
Calculate the price of your order
We are expert in:.
With online-spss, you get statistical and data analysis help services from expert statisticians. We can help you with statistical analysis using the following statistical tools:

SPSS Data Analysis Help

SAS Data Analysis Help

Rstudio Data Analysis Help

Minitab Data Analysis Help

Excel Data Analysis Help

Jamovi Data Analysis Help

Stata Assignment Help

Python Assignment Help
- Skip to search box
- Skip to main content
Princeton University Library
Getting started in data analysis: stata, r, spss, excel: home.
- DSS Lab Schedule This link opens in a new window
Search DSS Libguides
Analyzing data.
- DSS Online Training/Getting Started section A collection of tutorials to help you getting started in your data analysis.
Nice regression and descriptive statistics tables
- Using -- outreg2 -- to make nice tables (Stata) "Using outreg2 to report regression output, descriptive statistics, frequencies and basic crosstabulations."
- Using stargazer to report regression outputs, summary statistics "Using stargazer to report regression output and descriptive statistics in R (for non-LaTeX users)."
Data Transfer Between Statistical Packages
- Using Stat/Transfer Easiest way to go from SPSS, SAS or other proprietary statistical software to Stata
Getting Started series
- Getting Started in Data Analysis using Stata This Stata tutorial include topics reading data in Stata (from Excel to Stata, from SPSS to Stata, from SAS to Stata), data management (recode, generate, sort variables), frequencies, crosstabs, merge, scatter plots, histograms, descriptive statistics, regression and more!
- Getting Started in Data Analysis using R This R tutorial provides a side-by-side comparison with Stata. It includes first steps, importing/exporting data to/from R/Stata. Frequencies, crosstablations, scatterplots, histograms, descriptive statistics.
- Fixed and random effects (panel data analysis - Stata) A basic introduction on fixed and random effects models to analyze panel data.
- Fixed/Random Effects (panel data analysis - R) Introduction to fixed/random effects using R
- Linear Regression using Stata Basic introduction to linear regression analysis, diagnostics and presentation (using Stata)
- Linear Regression using R Introduction to linear regression and diagnostics using R.
- Logit & Ordered logit regression Introduction to logit and ordered logit regression
- Factor Analysis Basic introduction to factor analysis
- Extracting Intraday Price Quotes from TAQ database in WRDS using SAS
- Merge/Append using Stata Merge, append datasets using Stata
- Merge/Append using R Merge, append using R
- Reshape data using Stata Reshape wide to long and long to wide in Stata
- Reshape data using R Reshape long to wide and wide to long in R
- From NLS Investigator to Stata This document offers a quick introduction to the NLS Investigator. It follows a basic approach and focus on searching, downloading and putting the data into Stata
- Introduction to RStudio Basic intro on how to use RStudio
- Transpose Rows as columns in Excel
- Z-test for proportions Excel file on how to estimate a z-test for proportions.
- Predicted probabilities/marginal effects using margins Stata Estimating predicted probabilities and marginal effects after (ordered) logit/probit models --margins--. Export output to word using ---outreg2--
- Logit/ordered logit, predicted probabilities and marginal effects uisng R Estimating logit/ordered logit models using R. Predicted probabilities and marginal effects are are also included.
- Intro to Data Visualization: Stata Stata code to the most common graphs used in statistical analysis.
- Differences-in-differences using Stata Basic differences-in-differences estimation (Stata)
- Differences-in-differences using R Basic differences-in-differences estimation (R)
- Fuzzy merge using R
- Cubic interpolation using R
Data Analysis 101 workshops
- Descriptive statistics using Excel/Stata What are descriptive statistics? How to estimate them using Excel or Stata?
- Fixed Random Effects/Panel Data in Rn Stata
- Fixed Random Effects/Panel Data in Stata Estimation of basic fixed effects and random effects models using Stata
- Linear Regression in R
- Linear Regression in Stata Basics on how to run, define and interpret linear regression and time series output.
- Multilevel Analysis Introduction to multilevel analysis
- Time Series in R A Step-by-step guide of time series analysis and event study
- Time Series in Stata Introduction to time series analysis
Topics in Statistics/Econometrics
- Bootstrap Methods and Permutation Tests
- The Concept of Confidence Interval "Statisticians use a confidence interval to express the degree of uncertainty associated with a sample statistic. A confidence interval is an interval estimate combined with a probability statement."
- TED: Visualizing Data On data visualization
Appointments
- Make an appointment
Additional info...
- DSS lab location (map) The DSS lab is located in Firestone Library A-12G (A-floor)
- General info on the DSS lab
- Next: Readings >>
- Last Updated: Apr 1, 2024 5:26 PM
- URL: https://libguides.princeton.edu/dss

- < Previous
Home > CLAS > Psychology > Psych OER > 1
Psychology Curricular Materials

Using SPSS to Understand Research and Data Analysis
Daniel Arkkelin , Valparaiso University Follow
Download Full Text (3.1 MB)
Download Chapter 1 - First Contact: Overview of Book & SPSS Help (143 KB)
Download Chapter 2 - Close Encounter: The Data Editor, Syntax & Output Viewer (446 KB)
Download Chapter 3 - Point-and Click: Conducting Analyses in the Data Editor (272 KB)
Download Chapter 4 - Variables in the EZDATA File: Sex Roles, Work Motives & Leadership (213 KB)
Download Chapter 5 - Housekeeping: Transforming Variables and Adding Labels (447 KB)
Download Chapter 6 - The Frequencies Procedure: Summarizing with Descriptive Statistics (107 KB)
Download Chapter 7 - Crosstabulation: Understanding Bivariate Relationships Between Categorical Variables (238 KB)
Download Chapter 8 - Correlation: Bivariate Relationships Between Continuous Variables (116 KB)
Download Chapter 9 - Independent Samples t-test: Testing Differences Between Two Groups (135 KB)
Download Chapter 10 - Paired Samples t-test: Testing Differences Between Correlated Groups (185 KB)
Download Chapter 11 - One-Way ANOVA: Differences Between Multiple Independent Groups (280 KB)
Download Chapter 12 - Repeated Meansures ANOVA: Differences Between Correlated Groups (302 KB)
Download Chapter 13 - Factorial Independent Groups ANOVA: Two Independent Variables (271 KB)
Download Chapter 14 - Mixed-Model ANOVA: Combining Between & Within-Groups Factors (295 KB)
Download Chapter 15 - Epilogue: SPSS, Data Analysis & The EZ Research Project (163 KB)
Download Appendix - Reassurance & Help for the Nervous Novice (773 KB)
Download List of Review Videos (20 KB)
Download EZDATA.sav file (18 KB)
Publication Date
Valparaiso University
Valparaiso, Indiana
SPSS, data analysis
- Disciplines
Social Statistics | Statistics and Probability
Recommended Citation
Arkkelin, Daniel, "Using SPSS to Understand Research and Data Analysis" (2014). Psychology Curricular Materials . 1. https://scholar.valpo.edu/psych_oer/1
Since July 18, 2014
Included in
Social Statistics Commons , Statistics and Probability Commons
Advanced Search
- Notify me via email or RSS
- Collections
SPSS Beginners Tutorials

Introduction to SPSS
Spss – what is it.
IBM SPSS Statistics (or “SPSS” for short) is super easy software for editing and analyzing data.
This tutorial presents a quick overview of what SPSS looks like and how it basically works.
SPSS Data Editor Window
SPSS’ main window is the data editor. It shows our data so we can visually inspect it.
This tutorial explains how the data editor works: we'll walk you through its main parts and point out some handy tips & tricks.
SPSS Syntax Introduction
SPSS syntax is computer code used by SPSS for analyzing data , editing data, running statistical tests and more.
Using SPSS syntax is super easy and saves tons of time and effort. This tutorial quickly gets you started!
SPSS Output – Basics, Tips & Tricks
SPSS’ output window shows the tables, charts and statistical tests you run while analyzing your data.
This tutorial walks you through some basics such as exporting tables and charts to WORD or Excel. We'll also point out some important tricks such as batch editing and styling tables and charts.
SPSS - Popular Tutorials
How to run levene’s test in spss.
Levene’s test examines if 2+ populations have equal variances on some variable.
This condition -known as the homogeneity of variance assumption- is required by t-tests and ANOVA.
So how to run and interpret this test in SPSS? This simple tutorial quickly walks you through.
SPSS Factor Analysis – Beginners Tutorial
Factor analysis examines which variables in your data measure which underlying factors.
This tutorial illustrates the ideas behind factor analysis with a simple step-by-step example in SPSS.
SPSS Missing Values Tutorial
In SPSS, missing values refer to
- system missing values: values that are absent from the data;
- user missing values: values that are present in the data but must be excluded from analyses.
We'll quickly walk you through both types. We'll also show how to detect, set and deal with missing values in SPSS.
Normality Tests in SPSS
Spss shapiro-wilk test – quick tutorial with example.
The Shapiro-Wilk test examines if a variable is normally distributed in a population. This assumption is required by some statistical tests such as t-tests and ANOVA. The SW-test is an alternative for the Kolmogorov-Smirnov test. This tutorial shows how to run and interpret it in SPSS.
SPSS Kolmogorov-Smirnov Test for Normality
The Kolmogorov-Smirnov test examines if a variable is normally distributed in some population.
This “normality assumption” is required for t-tests, ANOVA and many other tests. This tutorial shows how to run and interpret a Kolmogorov-Smirnov test in SPSS with some simple examples.
Selecting Cases in SPSS
Spss if – a quick tutorial.
In SPSS, IF computes a new or existing variable but for a selection of cases only.
For example: IF(GENDER = 0) SCORE = MEAN(Q1 TO Q5). computes “score” as the mean over variables Q1 to Q5 but only for cases whose gender is 0 (female).
SPSS FILTER – Quick & Simple Tutorial
SPSS FILTER excludes a selection of cases from all subsequent analyses until you switch it off again.
Using a filter comes down to creating a (new) filter variable and activating it. This tutorial shows the easy way to do so and points out some nice alternatives as well.
SPSS SELECT IF – Tutorial & Examples
In SPSS, SELECT IF removes a selection of cases from your data.
This tutorial walks you through the basics and some FAQ's such as
- how to remove cases based on 2 variables instead of one?
- how to remove cases based on (number of) missing values?
- how to visually inspect only those cases that will be removed?
Must-Know Statistics
Effect size – a quick guide.
Effect size is an interpretable number that quantifies the difference between data and some hypothesis.
Effect size measures are useful for comparing effects across and within studies. This tutorial helps you to choose, obtain and interpret an effect size for each major statistical procedure.
Cohen’s D – Effect Size for T-Test
Cohen’s D is the effect size measure of choice for t-tests.
This simple tutorial quickly walks you through
- rules of thumb for small, medium and large effects;
- formulas for computing Cohen’s D and;
- software options for obtaining it.
Tell us what you think!
This tutorial has 116 comments:.
By Isuaiko Nkanta on October 15th, 2023
I would like to learn from you
Privacy Overview

IMAGES
VIDEO
COMMENTS
Starting in SPSS: Looking at data. Seeing what data looks like is the first step to data analysis. Open up Studentss in SPSS. choose the File menu and select Open-> Data (will need to search for wherever you downloaded the sample files) Take a look at the data and answer the following questions.
Using SPSS to Understand Research and Data Analysis . Daniel Arkkelin . Valparaiso University, [email protected] Follow this and additional works at: https://scholar.valpo.edu/psych_oer Part of the Social Statistics Commons, and the Statistics and Probability Commons . Recommended Citation
The data analysis used to answer the research objectives was descriptive and inferential statistical tests using the IBM SPSS 23.00 program. ... A Step by Step Guide to Data Analysis Using IBM ...
Figure 2. The Import Data Window for an Excel File. If you import a file in Excel, CSV (comma-separated values) or text format, SPSS will open an import wizard with a number of steps. The steps vary slightly depending on which file type you are importing. For instance, to import an Excel file, as shown in Figure 2, you first need to specify the ...
Organizations of all kinds have relied on IBM SPSS Statistics for decades to help solve a wide range of business and research problems. Explore SPSS Statistics with our interactive tutorials. SPSS Statistics offers a comprehensive set of capabilities in support of the entire analytical process from data preparation to analysis and reporting. It ...
Download Article. 1. Load your excel file with all the data. Once you have collected all the data, keep the excel file ready with all data inserted using the right tabular forms. [1] 2. Import the data into SPSS. You need to import your raw data into SPSS through your excel file. Once you import the data, the SPSS will analyse it.
The collected data underwent analysis using the Statistical Package for the Social Sciences (SPSS) Statistics 26, a commonly used software for quantitative data analysis.
This introduction concentrates on using SPSS for the exploratory phase of data analysis, then briefly discusses some commonly used statistical techniques, as follows: Page . 1. How data is input and stored in SPSS (including import from On-Line Survey and Excel) 1 2. Summary statistics and plots (for categorical data and for scale data) 4
About this book. This book is written for research students and early-career researchers to quickly and easily learn how to analyse data using SPSS. It follows commonly used logical steps in data analysis design for research. The book features SPSS screenshots to assist rapid acquisition of the techniques required to process their research data.
Description. Become an expert in statistical analysis with the most extended SPSS course at Udemy: 146 video lectures covering about 15 hours of video! Within a very short time you will master all the essential skills of an SPSS data analyst, from the simplest operations with data to the advanced multivariate techniques like logistic regression ...
This manual is an excellent companion to any undergraduate social statistics and research methods text and is ideal as a stand-alone guide for those learning to use SPSS software for the first time. Using SPSS for the Macintosh and Windows by Samuel B. Green; Neil J. Salkind. Call Number: Langson Library HA32 .G737 2003.
SPSS is a software package used for statistical analysis. It can. take data from almost any type of file. generate tabulated reports. plot distributions and trends. create charts and graphs. perform descriptive and complex statistical analyses. JMU community members can download SPSS to their computing resources.
A Beginner's Guide to Using IBM SPSS for Research Step 1: Installing and Entering Data . Before we dive into data analysis, you'll need to install IBM SPSS on your computer. Once you have it set up, create a new data file or import your existing data from sources like Excel or CSV files. You can manually enter your data or import it with a ...
The quantitative analysis, with statistical significance set at α < 0.05, was carried out using SPSS v.28, an established credibility in conducting statistical analyses for social science ...
Abstract. The purpose of this chapter is to provide a step-by-step guide for beginners on how to use SPSS to analyze health data. An example of the Iron Supplementation Study conducted by the author will be used to demonstrate data analysis techniques. The readers will first get familiar with a few basic steps before starting the data analysis ...
4. Step 4: Analyzing Data Using SPSS. Once you've selected the most suitable statistical test, the next step is to conduct data analysis using SPSS and check your output. You can use the menus, the dialog boxes, or the syntax editor to run your analysis in SPSS. You can also customize your output options, such as tables, charts, graphs, or ...
2021 NEW SERIES for SPSS 27: https://youtu.be/PN-H8GikRQ0How to Use SPSSAre you ready to learn how to use SPSS for your introductory statistics class? You ha...
A self-guided tour to help you find and analyze data using Stata, R, Excel and SPSS. The goal is to provide basic learning tools for classes, research and/or professional development
Written by esteemed social science research authors Earl R. Babbie, William E. Wagner, and Jeanne Zaino, Adventures in Social Research: Data Analysis Using IBM SPSS Statistics, Ninth Edition encourages students to practice SPSS as they read about it, providing a practical, hands-on introduction to conceptualization, measurement, and association through active learning.
Download Full Text (3.1 MB) Download Chapter 1 - First Contact: Overview of Book & SPSS Help (143 KB) Download Chapter 2 - Close Encounter: The Data Editor, Syntax & Output Viewer (446 KB) Download Chapter 3 - Point-and Click: Conducting Analyses in the Data Editor (272 KB) Download Chapter 4 - Variables in the EZDATA File: Sex Roles, Work ...
This text provides a practical, hands-on introduction to data conceptualization, measurement, and association through active learning. Students get step-by-step instruction on data analysis using the latest version of SPSS and the most current General Social Survey data. The text starts with an introduction to computerized data analysis and the social research process, then walks users through ...
SPSS syntax is computer code used by SPSS for analyzing data, editing data, running statistical tests and more. Using SPSS syntax is super easy and saves tons of time and effort. This tutorial quickly gets you started! Read more...
The study of SPSS data analysis Software is being utilised by most of the researchers in order to perform better and understand the correlation between the variables in the study. There are mainly one dependent and one independent variable which are included in the column of the SPSS software and in the row section; the data will be represented ...
The relationship between intelligent parking management and regional traffic congestion in the context of urban parcel renewal has attracted academic attention. Reasonable parking behavior analysis can effectively contribute to traffic demand management and alleviate the contradiction between parking supply and demand. To this end, this paper constructs a multinomial logit model based on ...