CBSE NCERT Solutions
NCERT and CBSE Solutions for free

Case Study Questions Chapter 3 Water Resources
Please refer to the Case Study Questions Chapter 3 Water Resources with answers provided for Class 10 Social Science. These solved case study based questions are expected to come in the Class 10 Economics exam in the current academic year. We have provided Case study for Class 10 Social Science for all chapters here. You should practise these solved case studies to get more marks in examinations.
Chapter 3 Water Resources Case Study Questions Class 10 Social Science
1. Read the source given below and answer the following questions:
Today, dams are built not just for irrigation but for electricity generation, water supply for domestic and industrial uses, flood control, recreation, inland navigation and fish breeding. Hence, dams are now referred to as multi-purpose projects where the many uses of the impounded water are integrated with one another. For example, in the Sutluj-Beas river basin, the Bhakra – Nangal project water is being used both for hydel power production and irrigation. Similarly, the Hirakud project in the Mahanadi basin integrates conservation of water with flood control. Multi-purpose projects, launched after Independence with their integrated water resources management approach, were thought of as the vehicle that would lead the nation to development and progress, overcoming the handicap of its colonial past. Jawaharlal Nehru proudly proclaimed the dams as the ‘temples of modern India’; the reason being that it would integrate development of agriculture and the village economy with rapid industrialisation and growth of the urban economy.
Answer the following MCQs by choosing the most appropriate option.
(i) Which of the following multipurpose projects is found in the Satluj-Beas river basin? (a) Hirakud project (b) Damodar Valley Corporation (c) Bhakra Nangal Project (d) Rihand Project
(ii) Hirakund dam is built on which river? (a) Chenab (b) Mahanadi (c) Krishna (d) Satluj
(iii) For which of the following purposes were dams traditionally built? (a) For generating electricity (b) For supplying water to industries (c) For Flood control (d) To impound river and rain water for irrigation
(iv) Which one of the following is not an adverse effect of dams? (a) Interstate water disputes (b) Excessive sedimentation of Reservoir (c) Displacement of population (d) Flood control
2. Read the source given below and answer the following questions:
Many thought that given the disadvantages and rising resistance against the multipurpose projects, water harvesting system was a viable alternative, both socio-economically and environmentally. In ancient India, along with the sophisticated hydraulic structures, there existed an extraordinary tradition of water-harvesting system. People had in-depth knowledge of rainfall regimes and soil types and developed wide ranging techniques to harvest rainwater, groundwater, river water and flood water in keeping with the local ecological conditions and their water needs. In hill and mountainous regions, people built diversion channels like the ‘guls’ or ‘kuls’ of the Western Himalayas for agriculture. ‘Rooftop rainwater harvesting’ was commonly practised to store drinking water, particularly in Rajasthan. In the flood plains of Bengal, people developed inundation channels to irrigate their fields. In arid and semi-arid regions, agricultural fields were converted into rain fed storage structures that allowed the water to stand and moisten the soil like the ‘khadins’ in Jaisalmer and ‘Johads’ in other parts of Rajasthan. In the semi-arid and arid regions of Rajasthan, particularly in Bikaner, Phalodi and Barmer, almost all the houses traditionally had underground tanks or tankas for storing drinking water.
(i) Agricultural fields which are used as rainfed storage structures are called: (a) Kuls (b) Khadins/Johads (c) Recharge pits (d) None of the above
(ii) In which of the following regions, people built ‘Guls’ and ‘Kuls’ for irrigation? (a) Northern Plains (b) Western Himalayas (c) Coastal areas (d) None of these
(iii) The diversion channels seen in the Western Himalayas are called: (a) Guls or Kuls (b) Khadins (c) Johads (d) Recharge pits
(iv) Underground tanks seen in Rajasthan to store rainwater for drinking is called: (a) Tankas (b) Khadis (c) Ponds (d) Kuls

Related Posts

Case Study Questions Chapter 2 Federalism

Periodic Classification of Elements Class 10 Science Important Questions

Our Environment Class 10 Science Important Questions
Case Studies
Our cutting-edge research builds a body of science with direct, actionable results. View the case studies below to learn more.
Practical Considerations for the Incorporation of Biomass Fermentation into Enhanced Biological Phosphorus Removal
Utility analysis and improvement methodology: case studies, food waste co-digestion at derry township municipal authority (pa): business case analysis case study, food waste co-digestion at los angeles county sanitation districts (ca): business case analysis case study, food waste co-digestion at east bay municipal utility district (ca): business case analysis snapshot, food waste co-digestion at oneida county water pollution control plant (ny): business case analysis snapshot, food waste co-digestion at central marin sanitation agency (ca): business case analysis case study, food waste co-digestion at hermitage municipal authority (pa): business case analysis snapshot, food waste co-digestion at city of stevens point public utilities department (wi): business case analysis case study, distributed water case studies.

Ground Water Vulnerability Assessment: Predicting Relative Contamination Potential Under Conditions of Uncertainty (1993)
Chapter: 5 case studies, 5 case studies, introduction.
This chapter presents six case studies of uses of different methods to assess ground water vulnerability to contamination. These case examples demonstrate the wide range of applications for which ground water vulnerability assessments are being conducted in the United States. While each application presented here is directed toward the broad goal of protecting ground water, each is unique in its particular management requirements. The intended use of the assessment, the types of data available, the scale of the assessments, the required resolution, the physical setting, and institutional factors all led to very different vulnerability assessment approaches. In only one of the cases presented here, Hawaii, are attempts made to quantify the uncertainty associated with the assessment results.
Introduction
Ground water contamination became an important political and environmental issue in Iowa in the mid-1980s. Research reports, news headlines, and public debates noted the increasing incidence of contaminants in rural and urban well waters. The Iowa Ground water Protection Strategy (Hoyer et al. 1987) indicated that levels of nitrate in both private and municipal
wells were increasing. More than 25 percent of the state's population was served by water with concentrations of nitrate above 22 milligrams per liter (as NO 3 ). Similar increases were noted in detections of pesticides in public water supplies; about 27 percent of the population was periodically consuming low concentrations of pesticides in their drinking water. The situation in private wells which tend to be shallower than public wells may have been even worse.
Defining the Question
Most prominent among the sources of ground water contamination were fertilizers and pesticides used in agriculture. Other sources included urban use of lawn chemicals, industrial discharges, and landfills. The pathways of ground water contamination were disputed. Some interests argued that contamination occurs only when a natural or human generated condition, such as sinkholes or agricultural drainage wells, provides preferential flow to underground aquifers, resulting in local contamination. Others suggested that chemicals applied routinely to large areas infiltrate through the vadose zone, leading to widespread aquifer contamination.
Mandate, Selection, and Implementation
In response to growing public concern, the state legislature passed the Iowa Ground water Protection Act in 1987. This landmark statute established the policy that further contamination should be prevented to the "maximum extent practical" and directed state agencies to launch multiyear programs of research and education to characterize the problem and identify potential solutions.
The act mandated that the Iowa Department of Natural Resources (DNR) assess the vulnerability of the state's ground water resources to contamination. In 1991, DNR released Ground water Vulnerability Regions of Iowa , a map developed specifically to depict the intrinsic susceptibility of ground water resources to contamination by surface or near-surface activities. This assessment had three very limited purposes: (1) to describe the physical setting of ground water resources in the state, (2) to educate policy makers and the public about the potential for ground water contamination, and (3) to provide guidance for planning and assigning priorities to ground water protection efforts in the state.
Unlike other vulnerability assessments, the one in Iowa took account of factors that affect both ground water recharge and well development. Ground water recharge involves issues related to aquifer contamination; well development involves issues related to contamination of water supplies in areas where sources other than bedrock aquifers are used for drinking water. This
approach considers jointly the potential impacts of contamination on the water resource in aquifers and on the users of ground water sources.
The basic principle of the Iowa vulnerability assessment involves the travel time of water from the land surface to a well or an aquifer. When the time is relatively short (days to decades), vulnerability is considered high. If recharge occurs over relatively long periods (centuries to millennia), vulnerability is low. Travel times were determined by evaluating existing contaminants and using various radiometric dating techniques. The large reliance on travel time in the Iowa assessment likely results in underestimation of the potential for eventual contamination of the aquifer over time.
The most important factor used in the assessment was thickness of overlying materials which provide natural protection to a well or an aquifer. Other factors considered included type of aquifer, natural water quality in an aquifer, patterns of well location and construction, and documented occurrences of well contamination. The resulting vulnerability map ( Plate 1 ) delineates regions having similar combinations of physical characteristics that affect ground water recharge and well development. Qualitative ratings are assigned to the contamination potential for aquifers and wells for various types and locations of water sources. For example, the contamination potential for wells in alluvial aquifers is considered high, while the potential for contamination of a variable bedrock aquifer protected by moderate drift or shale is considered low.
Although more sophisticated approaches were investigated for use in the assessment, ultimately no complex process models of contaminant transport were used and no distinction was made among Iowa's different soil types. The DNR staff suggested that since the soil cover in most of the state is such a small part of the overall aquifer or well cover, processes that take place in those first few inches are relatively similar and, therefore, insignificant in terms of relative susceptibilities to ground water contamination. The results of the vulnerability assessment followed directly from the method's assumptions and underlying principles. In general, the thicker the overlay of clayey glacial drift or shale, the less susceptible are wells or aquifers to contamination. Where overlying materials are thin or sandy, aquifer and well susceptibilities increase. Vulnerability is also greater in areas where sinkholes or agricultural drainage wells allow surface and tile water to bypass natural protective layers of soil and rapidly recharge bedrock aquifers.
Basic data on geologic patterns in the state were extrapolated to determine the potential for contamination. These data were supplemented by databases on water contamination (including the Statewide Rural Well-Water Survey conducted in 1989-1990) and by research insights into the transport, distribution, and fate of contaminants in ground water. Some of the simplest data needed for the assessment were unavailable. Depth-to-bedrock information had never been developed, so surface and bedrock topographic
maps were revised and integrated to create a new statewide depth-to-bedrock map. In addition, information from throughout the state was compiled to produce the first statewide alluvial aquifer map. All new maps were checked against available well-log data, topographic maps, outcrop records, and soil survey reports to assure the greatest confidence in this information.
While the DNR was working on the assessment, it was also asked to integrate various types of natural resource data into a new computerized geographic information system (GIS). This coincident activity became a significant contributor to the assessment project. The GIS permitted easier construction of the vulnerability map and clearer display of spatial information. Further, counties or regions in the state can use the DNR geographic data and the GIS to explore additional vulnerability parameters and examine particular areas more closely to the extent that the resolution of the data permits.
The Iowa vulnerability map was designed to provide general guidance in planning and ranking activities for preventing contamination of aquifers and wells. It is not intended to answer site-specific questions, cannot predict contaminant concentrations, and does not even rank the different areas of the state by risk of contamination. Each of these additional uses would require specific assessments of vulnerability to different activities, contaminants, and risk. The map is simply a way to communicate qualitative susceptibility to contamination from the surface, based on the depth and type of cover, natural quality of the aquifer, well location and construction, and presence of special features that may alter the transport of contaminants.
Iowa's vulnerability map is viewed as an intermediate product in an ongoing process of learning more about the natural ground water system and the effects of surface and near-surface activities on that system. New maps will contain some of the basic data generated by the vulnerability study. New research and data collection will aim to identify ground water sources not included in the analysis (e.g., buried channel aquifers and the "salt and pepper sands" of western Iowa). Further analyses of existing and new well water quality data will be used to clarify relationships between aquifer depth and ground water contamination. As new information is obtained, databases and the GIS will be updated. Over time, new vulnerability maps may be produced to reflect new data or improved knowledge of environmental processes.
The Cape Cod sand and gravel aquifer is the U.S. Environmental Protection Agency (EPA) designated sole source of drinking water for Barnstable County, Massachusetts (ca. 400 square miles, winter population 186,605 in 1990, summer population ca. 500,000) as well as the source of fresh water for numerous kettle hole ponds and marine embayments. During the past 20 years, a period of intense development of open land accompanied by well-reported ground water contamination incidents, Cape Cod has been the site of intensive efforts in ground water management and analysis by many organizations, including the Association for the Preservation of Cape Cod, the U.S. Geological Survey, the Massachusetts Department of Environmental Protection (formerly the Department of Environmental Quality Engineering), EPA, and the Cape Cod Commission (formerly the Cape Cod Planning and Economic Development Commission). An earlier NRC publication, Ground Water Quality Protection: State and Local Strategies (1986) summarizes the Cape Cod ground water protection program.
The Area Wide Water Quality Management Plan for Cape Cod (CCPEDC 1978a, b), prepared in response to section 208 of the federal Clean Water Act, established a management strategy for the Cape Cod aquifer. The plan emphasized wellhead protection of public water supplies, limited use of public sewage collection systems and treatment facilities, and continued general reliance on on-site septic systems, and relied on density controls for regulation of nitrate concentrations in public drinking water supplies. The water quality management planning program began an effort to delineate the zones of contribution (often called contributing areas) for public wells on Cape Cod that has become increasingly sophisticated over the years. The effort has grown to address a range of ground water resources and ground water dependent resources beyond the wellhead protection area, including fresh and marine surface waters, impaired areas, and water quality improvement areas (CCC 1991). Plate 2 depicts the water resources classifications for Cape Cod.
Selection and Implementation of Approaches
The first effort to delineate the contributing area to a public water supply well on Cape Cod came in 1976 as part of the initial background studies for the Draft Area Wide Water Quality Management Plan for Cape
Cod (CCPEDC 1978a). This effort used a simple mass balance ratio of a well's pumping volume to an equal volume average annual recharge evenly spread over a circular area. This approach, which neglects any hydrogeologic characteristics of the aquifer, results in a number of circles of varying radii that are centered at the wells.
The most significant milestone in advancing aquifer protection was the completion of a regional, 10 foot contour interval, water table map of the county by the USGS (LeBlanc and Guswa 1977). By the time that the Draft and Final Area Wide Water Quality Management Plans were published (CCPEDC 1978a, b), an updated method for delineating zones of contribution, using the regional water table map, had been developed. This method used the same mass balance approach to characterize a circle, but also extended the zone area by 150 percent of the circle's radius in the upgradient direction. In addition, a water quality watch area extending upgradient from the zone to the ground water divide was recommended. Although this approach used the regional water table map for information on ground water flow direction, it still neglected the aquifer's hydrogeologic parameters.
In 1981, the USGS published a digital model of the aquifer that included regional estimates of transmissivity (Guswa and LeBlanc 1981). In 1982, the CCPEDC used a simple analytical hydraulic model to describe downgradient and lateral capture limits of a well in a uniform flow field (Horsley 1983). The input parameters required for this model included hydraulic gradient data from the regional water table map and transmissivity data from the USGS digital model. The downgradient and lateral control points were determined using this method, but the area of the zone was again determined by the mass balance method. Use of the combined hydraulic and mass balance method resulted in elliptical zones of contribution that did not extend upgradient to the ground water divide. This combined approach attempted to address three-dimensional ground water flow beneath a partially penetrating pumping well in a simple manner.
At about the same time, the Massachusetts Department of Environmental Protection started the Aquifer Lands Acquisition (ALA) Program to protect land within zones of contribution that would be delineated by detailed site-specific studies. Because simple models could not address three-dimensional flow and for several other reasons, the ALA program adopted a policy that wellhead protection areas or Zone IIs (DEP-WS 1991) should be extended upgradient all the way to a ground water divide. Under this program, wells would be pump tested for site-specific aquifer parameters and more detailed water table mapping would often be required. In many cases, the capture area has been delineated by the same simple hydraulic analytical model but the zone has been extended to the divide. This method has resulted in some 1989 zones that are 3,000 feet wide and extend 4.5
miles upgradient, still without a satisfactory representation of three-dimensional flow to the well.
Most recently the USGS (Barlow 1993) has completed a detailed subregional, particle-tracking three-dimensional ground water flow model that shows the complex nature of ground water flow to wells. This approach has shown that earlier methods, in general, overestimate the area of zones of contribution (see Figure 5.1 ).
In 1988, the public agencies named above completed the Cape Cod Aquifer Management Project (CCAMP), a resource-based ground water protection study that used two towns, Barnstable and Eastham, to represent the more and less urbanized parts of Cape Cod. Among the CCAMP products were a GIS-based assessment of potential for contamination as a result of permissible land use changes in the Barnstable zones of contribution (Olimpio et al. 1991) and a ground water vulnerability assessment by Heath (1988) using DRASTIC for the same area. Olimpio et al. characterized land uses by ranking potential contaminant sources without regard to differences in vulnerability within the zones. Heath's DRASTIC analysis of the same area, shown in Figure 5.2 , delineated two distinct zones of vulnerability based on hydrogeologic setting. The Sandwich Moraine setting, with deposits of silt, sand and gravel, and depths to ground water ranging from 0 to more than 125 feet, had DRASTIC values of 140 to 185; the Barnstable Outwash Plain, with permeable sand and fine gravel deposits with beds of silt and clay and depths to ground water of less than 50 feet, yielded values of 185 to 210. The DRASTIC scores and relative contributions of the factors are shown in Tables 5.1 and 5.2 . Heath concluded that similar areas of Cape Cod would produce similar moderate to high vulnerability DRASTIC scores. The CCAMP project also addressed the potential for contamination of public water supply wells from new land uses allowable under existing zoning for the same area. The results of that effort are shown in Plate 4 .
In summary, circle zones were used initially when the hydrogeologic nature of the aquifer or of hydraulic flow to wells was little understood. The zones improved with an understanding of ground water flow and aquifer characteristics, but in recognition of the limitations of regional data, grossly conservative assumptions came into use. Currently, a truer delineation of a zone of contribution can be prepared for a given scenario using sophisticated models and highly detailed aquifer characterization. However, the area of a given zone still is highly dependent on the initial assumptions that dictate how much and in what circumstances a well is pumped. In the absence of ability to specify such conditions, conservative assumptions,
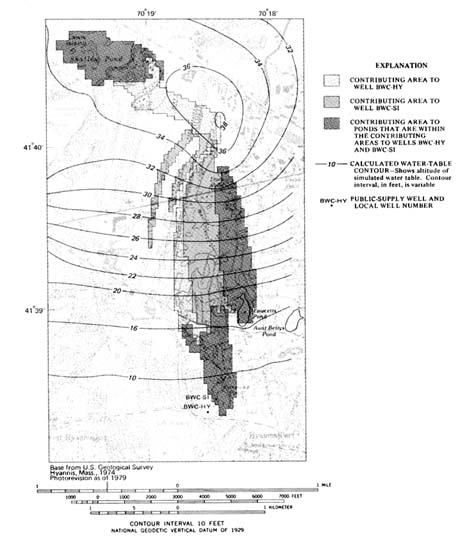
FIGURE 5.1 Contributing areas of wells and ponds in the complex flow system determined by using the three-dimensional model with 1987 average daily pumping rates. (Barlow 1993)
such as maximum prolonged pumping, prevail, and, therefore, conservatively large zones of contribution continue to be used for wellhead protection.
The ground water management experience of Cape Cod has resulted in a better understanding of the resource and the complexity of the aquifer
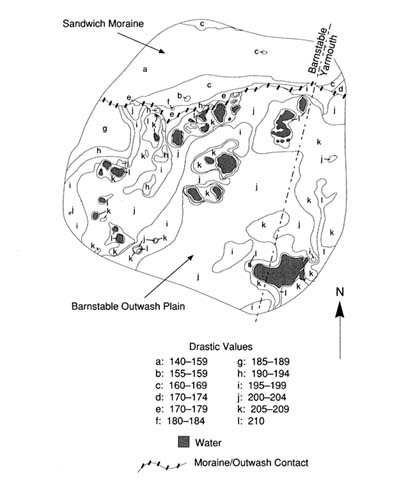
FIGURE 5.2 DRASTIC contours for Zone 1, Barnstable-Yarmouth, Massachusetts.
system, as well as the development of a more ambitious agenda for resource protection. Beginning with goals of protection of existing public water supplies, management interests have grown to include the protection of private wells, potential public supplies, fresh water ponds, and marine embayments. Public concerns over ground water quality have remained high and were a major factor in the creation of the Cape Cod Commission by the Massachusetts legislature. The commission is a land use planning and regulatory agency with broad authority over development projects and the ability to create special resource management areas. The net result of 20 years of effort by many individuals and agencies is the application of
TABLE 5.1 Ranges, Rating, and Weights for DRASTIC Study of Barnstable Outwash Plain Setting (NOTE: gpd/ft 2 = gallons per day per square foot) (Heath 1988)
TABLE 5.2 Ranges, Rating, and Weights for DRASTIC Study of Sandwich Moraine Setting (NOTE: gpd/ft 2 = gallons per day per square foot) (Heath 1988)
higher protection standards to broader areas of the Cape Cod aquifer. With some exceptions for already impaired areas, a differentiated resource protection approach in the vulnerable aquifer setting of Cape Cod has resulted in a program that approaches universal ground water protection.
Florida has 13 million residents and is the fourth most populous state (U.S. Bureau of the Census 1991). Like several other sunbelt states, Florida's population is growing steadily, at about 1,000 persons per day, and is estimated to reach 17 million by the year 2000. Tourism is the biggest industry in Florida, attracting nearly 40 million visitors each year. Ground water is the source of drinking water for about 95 percent of Florida's population; total withdrawals amount to about 1.5 billion gallons per day. An additional 3 billion gallons of ground water per day are pumped to meet the needs of agriculture—a $5 billion per year industry, second only to tourism in the state. Of the 50 states, Florida ranks eighth in withdrawal of fresh ground water for all purposes, second for public supply, first for rural domestic and livestock use, third for industrial/commercial use, and ninth for irrigation withdrawals.
Most areas in Florida have abundant ground water of good quality, but the major aquifers are vulnerable to contamination from a variety of land use activities. Overpumping of ground water to meet the growing demands of the urban centers, which accounts for about 80 percent of the state's population, contributes to salt water intrusion in coastal areas. This overpumping is considered the most significant problem for degradation of ground water quality in the state. Other major sources of ground water contaminants include: (1) pesticides and fertilizers (about 2 million tons/year) used in agriculture, (2) about 2 million on-site septic tanks, (3) more than 20,000 recharge wells used for disposing of stormwater, treated domestic wastewater, and cooling water, (4) nearly 6,000 surface impoundments, averaging one per 30 square kilometers, and (5) phosphate mining activities that are estimated to disturb about 3,000 hectares each year.
The Hydrogeologic Setting
The entire state is in the Coastal Plain physiographic province, which has generally low relief. Much of the state is underlain by the Floridan aquifer system, largely a limestone and dolomite aquifer that is found in both confined and unconfined conditions. The Floridan is overlain through most of the state by an intermediate aquifer system, consisting of predominantly clays and sands, and a surficial aquifer system, consisting of predominantly sands, limestone, and dolomite. The Floridan is one of the most productive aquifers in the world and is the most important source of drinking water for Florida residents. The Biscayne, an unconfined, shallow, limestone aquifer located in southeast Florida, is the most intensively used
aquifer and the sole source of drinking water for nearly 3 million residents in the Miami-Palm Beach coastal area. Other surficial aquifers in southern Florida and in the western panhandle region also serve as sources of ground water.
Aquifers in Florida are overlain by layers of sand, clay, marl, and limestone whose thickness may vary considerably. For example, the thickness of layers above the Floridan aquifer range from a few meters in parts of west-central and northern Florida to several hundred meters in south-central Florida and in the extreme western panhandle of the state. Four major groups of soils (designated as soil orders under the U.S. Soil Taxonomy) occur extensively in Florida. Soils in the western highlands are dominated by well-drained sandy and loamy soils and by sandy soils with loamy subsoils; these are classified as Ultisols and Entisols. In the central ridge of the Florida peninsula, are found deep, well-drained, sandy soils (Entisols) as well as sandy soils underlain by loamy subsoils or phosphatic limestone (Alfisols and Ultisols). Poorly drained sandy soils with organic-rich and clay-rich subsoils, classified as Spodosols, occur in the Florida flatwoods. Organic-rich muck soils (Histosols) underlain by muck or limestone are found primarily in an area extending south of Lake Okeechobee.
Rainfall is the primary source of ground water in Florida. Annual rainfall in the state ranges from 100 to 160 cm/year, averaging 125 cm/year, with considerable spatial (both local and regional) and seasonal variations in rainfall amounts and patterns. Evapotranspiration (ET) represents the largest loss of water; ET ranges from about 70 to 130 cm/year, accounting for between 50 and 100 percent of the average annual rainfall. Surface runoff and ground water discharge to streams averages about 30 cm/year. Annual recharge to surficial aquifers ranges from near zero in perennially wet, lowland areas to as much as 50 cm/year in well-drained areas; however, only a fraction of this water recharges the underlying Floridan aquifer. Estimates of recharge to the Floridan aquifer vary from less than 3 cm/year to more than 25 cm/year, depending on such factors as weather patterns (e.g., rainfall-ET balance), depth to water table, soil permeability, land use, and local hydrogeology.
Permeable soils, high net recharge rates, intensively managed irrigated agriculture, and growing demands from urban population centers all pose considerable threat of ground water contamination. Thus, protection of this valuable natural resource while not placing unreasonable constraints on agricultural production and urban development is the central focus of environmental regulation and growth management in Florida.
Along with California, Florida has played a leading role in the United
States in development and enforcement of state regulations for environmental protection. Detection in 1983 of aldicarb and ethylene dibromide, two nematocides used widely in Florida's citrus groves, crystallized the growing concerns over ground water contamination and the need to protect this vital natural resource. In 1983, the Florida legislature passed the Water Quality Assurance Act, and in 1984 adopted the State and Regional Planning Act. These and subsequent legislative actions provide the legal basis and guidance for the Ground Water Strategy developed by the Florida Department of Environmental Regulation (DER).
Ground water protection programs in Florida are implemented at federal, state, regional, and local levels and involve both regulatory and nonregulatory approaches. The most significant nonregulatory effort involves more than 30 ground water studies being conducted in collaboration with the Water Resources Division of the U.S. Geological Survey. At the state level, Florida statutes and administrative codes form the basis for regulatory actions. Although DER is the primary agency responsible for rules and statutes designed to protect ground water, the following state agencies participate to varying degrees in their implementation: five water management districts, the Florida Geological Survey, the Department of Health and Rehabilitative Services (HRS), the Department of Natural Resources, and the Florida Department of Agriculture and Consumer Services (DACS). In addition, certain interagency committees help coordinate the development and implementation of environmental codes in the state. A prominent example is the Pesticide Review Council which offers guidance to the DACS in developing pesticide use regulation. A method for screening pesticides in terms of their chronic toxicity and environmental behavior has been developed through collaborative efforts of the DACS, the DER, and the HRS (Britt et al. 1992). This method will be used to grant registration for pesticide use in Florida or to seek additional site-specific field data.
Selecting an Approach
The emphasis of the DER ground water program has shifted in recent years from primarily enforcement activity to a technically based, quantifiable, planned approach for resource protection.
The administrative philosophy for ground water protection programs in Florida is guided by the following principles:
Ground water is a renewable resource, necessitating a balance between withdrawals and natural or artificial recharge.
Ground water contamination should be prevented to the maximum degree possible because cleanup of contaminated aquifers is technically or economically infeasible.
It is impractical, perhaps unnecessary, to require nondegradation standards for all ground water in all locations and at all times.
The principle of ''most beneficial use" is to be used in classifying ground water into four classes on the basis of present quality, with the goal of attaining the highest level protection of potable water supplies (Class I aquifers).
Part of the 1983 Water Quality Assurance Act requires Florida DER to "establish a ground water quality monitoring network designed to detect and predict contamination of the State's ground water resources" via collaborative efforts with other state and federal agencies. The three basic goals of the ground water quality monitoring program are to:
Establish the baseline water quality of major aquifer systems in the state,
Detect and predict changes in ground water quality resulting from the effects of various land use activities and potential sources of contamination, and
Disseminate to local governments and the public, water quality data generated by the network.
The ground water monitoring network established by DER to meet the goals stated above consists of two major subnetworks and one survey (Maddox and Spicola 1991). Approximately 1,700 wells that tap all major potable aquifers in the state form the Background Network, which was designed to help define the background water quality. The Very Intensively Studied Area (VISA) network was established to monitor specific areas of the state considered highly vulnerable to contamination; predominant land use and hydrogeology were the primary attributes used to evaluate vulnerability. The DRASTIC index, developed by EPA, served as the basis for statewide maps depicting ground water vulnerability. Data from the VISA wells will be compared to like parameters sampled from Background Network wells in the same aquifer segment. The final element of the monitoring network is the Private Well Survey, in which up to 70 private wells per county will be sampled. The sampling frequency and chemical parameters to be monitored at each site are based on several factors, including network well classification, land use activities, hydrogeologic sensitivity, and funding. In Figure 5.3 , the principal aquifers in Florida are shown along with the distribution of the locations of the monitoring wells in the Florida DER network.
The Preservation 2000 Act, enacted in 1990, mandated that the Land Acquisition Advisory Council (LAAC) "provide for assessing the importance
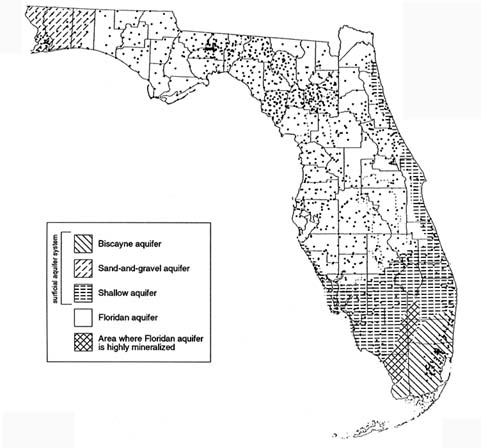
FIGURE 5.3 Principal aquifers in Florida and the network of sample wells as of March 1990 (1642 wells sampled). (Adapted from Maddox and Spicola 1991, and Maddox et al. 1993.)
of acquiring lands which can serve to protect or recharge ground water, and the degree to which state land acquisition programs should focus on purchasing such land." The Ground Water Resources Committee, a subcommittee of the LAAC, produced a map depicting areas of ground water significance at regional scale (1:500,000) (see Figure 5.4 ) to give decision makers the basis for considering ground water as a factor in land acquisition under the Preservation 2000 Act (LAAC 1991). In developing maps for their districts, each of the five water management districts (WMDs) used the following criteria: ground water recharge, ground water quality, aquifer vulnerability, ground water availability, influence of existing uses on the resource, and ground water supply. The specific approaches used by
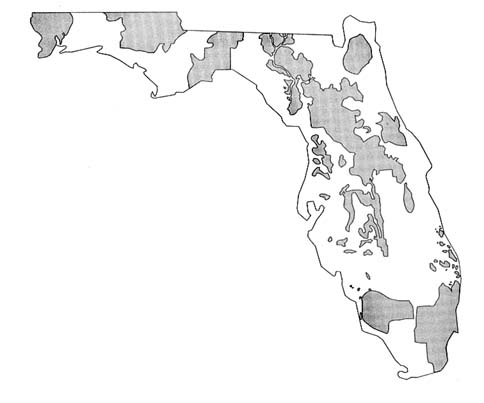
FIGURE 5.4 General areas of ground water significance in Florida. (Map provided by Florida Department of Environmental Regulation, Bureau of Drinking Water and Ground Water Resources.)
the WMDs varied, however. For example, the St. Johns River WMD used a GIS-based map overlay and DRASTIC-like numerical index approach that rated the following attributes: recharge, transmissivity, water quality, thickness of potable water, potential water expansion areas, and spring flow capture zones. The Southwest Florida WMD also used a map overlay and index approach which considered four criteria, and GIS tools for mapping. Existing databases were considered inadequate to generate a DRASTIC map for the Suwannee River WMD, but the map produced using an overlay approach was considered to be similar to DRASTIC maps in providing a general depiction of aquifer vulnerability.
In the November 1988, Florida voters approved an amendment to the Florida Constitution allowing land producing high recharge to Florida's aquifers to be classified and assessed for ad valorem tax purposes based on character or use. Such recharge areas are expected to be located primarily in the upland, sandy ridge areas. The Bluebelt Commission appointed by the 1989 Florida Legislature, studied the complex issues involved and recommended that the tax incentive be offered to owners of such high recharge areas if their land is left undeveloped (SFWMD 1991). The land eligible
for classification as "high water recharge land" must meet the following criteria established by the commission:
The parcel must be located in the high recharge areas designated on maps supplied by each of the five WMDs.
The high recharge area of the parcel must be at least 10 acres.
The land use must be vacant or single-family residential.
The parcel must not be receiving any other special assessment, such as Greenbelt classification for agricultural lands.
Two bills related to the implementation of the Bluebelt program are being considered by the 1993 Florida legislation.
THE SAN JOAQUIN VALLEY
Pesticide contamination of ground water resources is a serious concern in California's San Joaquin Valley (SJV). Contamination of the area's aquifer system has resulted from a combination of natural geologic conditions and human intervention in exploiting the SJV's natural resources. The SJV is now the principal target of extensive ground water monitoring activities in the state.
Agriculture has imposed major environmental stresses on the SJV. Natural wetlands have been drained and the land reclaimed for agricultural purposes. Canal systems convey water from the northern, wetter parts of the state to the south, where it is used for irrigation and reclamation projects. Tens of thousands of wells tap the sole source aquifer system to supply water for domestic consumption and crop irrigation. Cities and towns have sprouted throughout the region and supply the human resources necessary to support the agriculture and petroleum industries.
Agriculture is the principal industry in California. With 1989 cash receipts of more than $17.6 billion, the state's agricultural industry produced more than 50 percent of the nation's fruits, nuts, and vegetables on 3 percent of the nation's farmland. California agriculture is a diversified industry that produces more than 250 crop and livestock commodities, most of which can be found in the SJV.
Fresno County, the largest agricultural county in the state, is situated in the heart of the SJV, between the San Joaquin River to the north and the Kings River on the south. Grapes, stone fruits, and citrus are important commodities in the region. These and many other commodities important to the region are susceptible to nematodes which thrive in the county's coarse-textured soils.
While agricultural diversity is a sound economic practice, it stimulates the growth of a broad range of pest complexes, which in turn dictates greater reliance on agricultural chemicals to minimize crop losses to pests, and maintain productivity and profit. Domestic and foreign markets demand high-quality and cosmetically appealing produce, which require pesticide use strategies that rely on pest exclusion and eradication rather than pest management.
Hydrogeologic Setting
The San Joaquin Valley (SJV) is at the southern end of California's Central Valley. With its northern boundary just south of Sacramento, the Valley extends in a southeasterly direction about 400 kilometers (250 miles) into Kern County. The SJV averages 100 kilometers (60 miles) in width and drains the area between the Sierra Nevada on the east and the California Coastal Range on the west. The rain shadow caused by the Coastal Range results in the predominantly xeric habitat covering the greater part of the valley floor where the annual rainfall is about 25 centimeters (10 inches). The San Joaquin River is the principal waterway that drains the SJV northward into the Sacramento Delta region.
The soils of the SJV vary significantly. On the west side of the valley, soils are composed largely of sedimentary materials derived from the Coastal Range; they are generally fine-textured and slow to drain. The arable soils of the east side developed on relatively unweathered, granitic sediments. Many of these soils are wind-deposited sands underlain by deep coarse-textured alluvial materials.
From the mid-1950s until 1977, dibromochloropropane (DBCP) was the primary chemical used to control nematodes. DBCP has desirable characteristics for a nematocide. It is less volatile than many other soil fumigants, such as methylbromide; remains active in the soil for a long time, and is effective in killing nematodes. However, it also causes sterility in human males, is relatively mobile in soil, and is persistent. Because of the health risks associated with consumption of DBCP treated foods, the nematocide was banned from use in the United States in 1979. After the ban, several well water studies were conducted in the SJV by state, county and local authorities. Thirteen years after DBCP was banned, contamination of well waters by the chemical persists as a problem in Fresno County.
Public concern over pesticides in ground water resulted in passage of the California Pesticide Contamination Prevention Act (PCPA) of 1985. It is a broad law that establishes the California Department of Pesticide Regulation
as the lead agency in dealing with issues of ground water contamination by pesticides. The PCPA specifically requires:
pesticide registrants to collect and submit specific chemical and environmental fate data (e.g., water solubility, vapor pressure, octanol-water partition coefficient, soil sorption coefficient, degradation half-lives for aerobic and anaerobic metabolism, Henry's Law constant, hydrolysis rate constant) as part of the terms for registration and continued use of their products in California.
establishment of numerical criteria or standards for physical-chemical characteristics and environmental fate data to determine whether a pesticide can be registered in the state that are at least as stringent as those standards set by the EPA,
soil and water monitoring investigations be conducted on:
pesticides with properties that are in violation of the physical-chemical standards set in 2 above, and
pesticides, toxic degradation products or other ingredients that are:
contaminants of the state's ground waters, or
found at the deepest of the following soil depths:
2.7 meters (8 feet) below the soil surface,
below the crop root zone, or
below the microbial zone, and
creation of a database of wells sampled for pesticides with a provision requiring all agencies to submit data to the California Department of Pesticide Regulation (CDPR).
Difficulties associated with identifying the maximum depths of root zone and microbial zone have led to the establishment of 8 feet as a somewhat arbitrary but enforceable criterion for pesticide leaching in soils.
Selection and Implementation of an Approach
Assessment of ground water vulnerability to pesticides in California is a mechanical rather than a scientific process. Its primary goal is compliance with the mandates established in the PCPA. One of these mandates requires that monitoring studies be conducted in areas of the state where the contaminant pesticide is used, in other areas exhibiting high risk portraits (e.g., low organic carbon, slow soil hydrolysis, metabolism, or dissipation), and in areas where pesticide use practices present a risk to the state's ground water resources.
The numerical value for assessments was predetermined by the Pesticide Use Report (PUR) system employed in the state. Since the early
1970s, California has required pesticide applicators to give local authorities information on the use of restricted pesticides. This requirement was extended to all pesticides beginning in 1990. Application information reported includes names of the pesticide(s) and commodities, the amount applied, the formulation used, and the location of the commodity to the nearest section (approximately 1 square mile) as defined by the U.S. Rectangular Coordinate System. In contrast to most other states that rely on county pesticide sales in estimating pesticide use, California can track pesticide use based on quantities applied to each section. Thus, the section, already established as a political management unit, became the basic assessment unit.
The primary criteria that subject a pesticide to investigation as a ground water pollutant are:
detection of the pesticide or its metabolites in well samples, or
its failure to conform to the physical-chemical standards set in accordance with the PCPA, hence securing its position on the PCPA's Ground Water Protection List of pesticides having a potential to pollute ground water.
In either case, relatively large areas surrounding the original detection site or, in the latter case, high use regions are monitored via well surveys. Positive findings automatically increase the scope of the surveys, and since no tolerance levels are specified in the PCPA, any detectable and confirmed result establishes a pesticide as a contaminant.
When a pesticide or its degradation products is detected in a well water sample and the pesticide is judged to have contaminated the water source as a result of a legal agricultural use, the section the well is in is declared a Pesticide Management Zone (PMZ). Further application of the detected pesticide within PMZ boundaries may be prohibited or restricted, depending on the degree of contamination and subject to the availability of tried and tested modifications in management practices addressing environmental safety in use of the pesticide. PMZs are pesticide-specific—each contaminant pesticide has its own set of PMZs which may or may not overlap PMZs assigned another pesticide. Currently, consideration is being given to the extension of PMZs established for one chemical to other potential pesticide pollutants. In addition to monitoring activities in PMZs, protocols have been written to monitor ground water in sections adjacent to a PMZ. Monitoring of adjacent sections has resulted in many new PMZs. Currently, California has 182 PMZs involving five registered pesticides.
California has pursued this mechanical approach to assessing ground water vulnerability to pesticides for reasons that cover a spectrum of political, economic, and practical concerns. As noted earlier, the scale of the assessment unit was set at the section level because it is a well-defined
geopolitical unit used in the PUR system. Section boundaries frequently are marked by roads and highways, which allows the section to be located readily and makes enforcement of laws and regulations more practical. California law also requires that well logs be recorded by drillers for all wells in the state. Well-site information conforms to the U.S. Rectangular Coordinate System's township, range, and section system.
The suitability and reliability of databases available for producing vulnerability assessments was a great concern before passage of the PCPA in 1985. Soil survey information holds distinct advantages for producing assessments and developing best management practices strategies, but it was not available in a format that could work in harmony with PUR sections. To date, several areas of the SJV are not covered by a modern soil survey; they include the western part of Tulare County, which contains 34 PMZs. Other vadose zone data were sparse, it available at all.
The use of models was not considered appropriate, given the available data and because no single model could cope with the circumstances in which contaminated ground water sources were being discovered in the state. While most cases of well contamination were associated with the coarse-textured soils of the SJV and the Los Angeles Basin, several cases were noted in areas of the Central Valley north of the SJV, where very dense fine-textured soils (vertisols and other cracking clays) were dominant.
The potential vagaries and uncertainties associated with more scientific approaches to vulnerability assessment, given the tools available when the PCPA was enacted, presented too large a risk for managers to consider endorsing their use. In contrast, the basic definition of the PMZ is difficult to challenge (pesticide contamination has been detected or not detected) in the legal sense. And the logic of investing economic resources in areas immediately surrounding areas of acknowledged contamination are relatively undisputable. The eastern part of the SJV contains more than 50 percent of the PMZs in the state. Coarse-textured soils of low carbon content are ubiquitous in this area and are represented in more than 3,000 sections. The obvious contamination scenario is the normal scenario in the eastern SJV, and because of its size it creates a huge management problem. While more sophisticated methods for assessing ground water vulnerability have been developed, a question that begs to be asked is "How would conversion to the use of enhanced techniques for evaluating ground water vulnerability improve ground water protection policy and management in the SJV?"
More than 90 percent of the population of Hawaii depends on ground water (nearly 200 billion gallons per day) for their domestic supply (Au 1991). Ground water contamination is of special concern in Hawaii, as in other insular systems, where alternative fresh water resources are not readily available or economically practical. Salt water encroachment, caused by pumping, is by far the biggest source of ground water contamination in Hawaii; however, nonpoint source contamination from agricultural chemicals is increasingly a major concern. On Oahu, where approximately 80 percent of Hawaii's million-plus population resides, renewable ground water resources are almost totally exploited; therefore, management action to prevent contamination is essential.
Each of the major islands in the Hawaiian chain is formed from one or more shield volcanoes composed primarily of extremely permeable thin basaltic lava flows. On most of the Hawaiian islands the margins of the volcanic mountains are overlapped by coastal plain sediments of alluvial and marine origin that were deposited during periods of volcanic quiescence. In general, the occurrence of ground water in Hawaii, shown in Figure 5.5 , falls into three categories: (1) basal water bodies floating on and displacing salt water, (2) high-level water bodies impounded within compartments formed by impermeable dikes that intrude the lava flows, and (3) high-level water bodies perched on ash beds or soils interbedded with
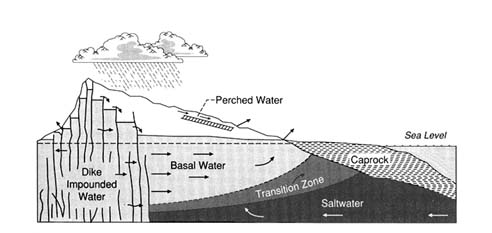
FIGURE 5.5 Cross section of a typical volcanic dome showing the occurrence of ground water in Hawaii (After Peterson 1972. Reprinted, by permission, from Water Well Journal Publishing Company, 1972.)
thin lava flows on unconformities or on other relatively impervious lava flows (Peterson 1972).
A foundation of the tourist industry in Hawaii is the pristine environment. The excellent quality of Hawaii's water is well known. The public has demanded, and regulatory agencies have adopted, a very conservative, zero-tolerance policy on ground water contamination. The reality, however, is that past, present, and future agricultural, industrial, and military activities present potentially significant ground water contamination problems in Hawaii.
Since 1977 when 1,874 liters of ethylene dibromide (EDB) where spilled within 18 meters of a well near Kunia on the island of Oahu, the occurrence and distribution of contaminants in Hawaii's ground water has been carefully documented by Oki and Giambelluca (1985, 1987) and Lau and Mink (1987). Before 1981, when the nematocide dibromochloropropane (DBCP) was found in wells in central Oahu, the detection limit for most chemicals was too high to reveal the low level of contamination that probably had existed for many years.
Concern about the fate of agriculture chemicals led the Hawaii State Department of Agriculture to initiate a large sampling program to characterize the sources of nonpoint ground water contamination. In July 1983, 10 wells in central Oahu were closed because of DBCP and EDB contamination. The public has been kept well informed of possible problems through the publication of maps of chemicals detected in ground water in the local newspaper. Updated versions of these maps are shown in Figures 5.6a , b , c , and d .
In Hawaii, interagency committees, with representation from the Departments of Health and Agriculture, have been formed to address the complex technical and social questions associated with ground water contamination from agricultural chemicals. The Hawaii legislature has provided substantial funding to groups at the University of Hawaii to develop the first GIS-based regional scale chemical leaching assessment approach to aid in pesticide regulation. This effort, described below, has worked to identify geographic areas of concern, but the role the vulnerability maps generated by this system will play in the overall regulatory process is still unclear.
Agrichemicals are essential to agriculture in Hawaii. It is not possible to maintain a large pineapple monoculture in Hawaii without nematode control using pesticides. Pineapple and sugar growers in Hawaii have generally employed well controlled management practices in their use of fertilizers, herbicides, and insecticides. In the early 1950s, it was thought that organic chemicals such as DBCP and EDB would not leach to ground water
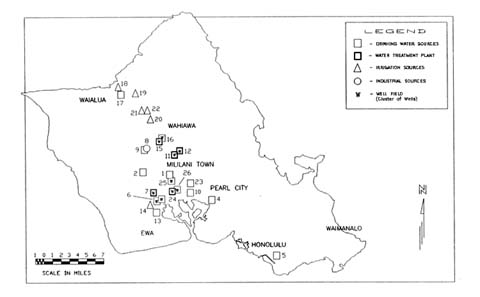
FIGURE 5.6a The occurrence and distribution of ground water contamination on the Island of Oahu. (Map provided by Hawaii State Department of Health.)
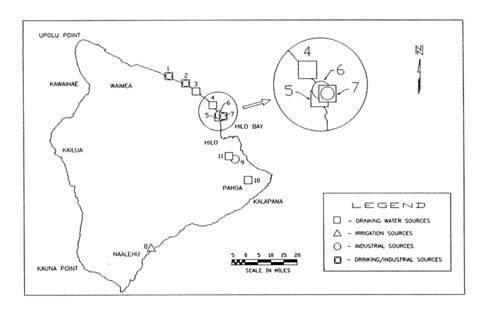
FIGURE 5.6b The occurrence and distribution of ground water contamination on the Island of Hawaii. (Map provided by Hawaii State Department of Health.)
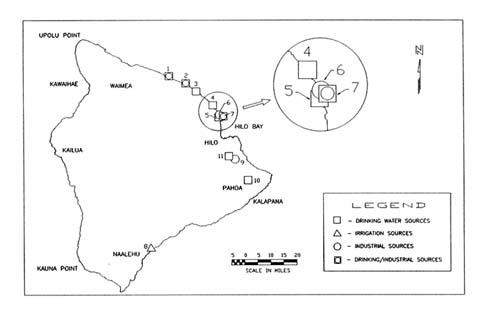
FIGURE 5.6c The occurrence and distribution of ground water contamination on the Island of Maui. (Map provided by Hawaii State Department of Health.)
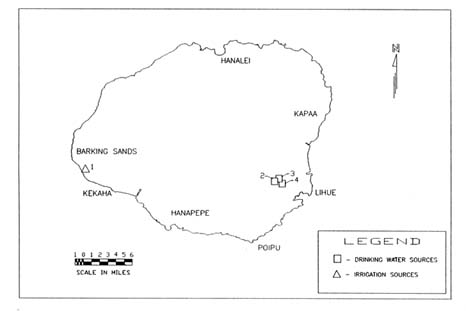
FIGURE 5.6d The occurrence and distribution of ground water contamination on the Island of Kauai. (Map provided by Hawaii State Department of Health.)
because (1) the chemicals are highly sorbed in soils with high organic carbon contents, (2) the chemicals are highly volatile, and (3) the water table is several hundred meters below the surface. Measured concentrations of DBCP and EDB down to 30 meters at several locations have shown the original assessment to be wrong. They have resulted in an urgent need to understand processes such as preferential flow better and to predict if the replacement chemicals used today, such as Telon II, will also leach to significant depths.
Leaching of pesticides to ground water in Hawaii could take decades. This time lag could lead to a temporary false sense of security, as happened in the past and potentially result in staggering costs for remedial action. For this reason, mathematical models that permit the user to ask ''what if" questions have been developed to help understand what the future may hold under certain management options. One needs to know what the fate of chemicals applied in the past will be and how to regulate the chemicals considered for use in the future; models are now being developed and used to help make these vulnerability assessments.
Researchers have embarked on several parallel approaches to quantitatively assess the vulnerability of Hawaii's ground water resources, including: (1) sampling, (2) physically-based numerical modeling, and (3) vulnerability mapping based on a simple chemical leaching index. Taken together these approaches have provided insight and guidance for work on a complex, spatially and temporally variable problem.
The sampling programs (Wong 1983 and 1987, Peterson et al. 1985) have shown that the chemicals applied in the past do, in fact, leach below the root zone, contrary to the original predictions, and can eventually reach the ground water. Experiments designed to characterize the nuances of various processes, such as volatilization, sorption, and degradation, have been conducted recently and will improve the conceptualization of mathematical models in the future.
The EPA's Pesticide Root Zone Model (PRZM), a deterministic-empirical/conceptual fluid flow/solute transport model, has been tested by Loague and co-workers (Loague et al. 1989a, b; Loague 1992) against measured concentration profiles for DBCP and EDB in central Oahu. These simulations illustrate that the chemicals used in the past can indeed move to considerable depths. Models of this kind, once properly validated, can be used to simulate the predicted fate of future pesticide applications. One must always remember, however, that numerical simulations must be interpreted in terms of the limiting assumptions associated with model and data errors.
Ground water vulnerability maps and assessments of their uncertainty were pioneered at the University of Hawaii in the Department of Agriculture Engineering (Khan and Liang 1989, Loague and Green 1990a). These pesticide leaching assessments were made by coupling a simple mobility index to a geographic information system. Loague and coworkers have investigated the uncertainty in these maps owing to data and model errors (Loague and Green 1988; Loague et al. 1989c, 1990; Loague and Green 1990b, 1990c; Loague 1991; Kleveno et al. 1992; Yost et al. 1993). The Hawaiian database on soils, climate, and chemicals is neither perfect nor poor for modeling applications; it is typical of what exists in most states—major extrapolations are required to estimate the input parameters required for almost any chemical fate model.
Sampling from wells in Hawaii has shown the concentrations of various chemicals, both from agriculture and industrial sources, which have leached to ground water in Hawaii. These concentrations, in general, are low compared to the levels detected in other states and for the most part are below health advisory levels established by EPA. In some instances contamination has not resulted from agriculture, but rather from point sources such as chemical loading and mixing areas and possibly from ruptured fuel lines. The widespread presence of trichloropropane (TCP) in Hawaii's ground water and deep soil cores at concentrations higher than DBCP was totally unexpected. TCP was never applied as a pesticide, but results from the manufacture of the fumigant DD, which was used until 1977 in pineapple culture. The occurrence of TCP illustrates that one must be aware of the chemicals applied as well as their components and transformation products.
Wells have been closed in Hawaii even though the measured contaminant concentrations have been below those considered to pose a significant health risk. At municipal well locations in central Oahu, where DBCP, EDB, and/or TCP have been detected, the water is now passed through carbon filters before it is put into the distribution system. The cost of this treatment is passed on to the water users, rather than to those who applied the chemicals.
The pesticide leaching assessment maps developed by Khan and Liang (1989) are intended for incorporation into the regulatory process. Decisions are not made on the basis of the red and green shaded areas for different chemicals (see Plate 3 ), but this information is considered. The uncertainty analysis by Loague and coworkers has shown some of the limitations of deterministic assessments in the form of vulnerability maps and provided initial guidance on data shortfalls.
APPLICATION OF A VULNERABILITY INDEX FOR DECISION-MAKING AT THE NATIONAL LEVEL
Need for a vulnerability index.
A vulnerability index for ground water contamination by pesticides has been developed and used by USDA as a decision aid to help attain the objectives of the President's Water Quality Initiative (see Box 1.1 ). A vulnerability index was needed for use in program management and to provide insight for policy development. Motivation for the development of the vulnerability index was provided by two specific questions:
Given limited resources and the geographic diversity of the water quality problems associated with agricultural production, what areas of the country have the highest priority for study and program implementation?
What policy implications emerge from the spatial patterns of the potential for conamination from a national perspective, given information currently available about farming practices and chemical use in agriculture?
Description of the Vulnerability Index
A vulnerability index was derived to evaluate the likelihood of shallow ground water contamination by pesticides used in agriculture in one area compared to another area. Because of the orientation of Initiative policies to farm management practices, it was necessary that the vulnerability measure incorporate field level information on climate, soils, and chemical use. It also needed to be general enough to include all areas of the country and all types of crops grown.
A Ground Water Vulnerability Index for Pesticides (GWVIP) was developed by applying the Soil-Pesticide Interaction Screening Procedure (SPISP) developed by the Soil Conservation Service to the National Resource Inventory (NRI) land use database for 1982 and the state level pesticide use database created by Resources for the Future (Gianessi and Puffer 1991). Details of the computational scheme and databases used are described by Kellogg et al. (1992). The 1982 NRI and the associated SOIL-5 database provide information on soil properties and land use at about 800,000 sample points throughout the continental United States. This information is sufficient to apply the SPISP to each point and thus obtain a relative measure of the soil leaching potential throughout the country. The RFF pesticide use database was used to infer chemical use at each point on the basis of the crop type recorded in the NRI database. By taking advantage of the statistical properties of the NRI database, which is based on a statistical survey
sampling design, the GWVIP score at each of the sample points can be statistically aggregated for making comparisons among regions.
Since the GWVIP is an extension of a screening procedure, it is designed to minimize the likelihood of incorrectly identifying an area as having a low potential for contamination—that is, false negatives are minimized and false positives are tolerated. The GWVIP is designed to classify an area as having a potential problem even if the likelihood is small.
GWVIP scores were graphically displayed after embedding them in a national cartographic database consisting of 13,172 polygons created by overlaying the boundaries of 3,041 counties, 189 Major Land Resource Areas (MLRAs), 2,111 hydrologic units, and federal lands.
Three caveats are especially important in using the GWVIP and its aggregates as a decision aid:
Land use data are for 1982 and do not represent current cropping patterns in some parts of the country. Although total cropland acreage has remained fairly stable over the past 10 years, there has been a pronounced shift from harvested cropland to cropland idled in government programs.
The approach uses a simulation model that predicts the amount of chemical that leaches past the root zone. In areas where the water table is near the surface, these predictions relate directly to shallow ground water contamination. In other areas a time lag is involved. No adjustment was made for areas with deep water tables.
No adjustment in chemical use is made to account for farm management factors, such as chemical application rates and crop rotations. The approach assumes that chemical use is the same for a crop grown as part of a rotation cropping system as for continuous cropping. Since the chemical use variable in the GWVIP calculation is based on acres of land treated with pesticides, application rates are also not factored into the analysis.
Application to Program Management
By identifying areas of the country that have the highest potential for leaching of agrichemicals, the GWVIP can serve as a basis for selecting sites for implementation of government programs and for more in-depth research on the environmental impact of agrichemical use. These sites cannot be selected exclusively on the basis of the GWVIP score, however, because other factors, such as surface water impacts and economic and demographic factors, are also important.
For example, the GWVIP has been used as a decision aid in selecting sites for USDA's Area Study Program, which is designed to provide chemical use and farming practice information to aid in understanding the relationships among farming activities, soil properties, and ground water quality.
The National Agricultural Statistics Service interviews farm operators in 12 major watersheds where the U.S. Geological Survey is working to measure the quality of surface and ground water resources under its National Water Quality Assessment Program. At the conclusion of the project, survey information will be combined with what is learned in other elements of the President's Water Quality Initiative to assess the magnitude of the agriculture-related water quality problem for the nation as a whole and used to evaluate the potential economic and environmental effects of Initiative policies of education, technical assistance, and financial assistance if implemented nationwide.
To meet these objectives, each Area Study site must have a high potential for ground water contamination relative to other areas of the country. A map showing the average GWVIP for each of the 13,172 polygons comprising the continental United States, shown in Plate 3 , was used to help select the sites. As this map shows, areas more likely to have leaching problems with agrichemicals than other areas of the country occur principally along the coastal plains stretching from Alabama and Georgia north to the Chesapeake Bay area, the corn belt states, the Mississippi River Valley, and the irrigated areas in the West. Sites selected for study in 1991 and 1992 include four from the eastern coastal plain (Delmarva Peninsula, southeastern Pennsylvania, Virginia and North Carolina, and southern Georgia), four from the corn belt states (Nebraska, Iowa, Illinois, and Indiana), and two from the irrigated areas in the West (eastern Washington and southeastern Idaho). Four additional sites will be selected for study in 1993.
Application to Policy Analysis and Development
The GWVIP has also been used by USDA to provide a national perspective on agricultural use of pesticides and the potential for ground water contamination to aid in policy analysis and development.
The geographic distribution of GWVIP scores has shown that the potential for ground water contamination is diverse both nationally and regionally. Factors that determine intrinsic vulnerability differ in virtually every major agricultural region of the country. Whether an impact is realized in these intrinsically vulnerable areas depends on the activities of producers—such as the type of crop planted, chemical use, and irrigation practices—which also vary both nationally and regionally. High vulnerability areas are those where a confluence of these factors is present. But not all cropland is vulnerable to leaching. About one-fourth of all cropland has GWVIP scores that indicate very low potential for ground water contamination from the use of agrichemicals. Nearly all agricultural states have significant acreage that meets this low vulnerability criterion. Areas of the country identified as being in a high vulnerability group relative to potential
for agrichemical leaching also have significant acreages that appear to have low vulnerability.
This mix of relative vulnerabilities both nationally and regionally has important policy implications. With the potential problem so diverse, it is not likely that simple, across-the-board solutions will work. Simple policies—such as selective banning of chemicals—may reduce the potential for ground water contamination in problem areas while imposing unnecessary costs on farming in nonproblem areas. The geographic diversity of the GWVIP suggests that the best solutions will come from involvement of both local governments and scientists with their state and national counter-parts to derive policies that are tailored to the unique features of each problem area.
In the future, USDA plans to use vulnerability indexes, like the GWVIP, in conjunction with economic models to evaluate the potential for solving agriculture-related water quality problems with a nationwide program to provide farmers with the knowledge and technical means to respond voluntarily to water quality concerns.
These six case studies illustrate how different approaches to vulnerability assessment have evolved under diverse sets of management requirements, data constraints, and other technical considerations. In addition, each of these examples shows that vulnerability assessment is an ongoing process through which information about a region's ground water resources and its quality can be organized and examined methodically.
In Iowa, the Iowa DNR staff elected to keep their vulnerability characterization efforts as simple as possible, and to use only properties for which data already existed or could be easily checked. They assumed that surficial features such as the soil are too thin and too disrupted by human activities (e.g., tillage, abandoned wells) to provide effective ground water protection at any particular location and sought to identify a surrogate measure for average travel time from the land surface to the aquifer. Thus, a ground water vulnerability map was produced which represents vulnerability primarily on the basis of depth to ground water and extent of overlying materials. Wells and sinkholes are also shown. The results are to be used for informing resource managers and the public of the vulnerability of the resource and to determine the type of information most needed to develop an even better understanding of the vulnerability of Iowa's ground water.
The Cape Cod approach to ground water vulnerability assessment is perhaps one of the oldest and most sophisticated in the United States. Driven by the need to protect the sole source drinking water aquifer underlying this sandy peninsula, the vulnerability assessment effort has focused on the identification
and delineation of the primary recharge areas for the major aquifers. This effort began with a simple mass balance approach which assumed even recharge within a circular area around each drinking water well. It has since evolved to the development of a complex, particle-tracking three-dimensional model that uses site-specific data to delineate zones of contribution. Bolstered by strong public concern, Cape Cod has been able to pursue an ambitious and sophisticated agenda for resource protection, and now boasts a sophisticated differential management ground water protection program.
In Florida, ground water resource managers rely on a combination of monitoring and vulnerability assessment techniques to identify high recharge areas the develop the state ground water protection program. Overlay and index methods, including several modified DRASTIC maps were produced to identify areas of ground water significance in support of decision making in state land acquisition programs aimed at ground water protection. In addition, several monitoring networks have been established to assess background water quality and monitor actual effects in areas identified as highly vulnerable. The coupling of ground water vulnerability assessments with monitoring and research efforts, provides the basis of an incremental and evolving ground water protection program in Florida.
The programs to protect ground water in California's intensely agricultural San Joaquin Valley are driven largely by compliance with the state Pesticide Contamination Prevention Act. The California Department of Pesticide Regulation determined that no model would be sufficient to cover their specific regulatory needs and that the available data bases were neither suitable nor reliable for regulatory purposes. Thus, a ground water protection program was built on the extensive existing pesticide use reporting system and the significant ground water monitoring requirements of the act. Using farm sections as management units, the state declares any section in which a pesticide or its degradation product is detected as a pesticide management zone and establishes further restrictions and monitoring requirements. Thus, the need to devise a defensible regulatory approach led California to pursue a mechanistic monitoring based approach rather than a modeling approach that would have inherent and difficult to quantify uncertainties.
In contrast, the approach taken in Hawaii involves an extensive effort to understand the uncertainty associated with the assessment models used. The purpose of this is to provide guidance to, but not the sole basis for, the pesticide regulation program. The combined use of sampling, physically-based numerical modeling, and a chemical leaching index has led to extensive improvements in the understanding of the fate of pesticides in the subsurface environment. Uncertainty analyses are used to determine where additional information would be most useful.
Finally, USDA's Ground Water Vulnerability Index for Pesticides illustrates a national scale vulnerability assessment developed for use as a decision aid and analytical tool for national policies regarding farm management and water quality. This approach combines nationally available statistical information on pesticide usage and soil properties with a simulation model to predict the relative likelihood of contamination in cropland areas. USDA has used this approach to target sites for its Area Study Program which is designed to provide information to farmers about the relationships between farm management practices and water quality. The results of the GWVIP have also indicated that, even at the regional level, there is often an mix of high and low vulnerability areas. This result suggests that effective ground water policies should be tailored to local conditions.
Au, L.K.L. 1991. The Relative Safety of Hawaii's Drinking Water. Hawaii Medical Journal 50(3): 71-80.
Barlow, P.M. 1993. Particle-Tracking Analysis of Contributing Areas of Public-Supply Wells in Simple and Complex Flow Systems, Cape Cod, Massachusetts. USGS Open File Report 93-159. Marlborough, Massachusetts: U.S. Geological Survey.
Britt, J.K., S.E. Dwinell, and T.C. McDowell. 1992. Matrix decision procedure to assess new pesticides based on relative ground water leaching potential and chronic toxicity. Environ. Toxicol. Chem. 11: 721-728.
Cape Cod Commission (CCC). 1991. Regional Policy Plan. Barnstable, Massachusetts: Cape Cod Commission.
Cape Cod Planning and Economic Development Commission (CCPEDC). March 1978a. Draft Area Wide Water Quality Management Plan for Cape Cod. Barnstable, Massachusetts: Cape Cod Commission.
Cape Cod Planning and Economic Development Commission (CCPEDC). September 1978b. Final Area Wide Water Quality Management Plan for Cape Cod. Barnstable, Massachusetts: Cape Cod Commission.
Department of Environmental Protection, Division of Water Supply (DEP-WS). 1991. Guidelines and Policies for Public Water Supply Systems. Massachusetts Department of Environmental Protection.
Gianessi, L.P., and C.A. Puffer. 1991. Herbicide Use in the United States: National Summary Report. Washington, D.C.: Resources for the Future.
Guswa, J.H., and D.R. LeBlanc. 1981. Digital Models of Ground water Flow in the Cape Cod Aquifer System, MA. USGS Water Supply Paper 2209. U.S. Geological Survey.
Heath, D.L. 1988. DRASTIC mapping of aquifer vulnerability in eastern Barnstable and western Yarmouth, Cape Cod, Massachusetts. In Appendix D, Cape Cod Aquifer Management Project, Final Report, G.A. Zoto and T. Gallagher, eds. Boston: Massachusetts Department of Environmental Quality Engineering.
Horsely, S.W. 1983. Delineating zones of contribution of public supply wells to protect ground water . In Proceedings of the National Water Well Association Eastern Regional Conference, Ground-Water Management, Orlando, Florida.
Hoyer, B.E. 1991. Ground water vulnerability map of Iowa. Pp. 13-15 in Iowa Geology, no. 16. Iowa City, Iowa: Iowa Department of Natural Resources.
Hoyer, B.E., J.E. Combs, R.D. Kelley, C. Cousins-Leatherman, and J.H. Seyb. 1987. Iowa Ground water Protection Strategy. Des Moines: Iowa Department of Natural Resources.
Kellogg, R.L., M.S. Maizel, and D.W. Goss. 1992. Agricultural Chemical Use and Ground Water Quality: Where Are the Potential Problems? Washington, D.C.: U.S. Department of Agriculture, Soil Conservation Service.
Khan, M.A., and T. Liang. 1989. Mapping pesticide contamination potential. Environmental Management 13(2):233-242.
Kleveno, J.J., K. Loague, and R.E. Green. 1992. An evaluation of a pesticide mobility index: Impact of recharge variation and soil profile heterogeneity. Journal of Contaminant Hydrology 11(1-2):83-99.
Land Acquisition Advisory Council (LAAC). 1991. Ground Water Resources Committee Final Report: Florida Preservation 2000 Needs Assessment. Tallahassee, Florida: Department of Environmental Regulation. 39 pp.
Lau, L.S., and J.F. Mink. 1987. Organic contamination of ground water: A learning experience. J. American Water Well Association 79(8):37-42.
LeBlanc, D.R., and J.H. Guswa. 1977. Water-Table Map of Cape Cod, MA. May 23-27, 1976, USGS Open File Report 77-419, scale 1:48,000.
Loague, K. 1991. The impact of land use on estimates of pesticide leaching potential: Assessments and uncertainties. Journal of Contaminant Hydrology 8: 157-175.
Loague, K. 1992. Simulation of organic chemical movement in Hawaii soils with PRZM: 3. Calibration. Pacific Science 46(3):353-373.
Loague, K.M., and R.E. Green. 1988. Impact of data-related uncertainties in a pesticide leaching assessment. Pp. 98-119 in Methods for Ground Water Quality Studies, D.W. Nelson and R.H. Dowdy, eds. Lincoln, Nebraska: Agricultural Research Division, University of Nebraska.
Loague, K., and R.E. Green. 1990a. Comments on "Mapping pesticide contamination potential," by M.A. Khan and T. Liang. Environmental Management 4:149-150.
Loague, K., and R.E. Green. 1990b. Uncertainty in Areal Estimates of Pesticide Leaching Potential. Pp. 62-67 in Transactions of 14th International Congress of Soil Science. Kyoto, Japan: International Soil Science Society.
Loague, K., and R.E. Green. 1990c. Criteria for evaluating pesticide leaching models. Pp. 175-207 in Field-Scale Water and Solute Flux in Soils, K. Roth, H. Flühler, W.A. Jury, and J.C. Parker, eds. Basel, Switzerland: Birkhauser Verlag.
Loague, K.M., R.E. Green, C.C.K. Liu, and T.C. Liang. 1989a. Simulation of organic chemical movement in Hawaii soils with PRZM: 1. Preliminary results for ethylene dibromide. Pacific Science 43(1):67-95.
Loague, K., T.W. Giambelluca, R.E. Green, C.C.K. Liu, T.C. Liang, and D.S. Oki. 1989b. Simulation of organic chemical movement in Hawaii soils with PRZM: 2. Predicting deep penetration of DBCP, EDB, and TCP. Pacific Science 43(4):362-383.
Loague, K.M., R.S. Yost, R.E. Green, and T.C. Liang. 1989c. Uncertainty in a pesticide leaching assessment for Hawaii. Journal of Contaminant Hydrology 4:139-161.
Loague, K., R.E. Green, T.W. Giambelluca, T.C. Liang, and R.S. Yost. 1990. Impact of uncertainty in soil, climatic, and chemical information in a pesticide leaching assessment. Journal of Contaminant Hydrology 5:171-194.
Maddox, G., and J. Spicola. 1991. Ground Water Quality Monitoring Network. Tallahassee, Florida: Florida Department of Environmental Regulation. 20 pp.
Maddox, G., J. Lloyd, T. Scott, S. Upchurch, and R. Copeland, eds. 1993. Florida's Ground Water Quality monitoring Program: Background Hydrogeochemistry. Florida Geological Survey Special Publication #34. Tallahassee, Florida: Florida Department of Environmental Regulation in cooperation with Florida Geological Survey.
National Research Council (NRC). 1986. Ground Water Quality Protection: State and Local Strategies. Washington, D.C.: National Academy Press.
Oki, D.S., and T.W. Giambelluca. 1985. Subsurface Water and Soil Quality Data Base for State of Hawaii: Part 1. Spec. Rept. 7. Manoa, Hawaii: Water Resources Research Center, University of Hawaii at Manoa.
Oki, D.S., and T.W. Giambelluca. 1987. DBCP, EDB, and TCP contamination of ground water in Hawaii. Ground Water 25:693-702.
Olimpio, J.C., E.C. Flynn, S. Tso, and P.A. Steeves. 1991. Use of a Geographic Information System to Assess Risk to Ground-Water Quality at Public-Supply Wells, Cape Cod, Massachusetts. Boston, Massachusetts: U.S. Geological Survey.
Peterson, F.L. 1972. Water development on tropic volcanic islands—Type example: Hawaii. Ground Water 5:18-23.
Peterson, F.L., K.R. Green, R.E. Green, and J.N. Ogata. 1985. Drilling program and pesticide analysis of core samples from pineapple fields in central Oahu. Water Resources Research Center, University of Hawaii at Manoa, Special Report 7.5. Photocopy.
Southwest Florida Water Management Districts (SFWMD). 1991. The Bluebelt Commission. Brooksville, Florida: Southwest Florida Water Management Districts.
U.S. Bureau of the Census. 1991. Statistical Abstracts of the United States: 1991, 111th edition. Washington, D.C.: U.S. Government Printing Office.
Wong, L. 1983. Preliminary report on soil sampling EDB on Oahu. Pesticide Branch, Div. of Plant Industry, Department of Agriculture, State of Hawaii. Photocopy.
Wong, L. 1987. Analysis of ethylene dibromide distribution in the soil profile following shank injection for nematode control in pineapple culture. Pp. 28-40 in Toxic Organic Chemicals in Hawaii's Water Resources, P.S.C. Rao and R.E. Green, eds. Ser. 086. Honolulu: Hawaii Inst. Trop Agric. Hum. Resources Res. Exten. University of Hawaii.
Yost, R.S., K. Loague, and R.E. Green. 1993. Reducing variance in soil organic carbon estimates—soil classification and geostatistical approaches. Geoderma 57(3):247-262
Welcome to OpenBook!
You're looking at OpenBook, NAP.edu's online reading room since 1999. Based on feedback from you, our users, we've made some improvements that make it easier than ever to read thousands of publications on our website.
Do you want to take a quick tour of the OpenBook's features?
Show this book's table of contents , where you can jump to any chapter by name.
...or use these buttons to go back to the previous chapter or skip to the next one.
Jump up to the previous page or down to the next one. Also, you can type in a page number and press Enter to go directly to that page in the book.
Switch between the Original Pages , where you can read the report as it appeared in print, and Text Pages for the web version, where you can highlight and search the text.
To search the entire text of this book, type in your search term here and press Enter .
Share a link to this book page on your preferred social network or via email.
View our suggested citation for this chapter.
Ready to take your reading offline? Click here to buy this book in print or download it as a free PDF, if available.
Get Email Updates
Do you enjoy reading reports from the Academies online for free ? Sign up for email notifications and we'll let you know about new publications in your areas of interest when they're released.

An official website of the United States government
The .gov means it’s official. Federal government websites often end in .gov or .mil. Before sharing sensitive information, make sure you’re on a federal government site.
The site is secure. The https:// ensures that you are connecting to the official website and that any information you provide is encrypted and transmitted securely.
- Publications
- Account settings
Preview improvements coming to the PMC website in October 2024. Learn More or Try it out now .
- Advanced Search
- Journal List
- HHS Author Manuscripts
Challenges to Sustainable Safe Drinking Water: A Case Study of Water Quality and Use across Seasons in Rural Communities in Limpopo Province, South Africa
Joshua n. edokpayi.
1 Department of Hydrology and Water Resources, University of Venda, Thohoyandou 0950, South Africa; [email protected]
2 Department of Civil and Environmental Engineering, University of Virginia, Charlottesville, VA 22904, USA; ude.qud@drelhak (D.M.K.); moc.liamg@320hlc (C.L.H.); ude.ainigriv@sm4rfc (C.R.); ude.ainigriv@e9saj (J.A.S.)
Elizabeth T. Rogawski
3 Department of Public Health Sciences, University of Virginia, Charlottesville, VA 22908, USA; ude.ainigriv@m5rte
4 Division of Infectious Diseases & International Health, University of Virginia, Charlottesville, VA 22908, USA; ude.ainigriv.ccm.liamcsh@v8dr
David M. Kahler
5 Center for Environmental Research and Education, Duquesne University, Pittsburgh, PA 15282, USA
Courtney L. Hill
Catherine reynolds.
6 School of Civil and Environmental Engineering, Georgia Institute of Technology, Atlanta, GA 30332, USA
Emanuel Nyathi
7 Department of Animal Science, University of Venda, Thohoyandou 0950, South Africa; [email protected]
James A. Smith
John o. odiyo, amidou samie.
8 Department of Microbiology, University of Venda, Thohoyandou 0950, South Africa; [email protected] (A.S.); [email protected] (P.B.)
Pascal Bessong
Rebecca dillingham.
Author Contributions: Conceived and designed the experiments: J.N.E., E.T.R., D.M.K., C.L.H. Performed the experiments: J.N.E., E.T.R., D.M.K., C.L.H., C.R., E.N. Contributed reagents/materials/analysis tools: P.B., E.N., A.S., R.D., J.A.S., J.O.O. Analyzed the data: J.N.E., E.T.R., D.M.K., C.L.H. Wrote the paper: J.N.E., E.T.R., D.M.K., C.L.H. Participated in the editing of the manuscript: J.N.E., E.T.R., D.M.K., C.L.H., P.B., A.S., R.D., J.A.S., J.O.O., E.N., C.R.
Associated Data
Table S2: Membrane-filtration results for E. Coli and total coliforms of water sources,
Table S3: Anion concentrations (mg/L) of water sources,
Table S4: Major metal concentrations (mg/L) of water sources,
Table S5: Trace metal concentrations μg/L) of water sources.
Consumption of microbial-contaminated water can result in diarrheal illnesses and enteropathy with the heaviest impact upon children below the age of five. We aimed to provide a comprehensive analysis of water quality in a low-resource setting in Limpopo province, South Africa. Surveys were conducted in 405 households in rural communities of Limpopo province to determine their water-use practices, perceptions of water quality, and household water-treatment methods. Drinking water samples were tested from households for microbiological contamination. Water from potential natural sources were tested for physicochemical and microbiological quality in the dry and wet seasons. Most households had their primary water source piped into their yard or used an intermittent public tap. Approximately one third of caregivers perceived that they could get sick from drinking water. All natural water sources tested positive for fecal contamination at some point during each season. The treated municipal supply never tested positive for fecal contamination; however, the treated system does not reach all residents in the valley; furthermore, frequent shutdowns of the treatment systems and intermittent distribution make the treated water unreliable. The increased water quantity in the wet season correlates with increased treated water from municipal taps and a decrease in the average contaminant levels in household water. This research suggests that wet season increases in water quantity result in more treated water in the region and that is reflected in residents’ water-use practices.
1. Introduction
Clean and safe drinking water is vital for human health and can reduce the burden of common illnesses, such as diarrheal disease, especially in young children. Unfortunately, in 2010, it was estimated that 1.8 billion people globally drank water that was not safe [ 1 ]. This scenario is most common in developing countries, and the problem is exacerbated in rural areas [ 1 ]. Significant amounts of time are spent by adults and school children upon water abstraction from various sources [ 2 , 3 ]. It is estimated that, in developing countries, women (64%) and girls (8%) spend billions of hours a year collecting water [ 1 ]. The erratic supply of safe drinking and domestic water often affects good hygiene practices. In most developing countries of the world, inadequate supplies of drinking water can contribute to the underage death of children in the region [ 4 – 10 ].
Storage of collected water from rivers, springs, community stand-pipes, and boreholes is a common practice in communities that lack potable water supplies piped into their homes. Even when water is piped into the home, it is often not available on a continuous basis, and water storage is still necessary. Water is stored in various containers which include jerry cans, buckets, drums, basins and local pots [ 11 – 13 ]. It has been reported that when collection of water from sources of high quality is possible, contamination during transport, handling and storage and poor hygienic practices often results and can cause poor health outcomes [ 11 , 13 – 15 ].
South Africa is a semi-arid country that has limited water resources, and the provision of adequate water-supply systems remains a great challenge. In some of the major cities, access to clean and safe drinking water is comparable to what is found in other developed cities, but this is not the case in some cities, towns and most villages where there is constant erratic supply of potable water, and in some cases, there is no water supply system [ 16 ]. Although access to clean and safe drinking water is stipulated as a constitutional right for all South Africans in the country’s constitution [ 17 , 18 ], sustainable access to a potable water supply by millions of South Africans is lacking.
Residents of communities with inadequate water supply are left with no alternative other than to find local sources of drinking water for themselves. Rural areas are the most affected, and residents resort to the collection of water from wells, ponds, springs, lakes, rivers and rainwater harvesting to meet their domestic water needs [ 19 – 24 ]. Water from such sources is often consumed without any form of treatment [ 12 , 19 , 21 ]. However, these alternative sources of drinking water are often vulnerable to point and non-point sources of pollution and are contaminated frequently by fecal matter [ 5 , 19 , 25 ]. A report by the South African Council for Scientific and Industrial Research clearly showed that almost 2.11 million people in South Africa lack access to any safe water infrastructure. The consumption of water from such unimproved sources without treatment constitutes a major public health risk [ 26 ].
Consumption of contaminated drinking water is a cause of diarrheal disease, a leading cause of child mortality in developing countries with about 700,000 deaths of children under the age of 5 reported in 2011 [ 10 , 27 ]. In South Africa, diarrhea is one of the leading causes of death among young children, and this problem is worst in children infected with HIV (Human Immunodeficiency Virus).
The health risks associated with the consumption of unsafe drinking water are not only related to infectious diseases but also to other environmental components such as fluoride, arsenic, lead, cadmium, nitrates and mercury. Excessive consumption of these substances from contaminated drinking water can lead to cancer, dental and skeletal fluorosis, acute nausea, memory lapses, renal failure, anemia, stunted growth, fetal abnormalities and skin rashes [ 16 , 28 ]. Groundwater contamination with high arsenic concentrations have been reported in Bangladesh, and high fluoride concentrations have been reported in the drinking water from various provinces in South Africa [ 28 – 34 ].
Temporary seasonal variations have been reported to influence the levels of contaminants in various water sources differently. The key environmental drivers across the wet and dry seasons include: volume of water, flow, frequency of rainfall events, storm run-off, evaporation and point sources of pollution [ 35 , 36 ]. An increase in storm-water run-off within a river catchment may increase the level of contaminants due to land-use activities. Increased water volume could lead to a decrease in the concentration of contaminants due to the dilution effect. A low incidence of rainfall and high evaporation can cause a contaminant to concentrate in water. Very few water-quality parameters such as turbidity are expected to be higher in the wet season. Other parameters can vary depending on the key environmental drivers. There is paucity of data on the effect of change across seasons on water-use practices among household in rural areas of developing countries.
The geographic area for this study is located 35 km north of Thohoyandou, in Limpopo Province, South Africa. The area is primarily agricultural, such that water contamination by nitrates is a potential concern. In addition, mining operations in the area may contaminate water sources with heavy metals.
The significance of this study lies in the broad characterization of water-quality parameters that could affect human health, which is not restricted to microbiological analysis. In a rural community, the primary concern of drinking water is the microbiological quality of the water and chemical constituents are often considered not as problematic. This study was designed to evaluate a broad spectrum of water-quality constituents of natural water sources and household drinking water used by residents of rural communities in Limpopo Province. We also aimed to determine how water sources and collection practices change between dry and wet seasons within a one-year sampling period.
2. Materials and Methods
2.1. study design.
A baseline census of 10 villages in the Thulamela Municipality of Limpopo Province was completed to identify all households in which there was at least one healthy child under 3 years of age in the household, the child’s caregiver was at least 16 years of age, and the household did not have a permanent, engineered water-treatment system. 415 households that met these eligibility criteria were enrolled for the purposes of a water-treatment intervention trial. The baseline assessment of water-quality and use practices is reported here. Caregivers of the child under 3 years of age were given a questionnaire concerning demographics, socioeconomic status, water-use practices, sanitation and hygiene practices, and perceptions of water quality and health. In addition, a sample of drinking water was taken from a random selection of 25% of the total enrolled households in the dry (June–August 2016) and wet seasons (January–February 2017). The participant population was sorted by community, as a surrogate for water supply, and one-third from each community was randomly selected by a random number generated within Microsoft Excel (Seattle, WA, USA), which was sampled. The protocol used was approved by the Research Ethics Committee at the University of Venda (SMNS/15/MBY/27/0502) and the Institutional Review Board for Health Sciences Research at the University of Virginia (IRB-HSR #18662). Written informed consent was obtained from all participants and consent documentation was made available in English and Tshivenda. The majority of the baseline surveys were conducted in the dry season (approximately April to October). Six-months later, follow-on surveys were conducted at the height of the wet season (approximately November to March; however, the height of the season in 2016–17 was January to March).
2.2. Regional Description of the Study Area
The communities are located in a valley in the Vhembe District of Limpopo Province, South Africa ( Figure 1 ). The valley surrounds the Mutale River in the Soutpansberg Mountains and is located around 22°47′34′′ S and 30°27′01′′ E, in a tropical environment that exhibits a unimodal dry/wet seasonality ( Figure 2 ). In recent years, the area has received annual precipitation between 400 mm and 1100 mm; more importantly, the timing of the precipitation is highly variable ( Figure 2 ). Specifically, in 2010, the annual precipitation was about 750 mm; however, the majority of the precipitation came in March while, traditionally, the wet season begins earlier, in September or October. The year 2011 had the highest precipitation in the six-year period and had the majority of the rainfall in November. The years 2012 and 2015 began with a typical precipitation pattern; however, the rainfall did not continue as it did in 2013 and 2014. Annual temperature of the area also varies, with the highest temperature always recorded in the wet season ( Figure 3 ). There has been much variability of temperature in past years; however, this is beyond the scope of this study. The abbreviations used in Figure 1 and other figures, including the supplementary data and the type of the various water sources used in this study, are shown in Table 1 .

Map of the study area. The communities are all located within the Mutale River watershed. The rivers are indicated in blue, villages outlined in purple, environmental samples in blue squares, tributaries in green circles (which have intermittent flow), watershed boundary in orange. This heavily agricultural area has cultivated areas along both sides of thee Mutale River for the vast majority of the region; the area is shown with green outlines. There are two identified brick-processing areas shown in brown rectangles. Unfortunately, some sites are so close that the markers overlap (as with CR and IR). The location of the community supplies (CA, CB, and CC) are not shown to protect the privacy of those villages. See supplemental information for Google Earth files.

Precipitation trends in the study area. ( a ) Annual precipitation by hydrologic year. Data quality are presented on a scale of zero to unity where the quantity shown represents the proportion of missing or unreliable data in a year; ( b ) Cumulative precipitation for the last five complete years; ( c ) Average monthly precipitation calculated for years with greater than 90% reliable data (bottom right). All data are presented by the standard Southern hemisphere hydrologic year from July to June numbered with the ending year. Data are from the Nwanedzi Natural Reserve at the Luphephe Dam (17 km from the study area) and fire available through the Republic of South Africa, Department of Water and Sanitation, Hydrologic Services ( http://www.dwa.gov.za/Hydrology/ ).

The mean monthly temperature in the region recorded at Punda Milia. ( a ) Mean monthly temperature based on the means from 1962–1984; ( b ) Mean monthly temperature record. Data are available from the National Oceanic and Aviation Administration (U.S.), National Climatic Data Center, Climate Data Online service ( https://www.ncdc.noaa.gov/cdo-web/ ).
Abbreviations, water sources and type.
Agriculture occupies tine greatest land cover in the valley. Mogt households are engaged in some level of farming. Crops cultivated include maize and vegetables, and tree fruits include mangos and citrus fruits. Livestock is prevalent in the area with chickens, goats, and cattle. Smaller animals typically remain closer to households and larger animals graze throughout the region without boundaries. There are several brick-making facilities in the valley that include excavation, brick-forming and drying.
2.3. Water Sources
Drinking water in the study communities is available from a number of municipal and natural sources. The primary source of drinking water for seven of the villages is treated, municipal water. Two of the villages have community-level boreholes, storage tanks, and distribution tanks. An additional village has a borehole as well; however, residents report that, since its installation, the system has never supplied water.
The water for the treatment facility is drawn from behind a weir in the Mutale River and pumped to a retention basin. The water then undergoes standard treatment that includes pH adjustment, flocculation, settling, filtration, and chlorine disinfection. Water is then pumped to two elevated tanks that supply several adjacent regions, including the study area. Specifically, Branch 1 supplies Tshandama, Pile, Mutodani, Tshapasha and Tshibvumo; Branch 2 supplies an intermediary tank that in turn serves Matshavhawe, Muledane and Thongwe. Households can pay for a metered yard connection for the water used; these yard connections can be connected to household plumbing at the household’s discretion. The treated municipal water service is intermittent. Service in Tshandama and Pile was observed to be constant during the wet season and for only about two to three days per week during the dry season. Service in the remaining communities is two to four days per week during the wet season and about two days per week during the dry season. Furthermore, for the past two years, major repairs in the dry season caused the treated municipal water to cease completely. Households typically stored water for the periods when the treated municipal water was off; however, when the municipal water was unavailable for longer periods or not on the anticipated schedule, households obtained water from natural sources. The community-level boreholes provided water almost constantly but were subject to failure and delays in repairs.
Aside from the municipal sources, many residents of three villages have access to a community installed and operated distribution system that delivers water from the adjacent ephemeral rivers throughout the community (CA, CB, and CC). These systems are constructed with 50 mm to 70 mm (5 to 7 × 10 −2 m) high-density polyethylene pipes. Even these community-level schemes provide water on a schedule and sometimes require repair. Another common source of water for the community is springs. These shallow groundwater sources are common in the valley; however, there are communities that do not have a nearby spring. Some springs have had a pipe placed at the outlet to keep the spring open and facilitate filling containers. Researchers did not observe any constructions around the springs to properly isolate them from further contamination, and they are, therefore, not improved water sources. Pit latrines are common in every household throughout the region. Source (TS) is located near these communities while other springs (OS, LS) are located in agricultural areas. Boreholes provide deep groundwater supplies but require a pump. Such systems provide water as long as there is power for the pump and the well is deep enough to withstand seasonal variations. The two clinics in the study area surveyed each relied on a borehole for their water supply. Some residents also collected water directly from the river. The Mutale River is a perennial river; however, the ephemeral rivers, the Tshiombedi, Madade, Pfaleni, and Tshala Rivers, do not flow in the dry season all the way to the floor of the valley. The Tshala River has a diversion to a lined irrigation canal that always carries water, but there is very little flow that remains in the natural channel.
2.4. Water Sampling
The team of community health workers (CHW) that had previously conducted the MAL-ED (Malnutrition and Enteric Diseases) study in the same region [ 37 ] were recruited to assist with the data collection for this study; specifically, the regional description and water sources. These CHWs have an intimate knowledge of the communities as they are residents and have conducted health research in the area. The CHWs provided information on the location and condition of the various water sources in the study communities.
Water sources were tested during two intensive study periods: one in the dry season (June–August, 2016) and the other in the wet season (January–February, 2017). Water sources for investigation were selected based on identification from resident community health workers. Single samples were taken from all 28 identified drinking water sources in the 10 villages and three days of repeated samples were taken from six sources, which represented a range of sources (e.g., surface, borehole, shallow ground, pond, and municipal treated) in the dry season. Single samples of 17 of the original sources and three days of repeated samples were taken from five sources in the wet season, six months later. Some sources were not resampled because the routes to the sources were flooded, and these sources were likely infrequently used during the wet season due to blocked pathways. The wet and dry season measurements gave two different scenarios for water-use behaviors and allowed the researchers to measure representative water-quality parameters.
2.5. Measurement of Physicochemical Parameters
Physicochemical parameters of source water samples were measured in the field by a YSI Professional Plus meter (YSI Inc., Yellow Springs, OH, USA) for pH, dissolved oxygen and conductivity. The probes and meter was calibrated according to the manufacturer’s instructions. Turbidity was measured in the field with an Orbeco-Hellige portable turbidimeter (Orbeco Hellige, Sarasota, FL, USA) (U.S. Environmental Protection Agency method 180.1) [ 38 ]. The turbidimeter was calibrated according to the manufacturer’s instructions. Measured levels were compared to the South African water-quality standards in the regulations [ 39 ], pursuant to the Water Services Act of 1997.
2.6. Microbiological Water-Quality Analysis
Escherichia coli ( E. coli ) and total coliform bacteria were measured in both source and household water samples by membrane filtration according to U.S. Environmental Protection Agency method 10,029 [ 40 ]. Sample cups of the manifold were immersed in a hot-water bath at 100 °C for 15 min. Reverse osmosis water was flushed through the apparatus to cool the sample cups. Paper filter disks of 47 mm (4.7 × 10 −2 m) diameter and 0.45 μm (4.5 × 10 −7 m) pore size (EMD Millipore, Billerica, MA, USA) were removed from their sterile, individual packages and transferred to the surface of the manifold with forceps with an aseptic technique. Blank tests were run with reverse osmosis dilution water. Two dilutions were tested: full-strength (100 mL sample) and 10 −2 (1 mL sample with 99 mL of sterile dilution water) were passed through the filters; this provides a range of zero to 30,000 CFU/100 mL (colony forming units) for both E. coli and total coliforms. The filter paper was placed in a sterile petri dish with absorbent pad with 2 mL (2 × 10 −6 m 3 ) of selective growth media solution (m-ColiBlue24, EMD Millipore, Billerica, MA, USA). The samples were incubated at 35 °C (308.15 K) for 23–25 h. Colonies were counted on the full-strength sample. If colonies exceeded 300 (the maximum valid count), the dilution count was used. In all tests, the dilution value was expected to be within 10 −2 of the full-strength value and the sample was discarded otherwise.
The distribution of the household bacteria levels was evaluated by the (chi square) χ 2 goodness-of-fit test for various subsets of the data. Subsets of the data were then compared by an unpaired Student’s t-test for statistical significance; specifically, wet versus dry season levels as well as any other subsets that could demonstrate differences within the data.
2.7. Major Metals Analysis
A Thermo ICap 6200 Inductively Coupled Plasma Atomic Emission Spectrometer (ICP-AES, Chemetix Pty Ltd., Johannesburg, South Africa) was used to analyze the major metals in the various samples. The National Institute of Standards and Technology traceable standards (NIST, Gaithersburg, MD, USA) purchased from Inorganic Ventures (INORGANIC VENTURES 300 Technology Drive Christiansburg, Christiansburg, VA, USA) were used to calibrate the instrument for the quantification of selected metals. A NIST-traceable quality control standard from De Bruyn Spectroscopic Solutions, Bryanston, South Africa, were analyzed to verify the accuracy of the calibration before sample analysis, as well as throughout the analysis to monitor drift.
2.8. Trace Metals Analysis
Trace elements were analyzed in source water samples using an Agilent 7900 Quadrupole inductively coupled plasma mass spectrometer (ICP-MS) (Chemetix Pty Ltd., Johannesburg, South Africa). Samples were introduced via a 0.4 mL/min (7 × 10 −9 m 3 s −1 ) micro-mist nebulizer into a Peltier-cooled spray chamber at a temperature of 2 °C (275.15 K), with a carrier gas flow of 1.05 L/min (1.75 × 10 −5 m 3 s −1 ). The elements V, Cr, Mn, Fe, Co, Ni, Cu, Zn, As, Se were analyzed under He-collision mode to remove polyatomic interferences. NIST-traceable standards was used to calibrate the instrument. A NIST-traceable quality control standard of a separate supplier to the main calibration standards was analyzed to verify the accuracy of the calibration before sample analysis.
2.9. Anion Analysis
The anions were analyzed in source-water samples as stated in Edokpayi et al. [ 41 ]. Briefly, an Ion Chromatograph (Metrohm, Johannesburg, South Africa) was used to analyze the concentrations of fluoride, bromide, nitrates, chloride and sulfate. Calibration standards in the range of 1–20 mg/L were prepared from 100 mg/L stock solution containing all the test elements. Prior to analysis, the samples were filtered with a 0.45 μm (4.5 × 10 −7 m) syringe filter. Eluent for the sample run was prepared from sodium bicarbonate and sodium carbonate. A 50 mmol/L sulphuric acid with a flow rate of 0.5 mL/min (8 × 10 −9 m 3 s −1 ) was used as suppressant.
3.1. Socio-Demographic Characteristics of Enrolled Households
We included 405 enrolled households who completed the baseline questionnaire. The majority of caregivers were the mothers (n = 342, 84.4%, median age = 27 years) or grandmothers (n = 51, 12.6%, median age = 50 years) of a young child in the household. Almost all the caregivers had completed at least secondary school education (n = 371, 91.6%). Median monthly income for the entire household was USD$106 (interquartile range (IQR): 71–156). Access to improved sanitation was high. 373 (n = 92.1%) households used an improved pit latrine, and only 19 (n = 4.7%) reported open defecation. However, few households (n = 35,8.6%) reported having a designated place to wash hands near their toilet, and only 29% (n = 119) reported always using soap when washing hands.
Most households had their primary water source ( Table 2 ) piped into their or their neighbor’s yard (dry: n = 226, 62.3%; wet: n = 241, 67.5%) or used a public tap (dry: n = 69, 19.0%; wet: n = 74, 20.7%). A minority (dry: n = 40, 11.0%; wet: n = 19, 5.3%) collected their water directly from rivers, lined canals, or springs. Water was collected by adult women in most households, and it was reported to take a median of 10 min (IQR, both seasons: 5–30) to go to their water source, collect water, and come back in one trip. Three quarters (n = 270, 74.4%) reported that their water source was not continually available in the dry season and two-thirds (n = 234, 65.5%) in the wet season. Almost half (48.9%) reported interruptions in availability that lasted at least 7 days in the dry season and 32.8% in the wet season. Households stored water during interruptions and/or collected water from alternative sources (dry: n = 133, 36.6%; wet: n = 115, 32.2%), which were surface water or shallow groundwater sources (e.g., rivers, lined canals, or springs).
Primary drinking-water sources reported among 363 and 357 households in the study area in the dry and wet seasons, respectively.
Household water was most frequently stored in jerry cans or plastic buckets (n = 363, 89.7%), while 25 households stored water in large drums or plastic tanks (6.2%). Most households reported that their drinking water containers were covered (n = 329, 81.2%), but most used a cup with a handle (n = 281, 69.4%) or their hands (n = 93, 23.0%) for water collection ( Table 3 ). Only 13.3% (n = 54) households reported treating their water, mainly by boiling (n = 22), chlorine (n = 15), or letting the water stand and settle (n = 11).
Mode of water collection from storage containers.
Approximately one-third of caregivers (n = 114, 28.2%) perceived that one can get sick from drinking water (n = 114, 28.2%), and cited diarrhea, schistosomiasis, cholera, fever, vomiting, ear infections, malnutrition, rash, flu and malaria as specific illnesses associated with water. Despite these perceptions, the majority were satisfied with their current water source (n = 297, 73.3%). Those who were unsatisfied cited reasons of insufficient quantity (n = 75), shared water supply (n = 65), uncleanliness (n = 73), cloudiness (n = 47), and bad odor or taste (n = 38).
3.2. Physicochemical and Microbiological Characteristics of the Water Sources
pH and conductivity values ranged between 5.5–7.3 and 24–405 μS/cm in the wet season and 5.8–8.7 and 8–402 μS/cm in the dry season ( Table S1 ). Both pH and conductivity levels were within the recommended limits of the World Health Organization (WHO) for drinking water. The microbiological results and turbidity of the sources tested are presented in Figures Figures4 4 and and5, 5 , and Table S2 , respectively. Microbiological data show contamination with E. coli , a fecal coliform that is potentially pathogenic, and other coliform bacteria.

Membrane filtration results for ( a ) E. coli and ( b ) other coliforms. Data are presented for wet and dry seasons. The four ephemeral rivers (*) have no dry season data because they had no flow; all other sources have the results reported, some of which are zero or near-zero. South African National Standard (SANS 241:1-2015) set the limit of 0 CFU/100 mL for E. coli and 10 CFU/100 mL for total coliforms (CFU/10 −4 m 3 ). Ephemeral rivers that do not flow all the way into the valley are indicated (*) in the dry season.

Turbidity of the water sources in the study area. Two to three measurements were taken during an intensive study period from 13 January 2017 to 4 February 2017 in the wet season and three to four measurements from 5 June 2016 to 15 July 2016 in the dry season. The median measurement of the values is reported here. Ephemeral rivers that do not flow all the way into the valley are indicated (*) in the dry season.
Municipal treated water never showed any detectable colony-forming units (CFU) in a 100 mL sample for E. coli , which is within the Soufh African regulation [ 39 ]. In the wet season, other coliform bacteriaweae detected in the treated wtter (a median valueof 10 CFU/100 mL wac recorded).
Household sample of stored water ( Figure 6 ) show that bacterial contamination levels ranged from no detectable colonies lo the maximum detection level of our protocol of 30,000 CFU/100 mL. There is a trend that total colitorm levels ere lower (during the wet season than the dry season. In the wet season, some communities within the sturdy area had access to constant municipal treated water as monitored by researcher verification of public tap-watcr availebJlity. Othet communities had intermittent access to municipal treated water. Of these honseholds, those that had constant access to treated water at or near their household did have less total coliform in their stored water than those with intermittent services ( Figure 7 ). This neglects the communities that are outside of the municipal treated-water servic e area.

Box-and-whisker plot of total coliform measurements of stored, untreated water in study households in the wet (n = 95) and dry (n = 103) seasons. The box-and-whisker plot indicates the mean (diamond), first, second, and third quartiles (box), and minimum and maximum (whiskers).

Box-and-whisker plot of total coliform measurements of stored water in the wet season in study households in communities that had verified continuous access to municipal treated water versus verified intermittent access.
The total coliform from households in communities with verified continuous treated water had a log-normal distribution (verified by 99%, α = 1 significance level, χ 2 goodness-of-fit test) and were statistically significantly lower (α =1 significance level) than those from households in communities with verified intermittent treated water. Unfortunately, due to the low number of samples from intermittent households, a χ 2 goodness-of-fit test was not meaningful.
3.3. Anion Concentrations
Major anions investigated in the various water sources fell within the recommended guideline values from the WHO [ 42 ]. Fluoride concentrations ranged from below the detection limit (bdl) to 0.82 mg/L in the dry season and to 1.48 mg/L ( Table S3 ) in the wet season. Fluoride levels fell below the threshold limit for fluoride in drinking water from the WHO (1.5 mg/L). Nitrates were also observed within the limit of drinking water, between bdl–17.48 mg/L and bdl–9.72 mg/L in the dry and wet seasons, respectively. Chloride, sulfate and phosphate levels were also present in moderate levels in the various water sources; however, a relatively high concentration of chloride of 462.9 mg/L was determined in the Mutale River in the wet season.
3.4. Trace and Major Elements Composition
Major metals in the various water sources in both seasons complied with the recommended limits of SANS and WHO in drinking water [ 39 , 42 ]. Sodium concentrations in the range of 3.14–41.03 mg/L and 3.02–15.34 mg/L were measured in the wet and the dry seasons, respectively ( Table S4 ). Low values of potassium were measured. Calcium levels ranged between 0.66–33.91 mg/L and 0.53–27.39 mg/L, in the wet and dry seasons, respectively. Low levels of magnesium were also found. Most of the water sources can be classified as soft water owing to the low levels of calcium and magnesium. Aluminium (Al) concentration ranged between 39.18–438 μg/L ( Figure 8 ). Two of the water sources which are community-based water supply systems recorded high levels of Al which exceeded the aesthetic permissible levels of drinking water; others fell within this limit. Similarly, the levels of iron (Fe) varied between 37.30–1354 mg/L and 35.21–1262 mg/L in the wet and the dry seasons, respectively ( Figure 9 ). Some of the sources showed high Fe concentration which exceeded the aesthetic permissible limit of WHO in drinking water [ 42 ]. Two community-based water systems had higher levels of Fe in the wet season as well as the major river in the region (Mutale River) for which high Fe levels were observed in both seasons. One of the clinic boreholes also recorded high levels of Fe above the permissible aesthetic value of (300 mg/L) in both seasons. Temporary seasonal variation was significant only in the levels of Fe and Al. In the wet season, their levels were generally higher than in the dry season. Some other trace metals of concern like Pb, Hg, As, Cd, Cr, Ni, Cu, Mn, Sr were all present at low levels that were below their recommended limits in drinking water for both seasons ( Table S5 ).

Aluminum, measured by an inductively coupled plasma mass spectrometer (ICP-MS), concentration for natural sources in the study area in the wet and dry seasons. The SANS 241 standard is shown (an operational standard is intended for treated water). Sources marked with * are intermittent sources and had no dry-season sample. Other sources have measured concentrations; although they may be too low to plot.

Iron, measured by an ICP-MS, concentration for natural sources in the study area in the wet and dry seasons. The SANS 241 standard is shown. Sources marked with * are intermittent sources and had no dry-season sample. Other sources have measured concentrations; although they may be too low to plot.
4. Discussion
This study provides a comprehensive description of water quality and drinking-water use across seasons in a low-resource community in rural South Africa, including a variety of water sources, ranging from the municipal tap to natural sources and a combination of both when the municipal tap was intermittently available.
Water sources in the study area, aside from the municipal tap, were highly contaminated with E. coli in both the wet and dry seasons; that is, E. coli was above the South African standard (acute health) of 0 CFU/100 mL. It is particularly important to note that E. coli was detected in the boreholes used for water at the local clinics, implying inadequate access to potable water for potentially immunocompromised patients. While the municipal treated water met the E. coli detection limit, the municipal tap did not always fall within the standards of turbidity (≤1 NTU operational and ≤5 NTU aesthetic) and total coliform (≤10 CFU/100 mL) [ 39 ]. These are not direct health risks; however, both measurements can be used to judge the efficacy of the treatment process and suggest that treatment may not have removed other pathogens that were not directly tested, such as protozoan parasites.
While the microbiological contamination of the drinking-water sources was not acceptable, the chemical constituents fell within the South African guidelines [ 39 ]. Calcium, sodium, magnesium and potassium were present in low levels and their concentrations complied with regulatory standards of SANS [ 39 ] and WHO [ 42 ]. Some metals (cadmium, mercury, arsenic and lead) known to be carcinogenic, mutagenic and teratogenic, causing various acute and chronic diseases to humans even at trace levels in drinking water, were investigated and found to be present in very low concentrations that could be of no health risk to the consumers of the various water resources in the region. However, some other metals, such as Al and Fe, were higher in some of the water sources; yet these were still well below the health guidelines for the respective constituent (recommended health levels from SANS and WHO are given as Al < 0.9 mg/L, Fe < 2 mg/L). At these levels, they do not present a health risk but could impart color and significant taste to the water thereby affecting its aesthetic value. Water sources from the community water-supply systems and one of the clinic boreholes recorded higher levels of Al and Fe. The other metals evaluated (copper, zinc, nickel, chromium, Se and Mn) were present in low levels that complied with their recommended limits in drinking water [ 39 , 42 ].
Fluoridation of drinking water is a common practice for oral health in many countries [ 43 ]. The required level of fluoride to reduce incidences of dental caries is in the range of 0.6–0.8 mg/L; however, levels above 1.5 mg/L are associated with dental and skeletal fluorosis [ 43 – 45 ]. The likelihood of fluorosis as a result of high concentration of fluoride is low in these communities, but there could be a high incidence of dental caries since fluoride levels below 0.6 mg/L were measured and some of the water sources did not have fluoride concentrations detectable by the instrument. The National Children’s Health Survey conducted in South Africa showed that 60.3% of children in the age group of 6 years have dental caries. Approximately a third (31.3%) of children aged 4–5 years in Limpopo province have reported cases of dental caries [ 44 , 45 ].
Chloride levels in the water sources do not cause any significant risk to the users except imparting taste to the water for some of the sources that recorded chloride levels above 300 mg/L. Although the study area is characterized by farming activities, the nitrate concentrations measured do not present any health risks. Therefore, the occurrence of methemoglobinemia or blue-baby syndrome as a result of high nitrate levels is unlikely. Other anions were present in moderate levels that would also not constitute any health risks. The levels of all the anions determined in the various sources were lower than the recommended guidelines of WHO [ 42 ].
The microbiological analysis of environmental water sources revealed several trends. Without exception in these samples, bacterial levels in the wet season were higher than in the dry season. This may be caused by greater runoff or infiltration, which carries bacteria from contaminated sources to these water bodies. The upward trend in bacteria in the municipal treated water is not explained by an increase in runoff, but may be due to higher turbidity of the intake for the municipal treated water in the wet season. The treatment facility workers reported to the researchers that they were unable to monitor the quality of the treated water due to instrument failure during the wet season surveillance period.
Water stored in the household showed that the mean total coliform in the wet season was lower than that in the dry season. This trend is opposite to what was observed in the source, or environmental samples. This difference may be explained by the greater availability of treated water in the wet season versus the dry season for approximately 40% of the sampled households ( Figure 7 ). In addition, it is possible that families try to save water during the dry season and do not reject residual water, while the rainy season allows easier washing of the container and for it to be filled with fresh water more regularly.
In the wet season, two communities had consistently treated water available from household connections (usually a tap somewhere in a fence-in yard) or public taps. While the municipal treated water was of lower quality in the wet season than the dry season, the quality was significantly better than most environmental sources.
Another potential explanation is that residents stored their water within their households for a shorter time, which is supported by the use data that showed interruptions in supply were more common and for longer duration in the dry season. The quality of the water stored in households with continuous supply versus intermittent supply also suggests that water availability may play a role in household water quality. This is consistent with research that demonstrates that intermittent water supply introduces contamination into the distribution system in comparison with continuous supply [ 46 ]. Intermittent supply of water may also result in greater quantity and duration of storage at household level, which could increase the likelihood of contamination.
While it has been shown that the quality of water used for drinking in these villages does not meet South African standards, this problem is confounded by evidence from surveys indicating that residents believe they have high-quality water and, therefore, do not use any form of treatment. In the rare case that they do, it is by letting the water stand and settle or by boiling. In addition, even if treated water is collected, there is a risk of recontamination during storage and again when using a cup held by a hand to retrieve water from storage devices, which was common in surveyed homes. In addition, there was little to no detectable residual chlorine in the municipal tap water to prevent recontamination. A previous study performed in an adjacent community showed higher household treatment levels; however, this may have been due to intervention studies in that community (the community in question was excluded from this study because of previous interventions) [ 47 ]. The study also concurred that boiling was the most common method employed.
Given that most of the water from the various sources in this community is contaminated and not treated, there is a high risk of enteric disease in the community. Lack of access to adequate water and sanitation cause exposure to pathogens through water, excreta, toxins, and water-collection and storage pathways, resulting in immense health impacts on communities [ 48 ]. A large burden of death and disability due to lack of access to clean water and sanitation is specifically associated with diarrheal diseases, intestinal helminths, schistosomiasis and trachoma [ 49 ]. While it was found in this study that the study area has a high prevalence of improved sanitation, the likelihood of poor water quality due to intermittent supply and lack of treatment poses a risk of the adverse health effects described. In a previous longitudinal cohort study of children in these villages, most children were exclusively breastfed for only a month or less, and 50% of children had at least one enteropathogen detected in a non-diarrheal stool by three months of age [ 50 ]. Furthermore, the burden of diarrhea was 0.66 episodes per child-year in the first 2 years of life, and stunting prevalence (length-for-age z-score less than −2) in the cohort increased from 12.4% at birth to 35.7% at 24 months [ 50 ]. It is likely that contaminated water contributed to the observed pathogen burden and stunting prevalence in these communities. In summary, microbiological contamination of the drinking water is high in the study area, and risk from other chemical constituents is low. Therefore, engineered solutions should focus more on improving the microbiological quality of the drinking water.
The intermittent supply in municipal tap water, inadequate water quality from alternative sources, and the risk of recontamination during storage suggest a need for a low-cost, point-of-use water-treatment solution to be used at the household level in these communities. Access to clean drinking water will contribute to improving the health of young children who are at highest risk of the morbidity and mortality associated with waterborne diseases. Such an intervention may go beyond the prevention of diarrhea by impacting long-term outcomes such as environmental enteropathy, poor growth and cognitive impairment, which have been associated with long-term exposure to enteropathogens [ 51 ]. This is supported by a recent finding that access to improved water and sanitation was associated with improvements on a receptive vocabulary test at 1, 5 and 8 years of age among Peruvian, Ethiopian, Vietnamese and Indian children [ 52 ]. The implementation of point-of-use water treatment devices would ensure that water is safe to drink before consumption in the homes of these villages, improving child health and development.
5. Conclusions
This study was comprehensive in the assessment of all aspects of water quality and corresponding water-use practices in rural areas of Limpopo Province. The results obtained indicate that microbiological water quality is more likely to have adverse effect on the consumers of natural water without adequate treatment, as E. coli was determined in all the natural water sources. Local needs assessments are critical to understanding local variability in water quality and developing appropriate interventions. Interventions to ensure clean and safe drinking water in rural areas of Limpopo province should, first and foremost, consider microbiological contamination as a priority. Risk-assessment studies of the impact of water quality on human health is, therefore, recommended.
Supplementary Material
Tables s1 through s5.
Table S1: Physical characteristics of water sources. Two to three measurements were taken during an intensive study period from 13 January 2017 to 4 February 2017 in the wet season, and three to four measurements from 5 June 2016 to 15 July 2016 in the dry season. The median measurement of the values is reported here. Sites with missing samples, such as ephemeral rivers that do not flow all the way into the valley in the dry season, are indicated (*). Sites with missing data due to instrument failure are indicated (#). Values that were below the detection limit are indicated (bdl). South African regulation (SANS 241:1-2015) and the World Health Organization Recommended Guidelines for Drinking Water Quality (Fourth Edition) are listed; parameters not listed are indicated (nl),
Acknowledgments:
This project was funded by the Fogarty International Center (FIC) of the National Institutes of Health (NIH) (Award Number D43 TW009359), National Science Foundation (NSF) (Award Number CBET-1438619), the Center for Global Health at the University of Virginia (CGH), and the University of Virginia’s Jefferson Public Fellows (JPC) program. The content is solely the responsibility of the authors and does not represent the official views of the funders. The authors also acknowledge the tireless work of the community field workers who undertook interventions and collected all of the survey data. The authors also acknowledge A. Gaylord, N. Khuliso, S. Mammburu, K. McCain and E. Stinger, who performed much of the water-quality analysis and T. Singh, who supported the laboratory analysis for inorganic materials.
Supplementary Materials: The following are available online at www.mdpi.com/s1 ,
Conflicts of Interest: The authors declare no conflict of interest.
- News Releases
- About the Certificate
- Benefits of the Certificate
- Certificate FAQ
- Meet Our Students
- Meet Our Visiting Scholars
- Meet Our Partners
- Certificate Contact Us
- WRP 521 Course
- Research and Projects
- Map and Image Galleries
- Digital Collections
- Publications
- Useful Resources
- Past Facilitations & Workshops
- Available Materials
- From Potential Conflict to Cooperation Potential (PCCP)
- International Center for Integrated Water Resources Management
- International H2O Solutions
- International Water Management Institute (IWMI)
- Northwest Alliance for Computational Science & Engineering
- University Consortium on Columbia River Governance
- Universities Partnership for Water Cooperation & Diplomacy
Case Studies - Water Conflict Resolution
The following Case Studies are adapted from:
Wolf, Aaron T. and Joshua T. Newton. 2008. "Case Studies of Transboundary Dispute Resolution." Appendix C in, Delli Priscoli, Jerry and Aaron T. Wolf. Managing and Transforming Water Conflicts. Cambridge: Cambridge University Press.
The purpose of the case studies are to review the literature on water disputes and related water treaties to gain an understanding of why previous and current disputes over water have occurred and to seek out lessons to be learned in preventing similar future disputes. This work focuses on transboundary freshwaters. The case studies accessible below are summaries of the processes of conflict resolution are offered here for comparative purposes. PDFs of each case study are below; the maps can found in the Map and Image Gallery .
International River Basins
Nile Senegal
Euphrates-Tigris Ganges Indus Jordan (including West Bank aquifers) Kura-Araks Mekong Middle East Salween
South America
Aquifer systems.
Guarani aquifer US-Mexico aquifers West Bank aquifers (included with Jordan watershed)
Aral Sea Great Lakes Lake Titicaca
Engineering Works
Lesotho Highlands Project
Subject Case Studies
River Basins Organizations International Water Pricing
- Database Home
Water Resources Class 10 Geography Chapter 3 Extra Questions and Answers
CBSE Class 10 Geography Chapter 3 Water Resources Extra Questions and Answers is available here. Students can learn and download PDF of these questions for free. These extra questions and answers are prepared by our expert teachers as per the latest NCERT textbook and guidelines. Learning these questions will help you to score excellent marks in the board exams.
Water Resources Class 10 Extra Questions Geography Chapter 3
Very short answer type questions.
1. How is freshwater obtained
Answer: The freshwater is obtained from precipitation, surface run off and groundwater that is continually being renewed and recharged through the hydrological cycle.
2. What is hydrological cycle Answer: The continuous movement of water on, above and below the surface of earth.
3. What is the importance of hydrological cycle
Answer: The freshwater is mainly obtained from surface run off and groundwater that is continually being renewed and recharged through the hydrological cycle. All water moves within the hydrological cycle ensuring that water is renewable resource.
4. What is water scarcity [CBSE 2014] Answer: Water scarcity is the lack of sufficient available water resources to meet the demand.
5. “The availability of water resources varies over space and time”. Give reasons. Answer: Water resources varies over space and time due to the variation in seasonal and annual precipitation.
6. What percentage of the total volume of world’s water is estimated to exist as oceans
Answer: 96.5%
7. How much per cent of the total volume of world’s water is estimated to exist as fresh water
Answer: 2.5
8. What are the sources of fresh water? Answer: Precipitation, surface run off and groundwater.
9. How is freshwater being renewed Answer: The freshwater is being renewed through the hydrological cycle.
10. Mention any two regions which are expected to face water shortage. Answer: (i) Regions having low rainfall (ii) Regions which are drought prone.
11. What is a dam Answer: ‘A dam’ is a barrier across the flowing water that obstructs dissects or retards the flow, often creating a reservoir, lake or impoundment.
12. What is a multipurpose project Answer: A multipurpose project is that which fulfils a . variety of purposes at the same time, for example – irrigation, generation of electricity, flood control, fish breeding, soil conservation etc.
13. Who proclaimed dams as the temples of modem India Answer: Jawaharlal Nehru.
14. Why were the multipurpose river projects considered as temples of modem India by Jawaharlal Nehru Answer: These would integrate development of agriculture and the village economy with rapid industrialisation and growth of the urban economy.
15. Name any two social movements which have been launched against the multipurpose projects. Answer: Narmada Bachao Andolan and ‘Tehri Dam’ Andolan.
16. What was considered as a viable alternative to the multipurpose projects and why [CBSE 2013] Answer: The. disadvantages and rising resistance against the multipurpose projects, has lead us to conclude that water harvesting system is a viable alternative, both socio-economically and environmentally.
17. Irrigation has changed the cropping pattern of many regions with farmers shifting to water intensive and commercial crops”. Mention its ecological consequence. Answer: Salinisation of the soil
18. What was the primary reason for launching ‘Narmada Bachao Andolan’ Answer: Narmada Bachao Andolan was launched due to the large scale displacement of local communities.
19. What is silt Answer: A fine soil which is formed in flood plains.
20. How people used to conserve or harvest water in hills and mountainous regions Answer: By building diversion channels like the ‘guts’ or ‘kuls’.
21. How people used to harvest water in the flood plains of Bengal Answer: By building inundation channels to irrigate their fields.
22. How people harvest water in the semi- arid and arid regions of Rajasthan Answer: By building underground tanks.
23. Many people of arid and semi-arid regions construct under-ground rooms adjoining the water tanks. Give reason. Answer: By beating the summer heat it would keep the room cool.
24. Name two techniques of roof top rain water harvesting. [CBSE 2009(0)] Answer: (i) Recharge through hand pump. (ii) Recharge through abandoned dug well.
25. Name any two states where roof top water harvesting is most common. Answer: Meghalaya and Rajasthan.
26. Define the term Tankas. [CBSE 2008 (F)] Answer: Tankas are the underground tanks for storing drinking water.
27. Which is the purest form of natural water Answer: Rainwater
28. What is Kul Answer: It is a circular village tank from which water is released and taken when required.
29. Name any two states which are involved in Krishna-Godavari-dispute. Answer: Karanataka and Andhra Pradesh.
30. Name the river on which the Hirakud dam is located. [CBSE 2013] Answer: Mahanadi
31. Name the river on which the Mettur dam is located. Answer: Kaveri
32. Name the river on which the Nagarjuna Sagar dam is located.
Answer: Tungabhadra
33. Name the river on which the Rihand dam is located. Answer: Son
34. Name the river on which the Bhakra Nangal dam is located. [CBSE 2014] Answer: Satluj
35. Name the river on which the Koyna dam is located Answer: Krishana
36. Name the river on which the Sardar Sarovar dam is located. Answer: Narmada
37. What is the contribution of hydroelectricity in the total generation of electricity. Answer: 22%
Short Answer Type Questions
1. What is hydrological cycle? What is its importance
Answer: The continuous movement of water on, above and below the surface of earth is known as hydrological cycle. The freshwater is mainly obtained from surface run off and ground water that is continually being renewed and recharged through the hydrological cycle. All water moves within the hydrological cycle 5. ensuring that water is a renewable resource.
2. How has agriculture aggravated the problem of water scarcity in India Explain. [CBSE 2014]
Answer: (i) Water is a basic input in agriculture. It is used for irrigation. (ii) HYV seeds needs more water as compared to traditional seeds. (iii) Commercialisation of agriculture has also lead to withdrawal of groundwater at a large scale. (iv) Overuse of groundwater is another problem associated with agriculture. The water table has lowered in many parts of India due to its overuse.
3. “Water scarcity may be an outcome of large and growing population”. Justify.
Answer: (i) A large population means more water not only for domestic use but also to produce more food. (ii) Most of the Indian cities are facing the problem of water due to growing population. . (iii) A growing population has also a direct impact on the water level.
4. How does urbanisation and urban lifestyle lead to over-exploitation of water resources Explain. [CBSE 2013]
Answer: (i) Most of our cities are over populated. Overpopulation leads to our utilisation of water resources. (ii) Urbanisation especially unplanned urbanisation adds to water pollution. (iii) Urbanisation also damages the existing water resources especially the river. For example, most of Indian river have been polluted by the waste of cities.
5. Is it possible that an area or region may have ample water resources but is still facing water scarcity Explain with the help of three relevant examples. [CBSE 2013]
Answer: Yes, it is possible that an area or region may have ample water resources but is still facing water scarcity. Most of our cities are facing this problem. (i) In most of our cities there is no shortage of water but the water is unfit for consumption. (ii) Most of our cities are in the banks of rivers, but rivers have been turned into toxic streams. (iii) The ever increasing population, industries and vehicles has made matter worse by exerting pressure on existing freshwater resources.
6. What is importance of water [CBSE 2012] Or “Water is a very important and critical resource in India.” Support the statement by explaining any three points. [CBSE 2013]
Answer: (i) Water is vital for human survival. (ii) Water is used for transportation. (iii) In industries water is used as a coolant. (iv) Water is also used for power production. (v) Water is a basic input for agriculture.
7. How do increasing number of industries exert pressure on existing freshwater resources [CBSE 2012]
Answer: (i) industries used water as coolant, raw material, solvent, etc. (ii) Industries release harmful chemicals which contaminates water. (iii) Most of the Indian rivers are polluted due to toxic chemicals which are released by industries.
8. What are dams? How do these help to conserve and manage water
Answer: A dam is a barrier across flowing water that obstructs, directs or retards the flow often creating a reservoir, lake or impoundment. (i) Dams were traditionally built to impound rivers and rainwater that could be used later to irrigate agricultural fields. (ii) Dams are also source of perennial canals.
9. Distinguish between a dam and a multipurpose project.
Answer: Dam 1. A dam is barrier across the flowing water that obstructs, dissects or retards the flow, often creating a reservoir, lake or an impoundment 2. It is a traditional concept.
Multipurpose project. 1. A multipurpose project is that which fulfils a variety of purposes at the same time, for example – irrigation, generation of electricity, flood control, fish breeding, soil conservation, etc. 2. It is a modern concept.
10. Who proclaimed the dams as the temples of modern India Give reason.
Answer: Jawaharlal Nehru proudly proclaimed the dams as the ‘temples of modem India’; the reason being that it would integrate development of agriculture and the village economy with rapid industrialisation and growth of the urban economy.
11.‘Multipurpose projects and large dams have also been the cause of many social movement’. Name any two such movements. Why these movements were launched
Answer: Multipurpose projects and large dams have also been the cause of many new social movements like the ‘Narmada Bachao Andolan’ and ‘Tehri Dam Andolan’ etc. Resistance to these projects has primarily been due to the large – scale displacement of local communities. Local people often had to give up their land, livelihood and their meagre access and control over resources for the greater good of the nation.
12. How do the dams create conflicts between the people
Answer: (i) The dams have created conflicts between people wanting different uses and benefits from the same water resources. (ii) Inter-state water disputes are becoming common with regard to sharing the costs and benefits of the Projects. (iii) The landowners, the rich farmers, industrialists and urban centres are benefitting at the cost of local communities.
In Gujarat, the Sabarmati – basin farmers were agitated and almost caused a riot over the higher priority given to water supply in urban areas, particularly during droughts. Inter – state water disputes are also becoming common with regard to sharing the costs and benefits of the multipurpose project.
13. How has irrigation changed the cropping pattern? What is its impact on the social landscape [CBSE Sep 2012]
Answer: Due to irrigation facilities many farmers have shifted to water intensive and commercial crops. For example, Punjab has become major producer of rice inspite of low rainfall. Impact on social landscape: This transformation has widens the gap between rich and poor. The rich and mighty who can afford higher inputs has become more rich whereas the poor have failed to get benefit due to lack of capital.
14. Explain three ways in which irrigation schemes have changed the social landscape of the region. [CBSE 2012]
Answer: (i) Displacement of the local people : Local people often had to give up their land, livelihood and their meagre access and control over resources for the greater good of the nation. (ii) Social movements : Multipurpose projects and large dams have also been the cause of many new social movements like the ‘Narmada Bachao Andolan’ and the ‘Tehri Dam Andolan’, etc. (iii) Widening the gap between rich and poor : Multipurpose projects have widened the gap between rich and poor. The landlords, large farmers and industrialist are getting benefit at the cost of poor.
15. “Multipurpose projects have failed to achieve the purpose for which they were built”. Justify by giving reasons. [CBSE 2014]
Answer: (i) These dams were constructed to control floods but they have triggered floods due to sedimentation in the reservoir. (ii) Moreover, the big dams have mostly been unsuccessful in controlling floods at the time of excessive rainfall. (iii) Many a time authorities are forced to release water from dams during heavy rainfall.
16. What is rainwater harvesting What is its importance
Answer: It is a technique of increasing the recharge of ground water by capturing and storing rainwater by constructing structures such as percolating pits, check dams, etc.
Importance:- (i) Rainwater harvesting is the need of hour as demand for water is increasing day by day. (ii) Rainwater harvesting reduces pressure on existing water resources. (iii) It is cheap source of water supply. (iv) It helps in recharging groundwater. (v) The rainwater store is extremely reliable source of drinking water when all other sources are dried up.
17. (i) What is a multipurpose project [CBSE 2009 (D) ; Sept. 2010, 11] (ii) Why did Pandit Jawahar Lal Nehru proclaim the river dams as the ‘Temples of Modem India?’ Explain the main reason. [CBSE 2014]
Answer: (i) A multipurpose project is that which fulfils a variety of purposes at the same time, for example – irrigation, generation of electricity, flood control, fish breeding, soil conservation, etc. (ii) It would integrate development of agriculture and the village economy with rapid industrialisation and the growth of urban economy.
18. Explain the rooftop rainwater harvesting technique.
Answer: (i) Rooftop rainwater is collected using a PVC pipe. (ii) Collected water is filtered using sand and bricks. (iii) Underground pipe is used to take the water to the sump for immediate usage. (iv) Excess water from the sump is taken to the well. (v) Water from the well recharges the underground water.
19. Why are different water harvesting systems considered a viable alternative both socio economically and environmentally in a country like India [CBSE Sept. 2010, 2011]
Answer: (i) Water harvesting is a very cheap and affordable method of conservation of water. (ii) Indian people have in-depth knowledge of rainfall regime and soil type. They have developed techniques to harvest rainwater, groundwater, rain water and flood water in keeping with the local ecological conditions and their water needs. (iii) Rainwater harvesting techniques are more environmental friendly as compare to multipurpose river projects.
Long Answer Type Questions
1. How have the growing population, industrialisation and urbanisation led to water scarcity Explain.[CBSE 2008 (D)] Or Explain any four reasons responsible for water scarcity in India. [CBSE 2010(D), Sept. 2012] Or How have industrialisation and urbanisation aggravated water scarcity in India [CBSE Sept. 2010, 14] Or Give three reasons for water scarcity in post independent India. [CBSE Sept. 2010] Or ‘Three-fourths of the earth’s surface is covered with water but there is still scarcity of water across the globe.’ Explain giving three reasons. [CBSE 2011]
Answer: (i) Growing population : Growing population is one of the basic factors which is responsible for the scarcity of water. Most of our cities are facing this problem due to overpopulation. A large population means more water not only for domestic use but also to produce more food.
(ii) Commercialisation of agriculture : After the success of Green Revolution, our farmers are producing commercial crops. The commercial crops need more water and other inputs. Assured means of irrigation like tube wells and wells are responsible for the falling groundwater levels.
(iii) Industrialisation : The post independent India witnessed intensive industrialisation and urbanisation. Today, large industrial houses are common in the form of industrial units of many MNCs (Multinational Corporations). The ever increasing number of industries has made matters worse by exerting pressure on the existing freshwater resources. Industries, apart from being heavy users of water, also require power to run them. Much of this energy comes from the hydroelectric power.
(iv) Urbanisation : Urbanisation has also aggravated the problem of water scarcity. Most of our cities are overpopulated. Overpopulation leads to over- utilisation of the water resources, and also pollutes the existing resources.
2. How do the multipurpose river projects affect the aquatic life Explain. Or Explain the ecological problems being faced due to the multi-purpose river projects. [CBSE 2013]
Answer: In recent years, the multi-purpose projects and large dams have come under great scrutiny and opposition for a variety of reasons : (i) Regulating and damming of rivers affect their natural flow causing poor sediment flow and excessive sedimentation at the bottom of the reservoir, resulting in rockier streambeds and poorer habitats for the rivers, as well as the aquatic life. (ii) Dams also fragment rivers making it difficult for the aquatic fauna to migrate, especially for spawning. (iii) The reservoirs that are created on the flood. Plains also submerge the existing vegetation and soil leading to its decomposition over time. (iv) Irrigation has also changed the cropping pattern of many regions with farmers shifting to water intensive and commercial crops. This has great ecological consequences like salinisation of the soil.
3. Explain the quantitative and qualitative aspects of water scarcity. Or Water is available in abundance in India even then scarcity of water is experienced in major parts of the country. Explain with four examples. [CBSE 2008 (D)]
Answer: (i) Quantitative aspect : This aspect is related to the availability of water resources. The availability of water resources varies over space and time mainly due to variations in seasonal and annual precipitation. However, water scarcity in most cases is caused by over-exploitation, excessive use and unequal access to water among different social groups.
(ii) Qualitative aspect : Now, let us consider another situation where water is sufficiently available to meet the needs of the people, but, the area still suffers from water scarcity. This scarcity may be due to bad quality of water. Lately, there has been a growing concern that even if there is ample water to meet the needs of the people, much of it may be polluted by domestic and industrial wastes, chemicals, pesticides and fertilizers used in agriculture, thus, making it hazardous for human use.
4. Why is there an urgent need to conserve and manage our water resources Mention three reasons. [CBSE 2012] Or Why is it necessary to conserve water resources in India Explain. Or Why is it essential to conserve, and manage our water resources Explain any three reasons. [CBSE 2012] Or Why we should conserve our water resources Explain any three reasons. [CBSE 2012,2014]
Answer: (i) Precondition for life : Water is necessary for life on earth. It is believed that life originated in water before it invaded land. Water is in fact a precondition of life. (ii) Water essential for crops: Cultivation of crops depends on the availability of water. Water dissolves minerals and other nutrients in the ground. The roots of the plants draw this nutritious water for the soil. India is an agricultural country so availability of water is a must. (iii) Water and industries : Industries need water as coolant, solvent, raw material, etc. (iv) Water for daily life : Water is also used for drinking and domestic consumption. The growing urbanisation with its modern lifestyle has been demanding greater share of water day by day. (v) Water an important component of ecosystem : Conservation of water is also important to prevent degradation of our natural ecosystems. (vi) Water scarcity : It is essential to conserve and manage water because its overuse and misuse has lead to water scarcity.
5. Examine the importance of the river valley projects in the development of hydel power and irrigational facilities in India. Or Give any four objectives of the multipurpose river valley projects. [CBSE Sept. 2011]
Answer: (i) Generation of Power (electricity) : These multipurpose projects are the main source of power generation. According to the Economic Survey, 2013, these produce more than 39,788.40 MW power. They provide us neat, pollution free and cheapest energy which is the backbone of industry and agriculture. (ii) Flood Control : These projects control the floods because water can be stored in them. These projects have converted many ‘rivers of sorrows’ into ‘rivers of boon’. For example, the river Kosi. (iii) Soil Conservation : They help to conserve the soil because they slow down the speed of water. (iv) Irrigation : These projects are the main source of irrigation for our country. These irrigate the fields during the dry seasons. Many perennial canals have been dug and they irrigate dry areas.
6. “In recent years, the multipurpose projects and large dams have come under great scrutiny.” Give reasons. [CBSE Sept. 2012] Or Mention any four disadvantages of multi purpose projects. [CBSE Sept. 2010, 2013] Or . How may the multipurpose river valley projects become harmful for the country Explain with four examples. [CBSE 2008] Or Why are multipurpose projects facing resistance Explain with three reasons. [CBSE Sept.2010]
Answer: (i) Adverse effect on the fertility of the soil : Due to the construction of dams, there are no annual floods in the river. And because of this, the soil of the downstream region does not get nutrient rich “silt”. This decreases the fertility of the soil.
(ii) Adverse impact on aquatic life: Due to the construction of dams on the rivers, the fish in the downstream area do not get sufficient nutrient material. Regulating and damming of rivers affect the natural flow of water causing poor sediment flow downward, and excessive sedimentation at the bottom of reservoir, resulting in rockier stream beds and poorer habitats for the rivers aquatic life. Dams also fragment rivers making it difficult for aquatic fauna to migrate for spawning i.e., to produce eggs.
(iii) Displacement of local communities : The building of large dams results in displacement of local communities. The local people often have to give up their land and livelihood and their meagre access and control over resources for the greater food of the nation.
(iv) Change in the cropping pattern : The multipurpose projects are responsible for providing assured means of irrigation to farmers. Due to this, most of the farmers have changed the cropping pattern shifting to water intensive and commercial crops. This has led to salinisation of soil leading to ecological imbalance.
HOTS Questions and Answers
1. Write the features of the ‘tankas’ built in the houses of Bikaner, Phalodi and Banner. [CBSE 2013]
Answer: (i) The tanks could be as large as a big room; one household in Phalodi had a tank that was 6.1 meters deep, 4.27 meters long and 2.44 meters wide. (ii) The tankas were part of the well-developed rooftop rainwater harvesting system and were built inside the main house or the courtyard. (iii) They were connected to the sloping roofs of the houses through a pipe. (itv) Rain falling on the rooftops would travel down the pipe and was stored in these underground tankas. (v) The first spell of rain was usually not collected as this would clean the roofs and the pipes. The rainwater from the subsequent showers was then collected.
2. Explain the term ‘tankas’. Where were tankas built in India [CBSE 2013]
Answer: (i) The tankas were part of the well-developed rooftop rainwater harvesting system and were built inside the main house or the courtyard. They are built for storing drinking water. A tank could be 6.1 meters deep, 4.27 meters long and 2.44 meters wide. (ii) The tankas were built in the semi-arid and arid regions of Rajasthan, particularly in Bikaner, Phalodi and Barmer.
3. What is bamboo drip irrigation Mention any two features of it. [CBSE 2012]
Answer: (1) (i) About 18-20 liters of water enters the bamboo pipe system, get transported over hundreds of meters and finally reduces to 20-80 drops per minute at the site of the plant. (ii) Bamboo drip irrigation system is practiced in Meghalaya. (2) Features of bamboo drip irrigation ; (i) Bamboo drip irrigation system is 200 year old system of tapping stream and stripwater by using bamboo pipe. (ii) Bamboo pipes are used to divert perennial springs on the hilltops to the lower reaches by gravity. (iii) The channel sections, made of bamboo, divert water to the plant site where it is distributed into branches.
4. What role do “Guls” or “Kuls” of the Western Himalayas and “Khadin” and “Johads” in parts of Rajasthan play Describe. [CBSE 2012]
Answer: (i) In Western Himalayas people build diversion channels like ‘guls’ or ‘kuls’. (ii) In arid and semi-arid regions, agricultural fields were converted into rain-fed storage structures. (iii) These allowed the water to stand and moisten the soil like the ‘Khadins’ in Jaisalmer and ‘Johads’ in other parts of Rajasthan.
5. “Need of the hour is to conserve and manage our water resources.” Mention any four reasons. Suggest any two ways to conserve water. [CBSE Sept. 2012]
Answer: (i) To safeguard ourselves from health hazards. (ii) To ensure food security. (iii) To prevent degradation of our natural ecosystem. (iv) To save the future generations from water crisis. Suggestions : – (i) Turn off the tap while brushing. (ii) We should spread awareness regarding water conservation. (iii) Rainwater harvesting.
6. How is industrialisation responsible for water scarcity? Explain. Suggest any two ways to check water pollution.
Answer: (i) The ever increasing number of industries has made matter worse by exerting pressure on the existing freshwater resources. (ii) Industries need power which is produced from water. The power is produced by the multipurpose projects. (iii) Chemicals and gases released by industries also pollutes the water. Suggestions : (i) Minimising use of soaps and detergents. (ii) Minimising use of fertilizers.
7. What is water scarcity? Mention any four factors responsible for water scarcity. [CBSE 2014] Or What is meant by water scarcity and give any two causes of water scarcity
Answer: Shortage of water as compared to its demand is known as water scarcity. Factors responsible : (i) Overexploitation of water sources. (ii) Improper management. (iii) Unequal access of water among different social groups. (iv) Industrialisation and urbanisation.
8. “Overpopulation or large and growing population can lead to water scarcity.” Explain. Mention any two lessons which you have learnt from this.
Answer: Overpopulation or large and growing population can lead to water scarcity as : (i) More population means more demand for water. (ii) A large population means more water not only for domestic use but also to produce more food. (iii) To facilitate higher foodgrain production, water resources are being over exploited to expand the irrigated areas and the dry season agriculture. (iv) Overutilisation of water results in lowering of the groundwater levels. Lessons : (i) There is need to check the growth of population. (ii) Human beings need to care for nature.
9. ‘Large multipurpose projects also lead to land degradation.’ Explain.
Answer: Multipurpose projects lead to land degradation because : (i) Irrigation has changed the cropping pattern of many regions with farmers shifting to water intensive crops. This has led to the salinisation of the soil. (ii) Regulating and damming of rivers affect the natural flow of rivers causing poor sediment flow. (iii) The flood plains are deprived of silt. (iv) Multipurpose projects induce pollution which leads to land degradation.
10. Explain various problems associated with poor people due to construction of large dams. [CBSE 2013]
Answer: (i) Construction of large dams leads to the large-scale displacement of the local communities. (ii) Local people have to give up their land and livelihood. (ii) Pbor people lose meagre access and control over resources for the greater good of the nation. (iv) The displaced people do not get full rehabilitation facilities from the government, (v) The landless people have to work as labourers in factories or construction sites. Their lives become miserable.
11. Name any two movements that have been started to oppose multipurpose projects. Who are benefitted from such projects [CBSE 2013]
Answer: (1) Two movements that have been started to oppose multipurpose projects are:
(i) Narmada Bachao Andolan was started against the Sardar Sarovar Dam being built across the Narmada river in Gujarat. (ii) Tehri Dam Andolan – Resistance to these projects has primarily been due to the large-scale displacement of local communities. (2) The landowners and large farmers, industrialists and a few urban centers are benefitted from such projects.
12. Why is rooftop rainwater harvesting important in Rajasthan Explain. [CBSE 2013, 14]
Answer: (i) The rainwater stored in tankas is an extremely reliable source of drinking water when all other sources are dried up. (ii) Rainwater is considered the purest form of natural water. (iii) Many houses constructed underground rooms adjoining the tanka to beat the summer heat as it would keep the room cool. (iv) There is lack of perennial rivers in Rajasthan. (v) The rainfall is not reliable in this region.

Gurukul of Excellence
Classes for Physics, Chemistry and Mathematics by IITians
Join our Telegram Channel for Free PDF Download
Case Study Questions for Class 7 Social Science Geography Chapter 5 Water
- Last modified on: 6 months ago
- Reading Time: 16 Minutes

Table of Contents
Here in this article, we are providing Case Study Questions for Class 7 Social Science. In case study or passage-based questions, a paragraph will be given, and then the MCQ Questions based on it will be asked. For Social Science Subjects, there would be 5 case-based sub-parts questions, wherein a student has to attempt 4 sub-part questions.
Water Class 7 Case Study
Case Study Question 1:
The Earth is covered by three-fourth of water, 97.3% water is saline or salty in oceans and seas and 2% is fresh water that consists of ice-caps, ground water, fresh water lakes, inland and salt lakes. Many countries are facing water scarcity and adding to this fact whatever water is available, is also not fit for drinking because it is polluted fully. The Sun’s heat causes evaporation of water into vapour. When the water vapour cools down, it condenses and forms clouds. From there, it may fall on the land or sea in the form of rain, snow or sleet. The process by which water continually changes its form and circulates between oceans, atmosphere and land is known as the water cycle. Our Earth is like a terrarium. The same water that existed centuries ago still exists today. The water used to irrigate a field in Haryana may have flowed down the Amazon River a hundred years ago. The major sources of fresh water are the rivers, ponds, springs and glaciers. The ocean bodies and the seas contain salty water. The water of the oceans is salty or saline as it contains large amount of dissolved salts. Most of the salt is sodium chloride or the common table salt that you eat.
Q. 1. The Earth is covered by ______of water. (a) 92 (b) 97.3 (c) 21 (d) 29
Ans. Option (b) is correct. Explanation: The Earth is covered by three-fourth of water, 97.3% water is saline.
Q. 2. The meaning of ‘Saline’ is: (a) containing salt (b) sodium (c) icecaps (d) None of these
Ans. Option (a) is correct. Explanation: Salinity is the amount of salt in grams present in 1000 grams of water. The average salinity of the oceans is 35 parts per thousand.
Q.3. The process by which water continually changes its form and circulates between oceans, atmosphere and land is known as: (a) clouds (b) water vapour (c) water cycle (d) All of them
Ans. Option (c) is correct. Explanation: Water continually changes its form (liquid, solid, ice) and circulates between oceans, atmosphere and land and this is known as the water cycle.
Q. 4. Which one is a fresh water source? (a) Rivers (b) Ponds (c) Glaciers (d) All of them
Ans. Option (d) is correct. Explanation: 2% is fresh water on the earth. The major sources of fresh water are the rivers, ponds, springs and glaciers.
Q. 5…… is an artificial enclosure for keeping small house plants. (a) Planet (b) Terrarium (c) Evaporation (d) None of them
Ans. Option (a) is correct. Explanation: Our Earth is like a terrarium which is an artificial enclosure for keeping small house plants.
Water – Introduction
Water is very important for life. It continuously changes its form as in thermal water cycle. The process by which water changes its form and circulates between oceans, atmosphere and land is known as the water cycle. The major sources of fresh water are the rivers, ponds, springs and glaciers. The ocean bodies and the seas contain salty water. The water of the ocean is salty or saline as it contains large amount of dissolved salts. Most of the salt is sodium chloride or the common table salt that we eat.
Learning Outcomes
- 3/4th of the Earth’s surface is covered by water, So the earth is called the blue planet.
- The process by which water changes its form and circulates between oceans, atmosphere and land is known as the water cycle.
- On Earth, 97% water is saline and 3% water is fresh water.
- Sources of fresh water are rain, glaciers, springs, etc.
- Sources of saline water are oceans and seas.
- Movements that occur in oceans can be categorised as waves, tides and currents.
- There are two types of ocean currents namely, warm and cold.
Related Posts
Social science class 7 chapter list, latest chapter list (2023-24).
Class 7 Social Science History
Chapter 1: Tracing Changes through a Thousand Years Case Study Questions Chapter 2: New Kings and Kingdoms Case Study Questions Chapter 3: The Delhi Sultans Case Study Questions Chapter 4: The Mughal Empire Case Study Questions Chapter 5: Rulers and Buildings Case Study Questions Chapter 6: Towns, Traders, and Craftsperson Case Study Questions Chapter 7: Tribes, Nomads, and Settled Communities Case Study Questions Chapter 8: Devotional Paths to the Divine Case Study Questions Chapter 9: The Making of Regional Cultures Case Study Questions Chapter 10: Eighteenth-Century Political Formations Case Study Questions
Class 7 Social Science Political Science
Chapter 1: On Equality Case Study Questions Chapter 2: Role of the Government in Health Case Study Questions Chapter 3: How the State Government Works Case Study Questions Chapter 4: Growing up as Boys and Girls Case Study Questions Chapter 5: Women Change the World Case Study Questions Chapter 6: Understanding Media Case Study Questions Chapter 7: Markets Around Us Case Study Questions Chapter 8: A Shirt in the Market Case Study Questions Chapter 9: Struggles for Equality Case Study Questions
CBSE Class 7 Social Science Geography
Chapter 1: Environment Case Study Questions Chapter 2: Inside Our Earth Case Study Questions Chapter 3: Our Changing Earth Case Study Questions Chapter 4: Air Case Study Questions Chapter 5: Water Case Study Questions Chapter 6: Natural Vegetation and Wildlife Case Study Questions Chapter 7: Human-Environment – Settlement, Transport, and Communication Case Study Questions Chapter 8: Human-Environment Interactions – The Tropical and the Subtropical Region Case Study Questions Chapter 9: Life in the Deserts Case Study Questions
Old Chapter List
Class 7 Social Science Geography: Our Environment
Chapter 1 Environment Chapter 2 Inside Our Earth Chapter 3 Our Changing Earth Chapter 4 Air Chapter 5 Water Chapter 6 Natural Vegetation and Wildlife Chapter 7 Human Environment – Settlement, Transport, and Communication Chapter 8 Human Environment Interactions – The Tropical and the Subtropical Region Chapter 9 Life in the Temperate Grasslands Chapter 10 Life in the Deserts
Class 7 Social Science History Class 7 Social Science History: Our Pasts – II
Chapter 1 Tracing Changes Through a Thousand Years Chapter 2 New Kings and Kingdoms Chapter 3 The Delhi Sultans Chapter 4 The Mughal Empire Chapter 5 Rulers and Buildings Chapter 6 Towns, Traders, and Craftsperson Chapter 7 Tribes, Nomads and Settled Communities Chapter 8 Devotional Paths to the Divine Chapter 9 The Making of Regional Cultures Chapter 10 Eighteenth-Century Political Formations
Class 7 Social Science Civics Class 7 Social Science Civics: Social and Political Life – II
Chapter 1 On Equality Chapter 2 Role of the Government in Health Chapter 3 How the State Government Works Chapter 4 Growing Up as Boys and Girls Chapter 5 Women Change the World Chapter 6 Understanding Media Chapter 7 Understanding Advertising Chapter 8 Markets Around Us Chapter 9 A Shirt in the Market
What is Case Study Question in Class 7 Social Science?
Case study questions typically present a specific scenario or case related to a historical event, geographical issue, or social problem. Students are expected to read and understand the details of the case and then answer a set of questions based on their understanding and knowledge of the subject matter.
Case study questions can be an effective way to assess students’ understanding and ability to apply social science concepts to practical situations. They also encourage students to think critically, analyze information, and draw informed conclusions – skills that are valuable both inside and outside the classroom.
Download CBSE Books
Exam Special Series:
- Sample Question Paper for CBSE Class 10 Science (for 2024)
- Sample Question Paper for CBSE Class 10 Maths (for 2024)
- CBSE Most Repeated Questions for Class 10 Science Board Exams
- CBSE Important Diagram Based Questions Class 10 Physics Board Exams
- CBSE Important Numericals Class 10 Physics Board Exams
- CBSE Practical Based Questions for Class 10 Science Board Exams
- CBSE Important “Differentiate Between” Based Questions Class 10 Social Science
- Sample Question Papers for CBSE Class 12 Physics (for 2024)
- Sample Question Papers for CBSE Class 12 Chemistry (for 2024)
- Sample Question Papers for CBSE Class 12 Maths (for 2024)
- Sample Question Papers for CBSE Class 12 Biology (for 2024)
- CBSE Important Diagrams & Graphs Asked in Board Exams Class 12 Physics
- Master Organic Conversions CBSE Class 12 Chemistry Board Exams
- CBSE Important Numericals Class 12 Physics Board Exams
- CBSE Important Definitions Class 12 Physics Board Exams
- CBSE Important Laws & Principles Class 12 Physics Board Exams
- 10 Years CBSE Class 12 Chemistry Previous Year-Wise Solved Papers (2023-2024)
- 10 Years CBSE Class 12 Physics Previous Year-Wise Solved Papers (2023-2024)
- 10 Years CBSE Class 12 Maths Previous Year-Wise Solved Papers (2023-2024)
- 10 Years CBSE Class 12 Biology Previous Year-Wise Solved Papers (2023-2024)
- ICSE Important Numericals Class 10 Physics BOARD Exams (215 Numericals)
- ICSE Important Figure Based Questions Class 10 Physics BOARD Exams (230 Questions)
- ICSE Mole Concept and Stoichiometry Numericals Class 10 Chemistry (65 Numericals)
- ICSE Reasoning Based Questions Class 10 Chemistry BOARD Exams (150 Qs)
- ICSE Important Functions and Locations Based Questions Class 10 Biology
- ICSE Reasoning Based Questions Class 10 Biology BOARD Exams (100 Qs)
✨ Join our Online JEE Test Series for 499/- Only (Web + App) for 1 Year
✨ Join our Online NEET Test Series for 499/- Only for 1 Year
Leave a Reply Cancel reply
Join our Online Test Series for CBSE, ICSE, JEE, NEET and Other Exams

Editable Study Materials for Your Institute - CBSE, ICSE, State Boards (Maharashtra & Karnataka), JEE, NEET, FOUNDATION, OLYMPIADS, PPTs
Discover more from Gurukul of Excellence
Subscribe now to keep reading and get access to the full archive.
Type your email…
Continue reading
- Book Solutions
- State Boards
Case Study Questions Class 7 Science Wastewater Story
Case study questions class 7 science chapter 18 wastewater story.
CBSE Class 7 Case Study Questions Science Wastewater Story. Important Case Study Questions for Class 7 Board Exam Students. Here we have arranged some Important Case Base Questions for students who are searching for Paragraph Based Questions Wastewater Story.
At Case Study Questions there will given a Paragraph. In where some Important Questions will made on that respective Case Based Study. There will various types of marks will given 1 marks, 2 marks, 3 marks, 4 marks.
CBSE Case Study Questions Class 7 Science Wastewater Story
Case study 1.
All of us use water in our homes and make it dirty. Rich in lather, mixed with oil, black–brown water that goes down the drains from sinks, showers, toilets, laundries is dirty. It is called wastewater. This used water should not be wasted. We must clean it up by removing pollutants. Clean water that is fit for use is unfortunately not available to all. It has been reported that more than one billion of people have no access to safe drinking water. This accounts for a large number of water-related diseases and even deaths. People even children walk for several kilometers to collect clean water.
The increasing scarcity of freshwater is due to population growth, pollution, industrial development, mismanagement and other factors. Realizing the urgency of the situation on the World Water Day, on 22 March 2005, the General Assembly of the United Nations proclaimed the period 2005–2015 as the International Decade for action on “Water for life”. All efforts made during this decade aim to reduce by half the number of people who donot have access to safe drinking water.
Que. 1) Which of the following is waste water?
(a) Dirty water
(b) Fresh water
(c) Good water
(d) Bad water
Que. 2) The increased scarcity of water is due to which of the following reasons?
(a) Population growth
(b) Less population
(c) More peoples
(d) Overexploitation
Que. 3) …………………………………………………………………..……… billion of people have no excess to safe drinking water.
Que. 4) Who walks several kilometers to collect clean water?
Que. 5) What causes water related disease and even death?
Que. 1) (a) Dirty water
Que. 2) (a) Population growth
Que. 3) (a) One
Que. 4) Answer: Peoples and children walks several kilometers to collect clean water.
Que. 5) Answer: Drinking unsafe and unhygienic water can cause water related disease and even death.
Case study 2
Sewage is wastewater released by homes, industries, hospitals, offices and other users. It also includes rainwater that has run down the street during a storm or heavy rain. The water that washes off roads and rooftops carries harmful substances with it. Sewage is a liquid waste. Most of it is water, which has dissolved and suspended impurities. In a home or a public building generally one set of pipes brings clean water and another set of pipes takes away wastewater. Imagine that we could see through the ground. We would see a network of big and small pipes, called sewers, forming the sewerage. It is like a transport system that carries sewage from the point of being produced to the point of disposal, i.e. treatment plant.
Manholes are located at every 50 m to 60 m in the sewerage, at the junction of two or more sewers and at points where there is a change in direction.
Que. 1) Manholes are located at how much distance in the sewerage?
(a) 50 to 60m
(b) 60 to 50m
Que. 2) Sewage is waste water released by which of the following?
(b) Industries
(c) Offices
Que. 3) Where does the sewers transports the sewage after collecting all the wastewater from various sources?
(a) Treatment plant
(c) Reservoir
Que. 4) Define sewers.
Que. 5) Rain water that runs down in the streets during heavy rainfall is also waste water is it true or false.
Que. 1) (a) 50 to 60m
Que. 2) (d) All
Que. 3) (a) Treatment plant
Que. 4) Answer: The network of small pipes and big pipes which transports the sewage to treatment plant is called as sewers.
Que. 5) Answer: The statement that rain water runs down in the street is also a waste water is true.
Case study 3
Treatment of wastewater involves physical, chemical, and biological processes, which remove physical, chemical and biological matter that contaminates the wastewater.
1.) Wastewater is passed through barscreens. Large objects like rags,sticks, cans, plastic packets, napkinsare removed
2.) Water then goes to a grit and sandremoval tank. The speed of theincoming wastewater is decreased toallow sand, grit and pebbles to settle down.
3.) The water is then allowed to settle ina large tank which is sloped towards
the middle. Solids like faeces settleat the bottom and are removed with a scraper. This is the sludge. Askimmer removes the floatable solidslike oil and grease. Water so clearedis called clarified water The sludge is transferred to aseparate tank where it is decomposedby the anaerobic bacteria. The biogas
Produced in the process can be used as fuel or can be used to produce electricity.
4.) Air is pumped into the clarified waterto help aerobic bacteria to grow.Bacteria consume human waste, foodwaste, soaps and other unwantedmatter still remaining in clarifiedwater.
After several hours, the suspendedmicrobes settle at the bottom of the tank
As activated sludge. The water is thenremoved from the top.The activated sludge is about 97%water. The water is removed by sanddrying beds or machines. Dried sludgeis used as manure, returning organicmatter and nutrients to the soil.The treated water has a very low levelof organic material and suspendedmatter. It is discharged into a sea, a riveror into the ground. Nature cleans it upfurther. Sometimes it may be necessaryto disinfect water with chemicals likechlorine and ozone before releasing itinto the distribution system.
Que. 1) Treatment of waste water involves which of the following process?
(a) Physical
(b) Chemical
(c) Biological
Que. 2) Water is disinfected by ……….…………………………..……………………………………………….….. chemical.
(a) Chlorine
(d) No chemical
Que. 3) What is the percentage of activated sludge in the waste water treatment?
Que. 4) Why air is pumped into the clarified water?
Que. 5) What does the treated water have?
Que. 1) (d) All
Que. 2) (a) Chlorine
Que. 3) (b) 97%
Que. 4) Answer: Air is pumped into the clarified water because it helps in the growth of bacteria.
Que. 5) Answer: The treated water have very low level of suspended matter and organic matters.
Case study 4
Waste generation is a natural part ofhuman activity. But we can limit the type of waste and quantity of wasteproduced. Often we have been repelledby offensive smell. The sight of opendrains is disgusting. The situationworsens in the rainy season when thedrains start overflowing. We have towade through the mud pools on the roads. Most unhygienic and unsanitaryconditions prevail. Flies, mosquitoes andother insects breed in it.
You can be an enlightened citizenand approach the municipality or thegram panchayat. Insist that the opendrains be covered. If the sewage ofany particular house makes theneighborhood dirty, you should request them to be more considerateabout others’ health. It has been suggested that we shouldplant eucalyptus trees all alongsewage ponds. These trees absorb allsurplus wastewater rapidly andrelease pure water vapour into theatmosphere.
Que. 1) Waste generation is a ……………………………………………………………………………………….. part of day to human activity.
(a) Natural
(b) Artificial
(c) Anthropogenic
(d) Man made
Que. 2) The site of open drains is which of the following?
(a) Ravishing
(c) Disgusting
(d) Excellent
Que. 3) Which tree should be planted along the sewage ponds?
(b) Eucalyptus
Que. 4) What happens to the drains during rainy season?
Que. 5) An open stagnant water source is a breeding ground for whom?
Que. 1) (a) Natural
Que. 2) (c) Disgusting
Que. 3) (b) Eucalyptus
Que. 4) Answer: The drains get overflowed during the rainy seasons
Que. 5) Answer: An open stagnant water source is a breeding ground for mosquitoes, flies and insects.
Case study 5
One of the ways to minimised or eliminatewaste and pollutants at their source isto see what you are releasing down thedrain.Cooking oil and fats should not bethrown down the drain. They canharden and block the pipes. In anopen drain the fats clog the soil poresreducing its effectiveness in filteringwater. Throw oil and fats in the dustbin.
Chemicals like paints, solvents,insecticides, motor oil, medicinesmay kill microbes that help purifywater. So do not throw them downthe drain.Used tealeaves, solid food remains,soft toys, cotton, sanitary towels, etc.Should also be thrown in the dustbin. These wastes choke thedrains. They do not allow free flow of oxygen. This hampers thedegradation process.
In the year 2016, the Government of India has initiated a new mission known as“Swachh Bharat” under which a lot of drives such as proper sewage disposaland providing toilets for everyone have been started. A design of a toilet in which humans excreta is treated by earthworms has beentested in India. It has been found to be a novel, low water-use toilet for safeprocessing of human waste. The operation of the toilet is very simple and hygienic.The human excreta is completely converted to vermi cakes — a resource muchneeded for soil.
Que. 1) In which year government of India initiated “Swachh Bharat”?
Que. 2) ……………………………………………………………………………….…. resource is much needed for soil to be more fertile and good for better yield
(a) Vermi cakes
(b) Soil cakes
(c) Dung cakes
Que. 3) Chemical oil and fat should be thrown in drain is it true or false.
Que. 4) Which design of toilet has been tested in India?
Que. 5) Which waste chokes the drain?
Que. 1) (d) 2016
Que. 2) (a) Vermi cakes
Que. 3) (b) False
Que. 4) Answer: A toilet in which human excreta is treated with the help of earthworms has been tested in India.
Que. 5) Answer: Wastes like solid food waste, soft toys, cotton etc chokes the drain.
Leave a Reply Cancel reply
Your email address will not be published. Required fields are marked *
Save my name, email, and website in this browser for the next time I comment.
We have a strong team of experienced Teachers who are here to solve all your exam preparation doubts
West bengal board class 9 bengali chuti solution, dav class 6 sst solution chapter 17 the era of harsha, dav class 6 sst solution chapter 16 the gupta empire, sikkim scert class 5 evs chapter 1 our families solution.
Sign in to your account
Username or Email Address
Remember Me
IMAGES
VIDEO
COMMENTS
At Case Study Questions there will given a Paragraph. In where some Important Questions will made on that respective Case Based Study. There will various types of marks will given 1 marks, 2 marks, 3 marks, 4 marks. CBSE Case Study Questions Class 6 Science Water Case study 1. Heating is essential to convert water into its vapour.
Chapter 3 Water Resources Case Study Questions Class 10 Social Science. 1. Read the source given below and answer the following questions: Today, dams are built not just for irrigation but for electricity generation, water supply for domestic and industrial uses, flood control, recreation, inland navigation and fish breeding.
Here we are providing case study or passage-based questions for class 6 science chapter 14 Water. Case Study/Passage Based Questions. Passage-1. Apart from drinking, there are so many activities for which we use water. Most of the water is in oceans and seas. We draw drinking water from taps which is further drawn from a well or a lake etc.
Summary of Conservation Case Studies. water rates, a public education program, a high-efficiency plumbing program, landscaping programs, and large-use programs. drawdown so that the level of water demand should stay constant until 2005. Peak demand is down 14% from 1990.
Practical Considerations for the Incorporation of Biomass Fermentation into Enhanced Biological Phosphorus Removal. Case Study. 09/21/2023. 09/21/2023.
STEP 2: CONVENE STAKEHOLDERS AND DEVELOP A PLAN FORWARD. Stratus Consulting, who managed this pilot study, worked with Matji and Associates to convene stakeholders from national and regional government and the Watergy program to discuss potential future impacts (through 2050) of climate change on the Olifants Basin, a major local water resource.
Here are some steps you can take to prepare for case study questions for class 10 social science: Understand the format of case study questions: Case study questions for class 10 social science usually require you to read a scenario or a passage and answer a set of questions based on it. These questions can be based on various topics like ...
From: Vogel, R.M., Case Studies in Environmental and Water Resource Systems Using Journal Articles and Textbooks, Chapter 10 in: Watkins, Jr., D.W., editor. (2011). Case Studies in Environmental ... followed by 3-4 minutes of questions and discussion. Your oral presentation should include the following: introduction and background to problem ...
Three laws of ground water vulnerability. Six case studies of vulnerability assessment. Guidance for selecting vulnerability assessments and using the results. Reviews of the strengths and limitations of assessment methods. Information on available data bases, primarily at the federal level.
A previous study performed in an adjacent community showed higher household treatment levels; however, this may have been due to intervention studies in that community (the community in question was excluded from this study because of previous interventions) . The study also concurred that boiling was the most common method employed.
Here we have arranged some Important Case Base Questions for students who are searching for Paragraph Based Questions Water. Case Study 1. The sun's heat causes (1) of water into vapour. When the water vapour cools down, it condenses and forms clouds. From there it may fall on the land or sea in the form of rain, snow or sleet.
The following Case Studies are adapted from: Wolf, Aaron T. and Joshua T. Newton. 2008. "Case Studies of Transboundary Dispute Resolution." Appendix C in, Delli Priscoli, Jerry and Aaron T. Wolf. Managing and Transforming Water Conflicts. Cambridge: Cambridge University Press.
What is Case Study Question for Class 7 Science? Case study or passage-based questions in class 7 Science typically require students to read a given scenario or passage and answer questions based on the information provided. These questions assess students' comprehension, analytical thinking, and application of scientific concepts. Best Ways ...
Water reuse is used across the nation to provide a wide range of benefits including: Increase water supply. Lower pollution in rivers, streams, and lakes. Recharge underground aquifers. Restore freshwater habitats. Prevent flooding. Build parks and recreational spaces.
Understand: the water cycle. Which two water cycle processes return water to the atmosphere? Learn for free about math, art, computer programming, economics, physics, chemistry, biology, medicine, finance, history, and more. Khan Academy is a nonprofit with the mission of providing a free, world-class education for anyone, anywhere.
Answer: Precipitation, surface run off and groundwater. 9. How is freshwater being renewed. Answer: The freshwater is being renewed through the hydrological cycle. 10. Mention any two regions which are expected to face water shortage. Answer: (i) Regions having low rainfall. (ii) Regions which are drought prone.
Class 7 Social Science Political Science. Chapter 1: On Equality Case Study Questions. Chapter 2: Role of the Government in Health Case Study Questions. Chapter 3: How the State Government Works Case Study Questions. Chapter 4: Growing up as Boys and Girls Case Study Questions. Chapter 5: Women Change the World Case Study Questions.
The investigation reveals that the pH value of surface water was 8.5 which were more than the standard values. The calcium and magnesium content were 398 mg/L and 305.1 mg/L respectively in ground ...
At Case Study Questions there will given a Paragraph. In where some Important Questions will made on that respective Case Based Study. There will various types of marks will given 1 marks, 2 marks, 3 marks, 4 marks. CBSE Case Study Questions Class 8 Geography Land, Soil, Water, Natural Vegetation and Wildlife Resources Case Study - 1
At Case Study Questions there will given a Paragraph. In where some Important Questions will made on that respective Case Based Study. There will various types of marks will given 1 marks, 2 marks, 3 marks, 4 marks. CBSE Case Study Questions Class 8 Science Pollution of Air and Water Case study 1
At Case Study Questions there will given a Paragraph. In where some Important Questions will made on that respective Case Based Study. There will various types of marks will given 1 marks, 2 marks, 3 marks, 4 marks. CBSE Case Study Questions Class 7 Science Wastewater Story Case study 1. All of us use water in our homes and make it dirty.