- Privacy Policy
Buy Me a Coffee
Home » Research Methods – Types, Examples and Guide

Research Methods – Types, Examples and Guide
Table of Contents

Research Methods
Definition:
Research Methods refer to the techniques, procedures, and processes used by researchers to collect , analyze, and interpret data in order to answer research questions or test hypotheses. The methods used in research can vary depending on the research questions, the type of data that is being collected, and the research design.
Types of Research Methods
Types of Research Methods are as follows:
Qualitative research Method
Qualitative research methods are used to collect and analyze non-numerical data. This type of research is useful when the objective is to explore the meaning of phenomena, understand the experiences of individuals, or gain insights into complex social processes. Qualitative research methods include interviews, focus groups, ethnography, and content analysis.
Quantitative Research Method
Quantitative research methods are used to collect and analyze numerical data. This type of research is useful when the objective is to test a hypothesis, determine cause-and-effect relationships, and measure the prevalence of certain phenomena. Quantitative research methods include surveys, experiments, and secondary data analysis.
Mixed Method Research
Mixed Method Research refers to the combination of both qualitative and quantitative research methods in a single study. This approach aims to overcome the limitations of each individual method and to provide a more comprehensive understanding of the research topic. This approach allows researchers to gather both quantitative data, which is often used to test hypotheses and make generalizations about a population, and qualitative data, which provides a more in-depth understanding of the experiences and perspectives of individuals.
Key Differences Between Research Methods
The following Table shows the key differences between Quantitative, Qualitative and Mixed Research Methods
Examples of Research Methods
Examples of Research Methods are as follows:
Qualitative Research Example:
A researcher wants to study the experience of cancer patients during their treatment. They conduct in-depth interviews with patients to gather data on their emotional state, coping mechanisms, and support systems.
Quantitative Research Example:
A company wants to determine the effectiveness of a new advertisement campaign. They survey a large group of people, asking them to rate their awareness of the product and their likelihood of purchasing it.
Mixed Research Example:
A university wants to evaluate the effectiveness of a new teaching method in improving student performance. They collect both quantitative data (such as test scores) and qualitative data (such as feedback from students and teachers) to get a complete picture of the impact of the new method.
Applications of Research Methods
Research methods are used in various fields to investigate, analyze, and answer research questions. Here are some examples of how research methods are applied in different fields:
- Psychology : Research methods are widely used in psychology to study human behavior, emotions, and mental processes. For example, researchers may use experiments, surveys, and observational studies to understand how people behave in different situations, how they respond to different stimuli, and how their brains process information.
- Sociology : Sociologists use research methods to study social phenomena, such as social inequality, social change, and social relationships. Researchers may use surveys, interviews, and observational studies to collect data on social attitudes, beliefs, and behaviors.
- Medicine : Research methods are essential in medical research to study diseases, test new treatments, and evaluate their effectiveness. Researchers may use clinical trials, case studies, and laboratory experiments to collect data on the efficacy and safety of different medical treatments.
- Education : Research methods are used in education to understand how students learn, how teachers teach, and how educational policies affect student outcomes. Researchers may use surveys, experiments, and observational studies to collect data on student performance, teacher effectiveness, and educational programs.
- Business : Research methods are used in business to understand consumer behavior, market trends, and business strategies. Researchers may use surveys, focus groups, and observational studies to collect data on consumer preferences, market trends, and industry competition.
- Environmental science : Research methods are used in environmental science to study the natural world and its ecosystems. Researchers may use field studies, laboratory experiments, and observational studies to collect data on environmental factors, such as air and water quality, and the impact of human activities on the environment.
- Political science : Research methods are used in political science to study political systems, institutions, and behavior. Researchers may use surveys, experiments, and observational studies to collect data on political attitudes, voting behavior, and the impact of policies on society.
Purpose of Research Methods
Research methods serve several purposes, including:
- Identify research problems: Research methods are used to identify research problems or questions that need to be addressed through empirical investigation.
- Develop hypotheses: Research methods help researchers develop hypotheses, which are tentative explanations for the observed phenomenon or relationship.
- Collect data: Research methods enable researchers to collect data in a systematic and objective way, which is necessary to test hypotheses and draw meaningful conclusions.
- Analyze data: Research methods provide tools and techniques for analyzing data, such as statistical analysis, content analysis, and discourse analysis.
- Test hypotheses: Research methods allow researchers to test hypotheses by examining the relationships between variables in a systematic and controlled manner.
- Draw conclusions : Research methods facilitate the drawing of conclusions based on empirical evidence and help researchers make generalizations about a population based on their sample data.
- Enhance understanding: Research methods contribute to the development of knowledge and enhance our understanding of various phenomena and relationships, which can inform policy, practice, and theory.
When to Use Research Methods
Research methods are used when you need to gather information or data to answer a question or to gain insights into a particular phenomenon.
Here are some situations when research methods may be appropriate:
- To investigate a problem : Research methods can be used to investigate a problem or a research question in a particular field. This can help in identifying the root cause of the problem and developing solutions.
- To gather data: Research methods can be used to collect data on a particular subject. This can be done through surveys, interviews, observations, experiments, and more.
- To evaluate programs : Research methods can be used to evaluate the effectiveness of a program, intervention, or policy. This can help in determining whether the program is meeting its goals and objectives.
- To explore new areas : Research methods can be used to explore new areas of inquiry or to test new hypotheses. This can help in advancing knowledge in a particular field.
- To make informed decisions : Research methods can be used to gather information and data to support informed decision-making. This can be useful in various fields such as healthcare, business, and education.
Advantages of Research Methods
Research methods provide several advantages, including:
- Objectivity : Research methods enable researchers to gather data in a systematic and objective manner, minimizing personal biases and subjectivity. This leads to more reliable and valid results.
- Replicability : A key advantage of research methods is that they allow for replication of studies by other researchers. This helps to confirm the validity of the findings and ensures that the results are not specific to the particular research team.
- Generalizability : Research methods enable researchers to gather data from a representative sample of the population, allowing for generalizability of the findings to a larger population. This increases the external validity of the research.
- Precision : Research methods enable researchers to gather data using standardized procedures, ensuring that the data is accurate and precise. This allows researchers to make accurate predictions and draw meaningful conclusions.
- Efficiency : Research methods enable researchers to gather data efficiently, saving time and resources. This is especially important when studying large populations or complex phenomena.
- Innovation : Research methods enable researchers to develop new techniques and tools for data collection and analysis, leading to innovation and advancement in the field.
About the author

Muhammad Hassan
Researcher, Academic Writer, Web developer
You may also like

Questionnaire – Definition, Types, and Examples

Data Collection – Methods Types and Examples

Delimitations in Research – Types, Examples and...

Research Process – Steps, Examples and Tips

Research Design – Types, Methods and Examples

Institutional Review Board – Application Sample...
- Resources Home 🏠
- Try SciSpace Copilot
- Search research papers
- Add Copilot Extension
- Try AI Detector
- Try Paraphraser
- Try Citation Generator
- April Papers
- June Papers
- July Papers

Here's What You Need to Understand About Research Methodology

Table of Contents
Research methodology involves a systematic and well-structured approach to conducting scholarly or scientific inquiries. Knowing the significance of research methodology and its different components is crucial as it serves as the basis for any study.
Typically, your research topic will start as a broad idea you want to investigate more thoroughly. Once you’ve identified a research problem and created research questions , you must choose the appropriate methodology and frameworks to address those questions effectively.
What is the definition of a research methodology?
Research methodology is the process or the way you intend to execute your study. The methodology section of a research paper outlines how you plan to conduct your study. It covers various steps such as collecting data, statistical analysis, observing participants, and other procedures involved in the research process
The methods section should give a description of the process that will convert your idea into a study. Additionally, the outcomes of your process must provide valid and reliable results resonant with the aims and objectives of your research. This thumb rule holds complete validity, no matter whether your paper has inclinations for qualitative or quantitative usage.
Studying research methods used in related studies can provide helpful insights and direction for your own research. Now easily discover papers related to your topic on SciSpace and utilize our AI research assistant, Copilot , to quickly review the methodologies applied in different papers.

The need for a good research methodology
While deciding on your approach towards your research, the reason or factors you weighed in choosing a particular problem and formulating a research topic need to be validated and explained. A research methodology helps you do exactly that. Moreover, a good research methodology lets you build your argument to validate your research work performed through various data collection methods, analytical methods, and other essential points.
Just imagine it as a strategy documented to provide an overview of what you intend to do.
While undertaking any research writing or performing the research itself, you may get drifted in not something of much importance. In such a case, a research methodology helps you to get back to your outlined work methodology.
A research methodology helps in keeping you accountable for your work. Additionally, it can help you evaluate whether your work is in sync with your original aims and objectives or not. Besides, a good research methodology enables you to navigate your research process smoothly and swiftly while providing effective planning to achieve your desired results.
What is the basic structure of a research methodology?
Usually, you must ensure to include the following stated aspects while deciding over the basic structure of your research methodology:
1. Your research procedure
Explain what research methods you’re going to use. Whether you intend to proceed with quantitative or qualitative, or a composite of both approaches, you need to state that explicitly. The option among the three depends on your research’s aim, objectives, and scope.
2. Provide the rationality behind your chosen approach
Based on logic and reason, let your readers know why you have chosen said research methodologies. Additionally, you have to build strong arguments supporting why your chosen research method is the best way to achieve the desired outcome.
3. Explain your mechanism
The mechanism encompasses the research methods or instruments you will use to develop your research methodology. It usually refers to your data collection methods. You can use interviews, surveys, physical questionnaires, etc., of the many available mechanisms as research methodology instruments. The data collection method is determined by the type of research and whether the data is quantitative data(includes numerical data) or qualitative data (perception, morale, etc.) Moreover, you need to put logical reasoning behind choosing a particular instrument.
4. Significance of outcomes
The results will be available once you have finished experimenting. However, you should also explain how you plan to use the data to interpret the findings. This section also aids in understanding the problem from within, breaking it down into pieces, and viewing the research problem from various perspectives.
5. Reader’s advice
Anything that you feel must be explained to spread more awareness among readers and focus groups must be included and described in detail. You should not just specify your research methodology on the assumption that a reader is aware of the topic.
All the relevant information that explains and simplifies your research paper must be included in the methodology section. If you are conducting your research in a non-traditional manner, give a logical justification and list its benefits.
6. Explain your sample space
Include information about the sample and sample space in the methodology section. The term "sample" refers to a smaller set of data that a researcher selects or chooses from a larger group of people or focus groups using a predetermined selection method. Let your readers know how you are going to distinguish between relevant and non-relevant samples. How you figured out those exact numbers to back your research methodology, i.e. the sample spacing of instruments, must be discussed thoroughly.
For example, if you are going to conduct a survey or interview, then by what procedure will you select the interviewees (or sample size in case of surveys), and how exactly will the interview or survey be conducted.
7. Challenges and limitations
This part, which is frequently assumed to be unnecessary, is actually very important. The challenges and limitations that your chosen strategy inherently possesses must be specified while you are conducting different types of research.
The importance of a good research methodology
You must have observed that all research papers, dissertations, or theses carry a chapter entirely dedicated to research methodology. This section helps maintain your credibility as a better interpreter of results rather than a manipulator.
A good research methodology always explains the procedure, data collection methods and techniques, aim, and scope of the research. In a research study, it leads to a well-organized, rationality-based approach, while the paper lacking it is often observed as messy or disorganized.
You should pay special attention to validating your chosen way towards the research methodology. This becomes extremely important in case you select an unconventional or a distinct method of execution.
Curating and developing a strong, effective research methodology can assist you in addressing a variety of situations, such as:
- When someone tries to duplicate or expand upon your research after few years.
- If a contradiction or conflict of facts occurs at a later time. This gives you the security you need to deal with these contradictions while still being able to defend your approach.
- Gaining a tactical approach in getting your research completed in time. Just ensure you are using the right approach while drafting your research methodology, and it can help you achieve your desired outcomes. Additionally, it provides a better explanation and understanding of the research question itself.
- Documenting the results so that the final outcome of the research stays as you intended it to be while starting.
Instruments you could use while writing a good research methodology
As a researcher, you must choose which tools or data collection methods that fit best in terms of the relevance of your research. This decision has to be wise.
There exists many research equipments or tools that you can use to carry out your research process. These are classified as:
a. Interviews (One-on-One or a Group)
An interview aimed to get your desired research outcomes can be undertaken in many different ways. For example, you can design your interview as structured, semi-structured, or unstructured. What sets them apart is the degree of formality in the questions. On the other hand, in a group interview, your aim should be to collect more opinions and group perceptions from the focus groups on a certain topic rather than looking out for some formal answers.
In surveys, you are in better control if you specifically draft the questions you seek the response for. For example, you may choose to include free-style questions that can be answered descriptively, or you may provide a multiple-choice type response for questions. Besides, you can also opt to choose both ways, deciding what suits your research process and purpose better.
c. Sample Groups
Similar to the group interviews, here, you can select a group of individuals and assign them a topic to discuss or freely express their opinions over that. You can simultaneously note down the answers and later draft them appropriately, deciding on the relevance of every response.
d. Observations
If your research domain is humanities or sociology, observations are the best-proven method to draw your research methodology. Of course, you can always include studying the spontaneous response of the participants towards a situation or conducting the same but in a more structured manner. A structured observation means putting the participants in a situation at a previously decided time and then studying their responses.
Of all the tools described above, it is you who should wisely choose the instruments and decide what’s the best fit for your research. You must not restrict yourself from multiple methods or a combination of a few instruments if appropriate in drafting a good research methodology.
Types of research methodology
A research methodology exists in various forms. Depending upon their approach, whether centered around words, numbers, or both, methodologies are distinguished as qualitative, quantitative, or an amalgamation of both.
1. Qualitative research methodology
When a research methodology primarily focuses on words and textual data, then it is generally referred to as qualitative research methodology. This type is usually preferred among researchers when the aim and scope of the research are mainly theoretical and explanatory.
The instruments used are observations, interviews, and sample groups. You can use this methodology if you are trying to study human behavior or response in some situations. Generally, qualitative research methodology is widely used in sociology, psychology, and other related domains.
2. Quantitative research methodology
If your research is majorly centered on data, figures, and stats, then analyzing these numerical data is often referred to as quantitative research methodology. You can use quantitative research methodology if your research requires you to validate or justify the obtained results.
In quantitative methods, surveys, tests, experiments, and evaluations of current databases can be advantageously used as instruments If your research involves testing some hypothesis, then use this methodology.
3. Amalgam methodology
As the name suggests, the amalgam methodology uses both quantitative and qualitative approaches. This methodology is used when a part of the research requires you to verify the facts and figures, whereas the other part demands you to discover the theoretical and explanatory nature of the research question.
The instruments for the amalgam methodology require you to conduct interviews and surveys, including tests and experiments. The outcome of this methodology can be insightful and valuable as it provides precise test results in line with theoretical explanations and reasoning.
The amalgam method, makes your work both factual and rational at the same time.
Final words: How to decide which is the best research methodology?
If you have kept your sincerity and awareness intact with the aims and scope of research well enough, you must have got an idea of which research methodology suits your work best.
Before deciding which research methodology answers your research question, you must invest significant time in reading and doing your homework for that. Taking references that yield relevant results should be your first approach to establishing a research methodology.
Moreover, you should never refrain from exploring other options. Before setting your work in stone, you must try all the available options as it explains why the choice of research methodology that you finally make is more appropriate than the other available options.
You should always go for a quantitative research methodology if your research requires gathering large amounts of data, figures, and statistics. This research methodology will provide you with results if your research paper involves the validation of some hypothesis.
Whereas, if you are looking for more explanations, reasons, opinions, and public perceptions around a theory, you must use qualitative research methodology.The choice of an appropriate research methodology ultimately depends on what you want to achieve through your research.
Frequently Asked Questions (FAQs) about Research Methodology
1. how to write a research methodology.
You can always provide a separate section for research methodology where you should specify details about the methods and instruments used during the research, discussions on result analysis, including insights into the background information, and conveying the research limitations.
2. What are the types of research methodology?
There generally exists four types of research methodology i.e.
- Observation
- Experimental
- Derivational
3. What is the true meaning of research methodology?
The set of techniques or procedures followed to discover and analyze the information gathered to validate or justify a research outcome is generally called Research Methodology.
4. Where lies the importance of research methodology?
Your research methodology directly reflects the validity of your research outcomes and how well-informed your research work is. Moreover, it can help future researchers cite or refer to your research if they plan to use a similar research methodology.
You might also like

Consensus GPT vs. SciSpace GPT: Choose the Best GPT for Research

Literature Review and Theoretical Framework: Understanding the Differences

Using AI for research: A beginner’s guide

News alert: UC Berkeley has announced its next university librarian
Secondary menu
- Log in to your Library account
- Hours and Maps
- Connect from Off Campus
- UC Berkeley Home
Search form
Research methods--quantitative, qualitative, and more: overview.
- Quantitative Research
- Qualitative Research
- Data Science Methods (Machine Learning, AI, Big Data)
- Text Mining and Computational Text Analysis
- Evidence Synthesis/Systematic Reviews
- Get Data, Get Help!
About Research Methods
This guide provides an overview of research methods, how to choose and use them, and supports and resources at UC Berkeley.
As Patten and Newhart note in the book Understanding Research Methods , "Research methods are the building blocks of the scientific enterprise. They are the "how" for building systematic knowledge. The accumulation of knowledge through research is by its nature a collective endeavor. Each well-designed study provides evidence that may support, amend, refute, or deepen the understanding of existing knowledge...Decisions are important throughout the practice of research and are designed to help researchers collect evidence that includes the full spectrum of the phenomenon under study, to maintain logical rules, and to mitigate or account for possible sources of bias. In many ways, learning research methods is learning how to see and make these decisions."
The choice of methods varies by discipline, by the kind of phenomenon being studied and the data being used to study it, by the technology available, and more. This guide is an introduction, but if you don't see what you need here, always contact your subject librarian, and/or take a look to see if there's a library research guide that will answer your question.
Suggestions for changes and additions to this guide are welcome!
START HERE: SAGE Research Methods
Without question, the most comprehensive resource available from the library is SAGE Research Methods. HERE IS THE ONLINE GUIDE to this one-stop shopping collection, and some helpful links are below:
- SAGE Research Methods
- Little Green Books (Quantitative Methods)
- Little Blue Books (Qualitative Methods)
- Dictionaries and Encyclopedias
- Case studies of real research projects
- Sample datasets for hands-on practice
- Streaming video--see methods come to life
- Methodspace- -a community for researchers
- SAGE Research Methods Course Mapping
Library Data Services at UC Berkeley
Library Data Services Program and Digital Scholarship Services
The LDSP offers a variety of services and tools ! From this link, check out pages for each of the following topics: discovering data, managing data, collecting data, GIS data, text data mining, publishing data, digital scholarship, open science, and the Research Data Management Program.
Be sure also to check out the visual guide to where to seek assistance on campus with any research question you may have!
Library GIS Services
Other Data Services at Berkeley
D-Lab Supports Berkeley faculty, staff, and graduate students with research in data intensive social science, including a wide range of training and workshop offerings Dryad Dryad is a simple self-service tool for researchers to use in publishing their datasets. It provides tools for the effective publication of and access to research data. Geospatial Innovation Facility (GIF) Provides leadership and training across a broad array of integrated mapping technologies on campu Research Data Management A UC Berkeley guide and consulting service for research data management issues
General Research Methods Resources
Here are some general resources for assistance:
- Assistance from ICPSR (must create an account to access): Getting Help with Data , and Resources for Students
- Wiley Stats Ref for background information on statistics topics
- Survey Documentation and Analysis (SDA) . Program for easy web-based analysis of survey data.
Consultants
- D-Lab/Data Science Discovery Consultants Request help with your research project from peer consultants.
- Research data (RDM) consulting Meet with RDM consultants before designing the data security, storage, and sharing aspects of your qualitative project.
- Statistics Department Consulting Services A service in which advanced graduate students, under faculty supervision, are available to consult during specified hours in the Fall and Spring semesters.
Related Resourcex
- IRB / CPHS Qualitative research projects with human subjects often require that you go through an ethics review.
- OURS (Office of Undergraduate Research and Scholarships) OURS supports undergraduates who want to embark on research projects and assistantships. In particular, check out their "Getting Started in Research" workshops
- Sponsored Projects Sponsored projects works with researchers applying for major external grants.
- Next: Quantitative Research >>
- Last Updated: Apr 3, 2023 3:14 PM
- URL: https://guides.lib.berkeley.edu/researchmethods
When you choose to publish with PLOS, your research makes an impact. Make your work accessible to all, without restrictions, and accelerate scientific discovery with options like preprints and published peer review that make your work more Open.
- PLOS Biology
- PLOS Climate
- PLOS Complex Systems
- PLOS Computational Biology
- PLOS Digital Health
- PLOS Genetics
- PLOS Global Public Health
- PLOS Medicine
- PLOS Mental Health
- PLOS Neglected Tropical Diseases
- PLOS Pathogens
- PLOS Sustainability and Transformation
- PLOS Collections
- How to Write Your Methods

Ensure understanding, reproducibility and replicability
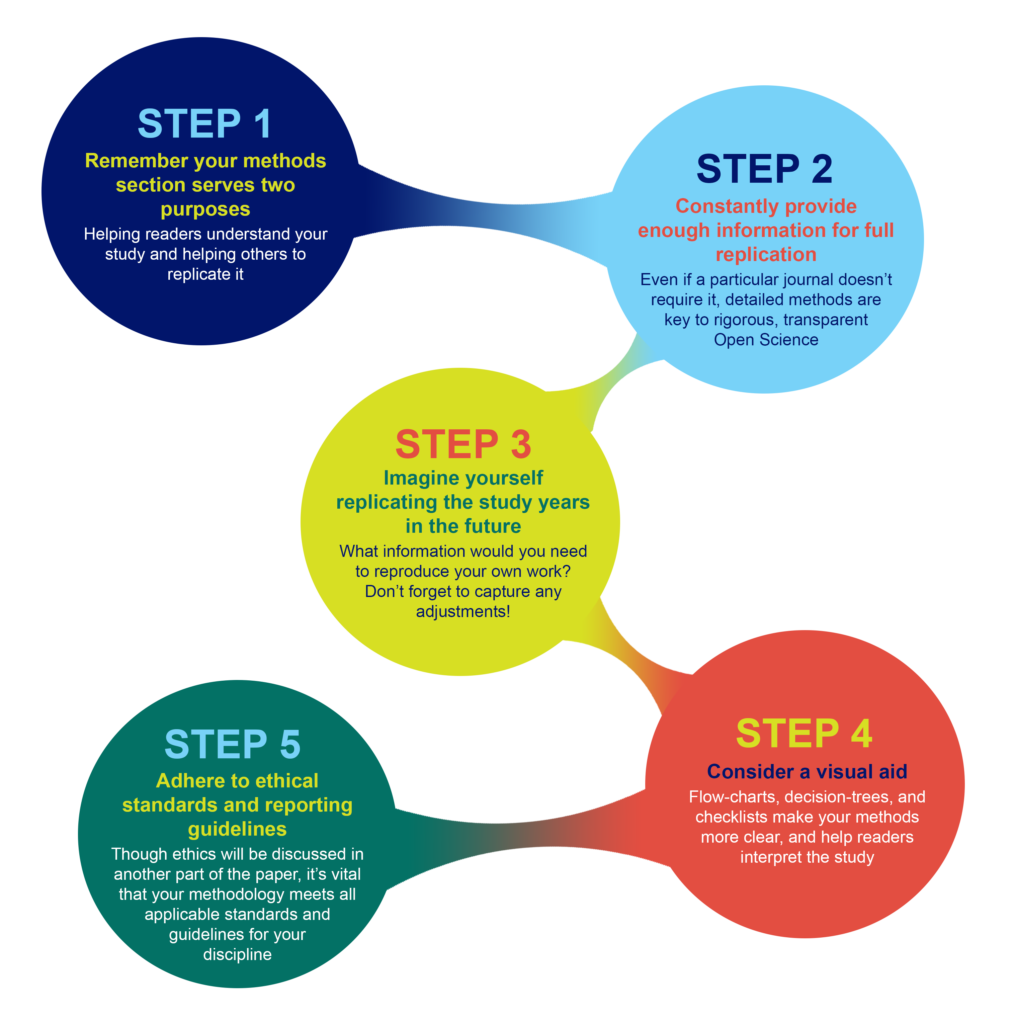
What should you include in your methods section, and how much detail is appropriate?
Why Methods Matter
The methods section was once the most likely part of a paper to be unfairly abbreviated, overly summarized, or even relegated to hard-to-find sections of a publisher’s website. While some journals may responsibly include more detailed elements of methods in supplementary sections, the movement for increased reproducibility and rigor in science has reinstated the importance of the methods section. Methods are now viewed as a key element in establishing the credibility of the research being reported, alongside the open availability of data and results.
A clear methods section impacts editorial evaluation and readers’ understanding, and is also the backbone of transparency and replicability.
For example, the Reproducibility Project: Cancer Biology project set out in 2013 to replicate experiments from 50 high profile cancer papers, but revised their target to 18 papers once they understood how much methodological detail was not contained in the original papers.
What to include in your methods section
What you include in your methods sections depends on what field you are in and what experiments you are performing. However, the general principle in place at the majority of journals is summarized well by the guidelines at PLOS ONE : “The Materials and Methods section should provide enough detail to allow suitably skilled investigators to fully replicate your study. ” The emphases here are deliberate: the methods should enable readers to understand your paper, and replicate your study. However, there is no need to go into the level of detail that a lay-person would require—the focus is on the reader who is also trained in your field, with the suitable skills and knowledge to attempt a replication.
A constant principle of rigorous science
A methods section that enables other researchers to understand and replicate your results is a constant principle of rigorous, transparent, and Open Science. Aim to be thorough, even if a particular journal doesn’t require the same level of detail . Reproducibility is all of our responsibility. You cannot create any problems by exceeding a minimum standard of information. If a journal still has word-limits—either for the overall article or specific sections—and requires some methodological details to be in a supplemental section, that is OK as long as the extra details are searchable and findable .
Imagine replicating your own work, years in the future
As part of PLOS’ presentation on Reproducibility and Open Publishing (part of UCSF’s Reproducibility Series ) we recommend planning the level of detail in your methods section by imagining you are writing for your future self, replicating your own work. When you consider that you might be at a different institution, with different account logins, applications, resources, and access levels—you can help yourself imagine the level of specificity that you yourself would require to redo the exact experiment. Consider:
- Which details would you need to be reminded of?
- Which cell line, or antibody, or software, or reagent did you use, and does it have a Research Resource ID (RRID) that you can cite?
- Which version of a questionnaire did you use in your survey?
- Exactly which visual stimulus did you show participants, and is it publicly available?
- What participants did you decide to exclude?
- What process did you adjust, during your work?
Tip: Be sure to capture any changes to your protocols
You yourself would want to know about any adjustments, if you ever replicate the work, so you can surmise that anyone else would want to as well. Even if a necessary adjustment you made was not ideal, transparency is the key to ensuring this is not regarded as an issue in the future. It is far better to transparently convey any non-optimal methods, or methodological constraints, than to conceal them, which could result in reproducibility or ethical issues downstream.
Visual aids for methods help when reading the whole paper
Consider whether a visual representation of your methods could be appropriate or aid understanding your process. A visual reference readers can easily return to, like a flow-diagram, decision-tree, or checklist, can help readers to better understand the complete article, not just the methods section.
Ethical Considerations
In addition to describing what you did, it is just as important to assure readers that you also followed all relevant ethical guidelines when conducting your research. While ethical standards and reporting guidelines are often presented in a separate section of a paper, ensure that your methods and protocols actually follow these guidelines. Read more about ethics .
Existing standards, checklists, guidelines, partners
While the level of detail contained in a methods section should be guided by the universal principles of rigorous science outlined above, various disciplines, fields, and projects have worked hard to design and develop consistent standards, guidelines, and tools to help with reporting all types of experiment. Below, you’ll find some of the key initiatives. Ensure you read the submission guidelines for the specific journal you are submitting to, in order to discover any further journal- or field-specific policies to follow, or initiatives/tools to utilize.
Tip: Keep your paper moving forward by providing the proper paperwork up front
Be sure to check the journal guidelines and provide the necessary documents with your manuscript submission. Collecting the necessary documentation can greatly slow the first round of peer review, or cause delays when you submit your revision.
Randomized Controlled Trials – CONSORT The Consolidated Standards of Reporting Trials (CONSORT) project covers various initiatives intended to prevent the problems of inadequate reporting of randomized controlled trials. The primary initiative is an evidence-based minimum set of recommendations for reporting randomized trials known as the CONSORT Statement .
Systematic Reviews and Meta-Analyses – PRISMA The Preferred Reporting Items for Systematic Reviews and Meta-Analyses ( PRISMA ) is an evidence-based minimum set of items focusing on the reporting of reviews evaluating randomized trials and other types of research.
Research using Animals – ARRIVE The Animal Research: Reporting of In Vivo Experiments ( ARRIVE ) guidelines encourage maximizing the information reported in research using animals thereby minimizing unnecessary studies. (Original study and proposal , and updated guidelines , in PLOS Biology .)
Laboratory Protocols Protocols.io has developed a platform specifically for the sharing and updating of laboratory protocols , which are assigned their own DOI and can be linked from methods sections of papers to enhance reproducibility. Contextualize your protocol and improve discovery with an accompanying Lab Protocol article in PLOS ONE .
Consistent reporting of Materials, Design, and Analysis – the MDAR checklist A cross-publisher group of editors and experts have developed, tested, and rolled out a checklist to help establish and harmonize reporting standards in the Life Sciences . The checklist , which is available for use by authors to compile their methods, and editors/reviewers to check methods, establishes a minimum set of requirements in transparent reporting and is adaptable to any discipline within the Life Sciences, by covering a breadth of potentially relevant methodological items and considerations. If you are in the Life Sciences and writing up your methods section, try working through the MDAR checklist and see whether it helps you include all relevant details into your methods, and whether it reminded you of anything you might have missed otherwise.
Summary Writing tips
The main challenge you may find when writing your methods is keeping it readable AND covering all the details needed for reproducibility and replicability. While this is difficult, do not compromise on rigorous standards for credibility!

- Keep in mind future replicability, alongside understanding and readability.
- Follow checklists, and field- and journal-specific guidelines.
- Consider a commitment to rigorous and transparent science a personal responsibility, and not just adhering to journal guidelines.
- Establish whether there are persistent identifiers for any research resources you use that can be specifically cited in your methods section.
- Deposit your laboratory protocols in Protocols.io, establishing a permanent link to them. You can update your protocols later if you improve on them, as can future scientists who follow your protocols.
- Consider visual aids like flow-diagrams, lists, to help with reading other sections of the paper.
- Be specific about all decisions made during the experiments that someone reproducing your work would need to know.

Don’t
- Summarize or abbreviate methods without giving full details in a discoverable supplemental section.
- Presume you will always be able to remember how you performed the experiments, or have access to private or institutional notebooks and resources.
- Attempt to hide constraints or non-optimal decisions you had to make–transparency is the key to ensuring the credibility of your research.
- How to Write a Great Title
- How to Write an Abstract
- How to Report Statistics
- How to Write Discussions and Conclusions
- How to Edit Your Work
The contents of the Peer Review Center are also available as a live, interactive training session, complete with slides, talking points, and activities. …
The contents of the Writing Center are also available as a live, interactive training session, complete with slides, talking points, and activities. …
There’s a lot to consider when deciding where to submit your work. Learn how to choose a journal that will help your study reach its audience, while reflecting your values as a researcher…
- Research Report: Definition, Types + [Writing Guide]

One of the reasons for carrying out research is to add to the existing body of knowledge. Therefore, when conducting research, you need to document your processes and findings in a research report.
With a research report, it is easy to outline the findings of your systematic investigation and any gaps needing further inquiry. Knowing how to create a detailed research report will prove useful when you need to conduct research.
What is a Research Report?
A research report is a well-crafted document that outlines the processes, data, and findings of a systematic investigation. It is an important document that serves as a first-hand account of the research process, and it is typically considered an objective and accurate source of information.
In many ways, a research report can be considered as a summary of the research process that clearly highlights findings, recommendations, and other important details. Reading a well-written research report should provide you with all the information you need about the core areas of the research process.
Features of a Research Report
So how do you recognize a research report when you see one? Here are some of the basic features that define a research report.
- It is a detailed presentation of research processes and findings, and it usually includes tables and graphs.
- It is written in a formal language.
- A research report is usually written in the third person.
- It is informative and based on first-hand verifiable information.
- It is formally structured with headings, sections, and bullet points.
- It always includes recommendations for future actions.
Types of Research Report
The research report is classified based on two things; nature of research and target audience.
Nature of Research
- Qualitative Research Report
This is the type of report written for qualitative research . It outlines the methods, processes, and findings of a qualitative method of systematic investigation. In educational research, a qualitative research report provides an opportunity for one to apply his or her knowledge and develop skills in planning and executing qualitative research projects.
A qualitative research report is usually descriptive in nature. Hence, in addition to presenting details of the research process, you must also create a descriptive narrative of the information.
- Quantitative Research Report
A quantitative research report is a type of research report that is written for quantitative research. Quantitative research is a type of systematic investigation that pays attention to numerical or statistical values in a bid to find answers to research questions.
In this type of research report, the researcher presents quantitative data to support the research process and findings. Unlike a qualitative research report that is mainly descriptive, a quantitative research report works with numbers; that is, it is numerical in nature.
Target Audience
Also, a research report can be said to be technical or popular based on the target audience. If you’re dealing with a general audience, you would need to present a popular research report, and if you’re dealing with a specialized audience, you would submit a technical report.
- Technical Research Report
A technical research report is a detailed document that you present after carrying out industry-based research. This report is highly specialized because it provides information for a technical audience; that is, individuals with above-average knowledge in the field of study.
In a technical research report, the researcher is expected to provide specific information about the research process, including statistical analyses and sampling methods. Also, the use of language is highly specialized and filled with jargon.
Examples of technical research reports include legal and medical research reports.
- Popular Research Report
A popular research report is one for a general audience; that is, for individuals who do not necessarily have any knowledge in the field of study. A popular research report aims to make information accessible to everyone.
It is written in very simple language, which makes it easy to understand the findings and recommendations. Examples of popular research reports are the information contained in newspapers and magazines.
Importance of a Research Report
- Knowledge Transfer: As already stated above, one of the reasons for carrying out research is to contribute to the existing body of knowledge, and this is made possible with a research report. A research report serves as a means to effectively communicate the findings of a systematic investigation to all and sundry.
- Identification of Knowledge Gaps: With a research report, you’d be able to identify knowledge gaps for further inquiry. A research report shows what has been done while hinting at other areas needing systematic investigation.
- In market research, a research report would help you understand the market needs and peculiarities at a glance.
- A research report allows you to present information in a precise and concise manner.
- It is time-efficient and practical because, in a research report, you do not have to spend time detailing the findings of your research work in person. You can easily send out the report via email and have stakeholders look at it.
Guide to Writing a Research Report
A lot of detail goes into writing a research report, and getting familiar with the different requirements would help you create the ideal research report. A research report is usually broken down into multiple sections, which allows for a concise presentation of information.
Structure and Example of a Research Report
This is the title of your systematic investigation. Your title should be concise and point to the aims, objectives, and findings of a research report.
- Table of Contents
This is like a compass that makes it easier for readers to navigate the research report.
An abstract is an overview that highlights all important aspects of the research including the research method, data collection process, and research findings. Think of an abstract as a summary of your research report that presents pertinent information in a concise manner.
An abstract is always brief; typically 100-150 words and goes straight to the point. The focus of your research abstract should be the 5Ws and 1H format – What, Where, Why, When, Who and How.
- Introduction
Here, the researcher highlights the aims and objectives of the systematic investigation as well as the problem which the systematic investigation sets out to solve. When writing the report introduction, it is also essential to indicate whether the purposes of the research were achieved or would require more work.
In the introduction section, the researcher specifies the research problem and also outlines the significance of the systematic investigation. Also, the researcher is expected to outline any jargons and terminologies that are contained in the research.
- Literature Review
A literature review is a written survey of existing knowledge in the field of study. In other words, it is the section where you provide an overview and analysis of different research works that are relevant to your systematic investigation.
It highlights existing research knowledge and areas needing further investigation, which your research has sought to fill. At this stage, you can also hint at your research hypothesis and its possible implications for the existing body of knowledge in your field of study.
- An Account of Investigation
This is a detailed account of the research process, including the methodology, sample, and research subjects. Here, you are expected to provide in-depth information on the research process including the data collection and analysis procedures.
In a quantitative research report, you’d need to provide information surveys, questionnaires and other quantitative data collection methods used in your research. In a qualitative research report, you are expected to describe the qualitative data collection methods used in your research including interviews and focus groups.
In this section, you are expected to present the results of the systematic investigation.
This section further explains the findings of the research, earlier outlined. Here, you are expected to present a justification for each outcome and show whether the results are in line with your hypotheses or if other research studies have come up with similar results.
- Conclusions
This is a summary of all the information in the report. It also outlines the significance of the entire study.
- References and Appendices
This section contains a list of all the primary and secondary research sources.
Tips for Writing a Research Report
- Define the Context for the Report
As is obtainable when writing an essay, defining the context for your research report would help you create a detailed yet concise document. This is why you need to create an outline before writing so that you do not miss out on anything.
- Define your Audience
Writing with your audience in mind is essential as it determines the tone of the report. If you’re writing for a general audience, you would want to present the information in a simple and relatable manner. For a specialized audience, you would need to make use of technical and field-specific terms.
- Include Significant Findings
The idea of a research report is to present some sort of abridged version of your systematic investigation. In your report, you should exclude irrelevant information while highlighting only important data and findings.
- Include Illustrations
Your research report should include illustrations and other visual representations of your data. Graphs, pie charts, and relevant images lend additional credibility to your systematic investigation.
- Choose the Right Title
A good research report title is brief, precise, and contains keywords from your research. It should provide a clear idea of your systematic investigation so that readers can grasp the entire focus of your research from the title.
- Proofread the Report
Before publishing the document, ensure that you give it a second look to authenticate the information. If you can, get someone else to go through the report, too, and you can also run it through proofreading and editing software.
How to Gather Research Data for Your Report
- Understand the Problem
Every research aims at solving a specific problem or set of problems, and this should be at the back of your mind when writing your research report. Understanding the problem would help you to filter the information you have and include only important data in your report.
- Know what your report seeks to achieve
This is somewhat similar to the point above because, in some way, the aim of your research report is intertwined with the objectives of your systematic investigation. Identifying the primary purpose of writing a research report would help you to identify and present the required information accordingly.
- Identify your audience
Knowing your target audience plays a crucial role in data collection for a research report. If your research report is specifically for an organization, you would want to present industry-specific information or show how the research findings are relevant to the work that the company does.
- Create Surveys/Questionnaires
A survey is a research method that is used to gather data from a specific group of people through a set of questions. It can be either quantitative or qualitative.
A survey is usually made up of structured questions, and it can be administered online or offline. However, an online survey is a more effective method of research data collection because it helps you save time and gather data with ease.
You can seamlessly create an online questionnaire for your research on Formplus . With the multiple sharing options available in the builder, you would be able to administer your survey to respondents in little or no time.
Formplus also has a report summary too l that you can use to create custom visual reports for your research.
Step-by-step guide on how to create an online questionnaire using Formplus
- Sign into Formplus
In the Formplus builder, you can easily create different online questionnaires for your research by dragging and dropping preferred fields into your form. To access the Formplus builder, you will need to create an account on Formplus.
Once you do this, sign in to your account and click on Create new form to begin.
- Edit Form Title : Click on the field provided to input your form title, for example, “Research Questionnaire.”
- Edit Form : Click on the edit icon to edit the form.
- Add Fields : Drag and drop preferred form fields into your form in the Formplus builder inputs column. There are several field input options for questionnaires in the Formplus builder.
- Edit fields
- Click on “Save”
- Form Customization: With the form customization options in the form builder, you can easily change the outlook of your form and make it more unique and personalized. Formplus allows you to change your form theme, add background images, and even change the font according to your needs.
- Multiple Sharing Options: Formplus offers various form-sharing options, which enables you to share your questionnaire with respondents easily. You can use the direct social media sharing buttons to share your form link to your organization’s social media pages. You can also send out your survey form as email invitations to your research subjects too. If you wish, you can share your form’s QR code or embed it on your organization’s website for easy access.
Conclusion
Always remember that a research report is just as important as the actual systematic investigation because it plays a vital role in communicating research findings to everyone else. This is why you must take care to create a concise document summarizing the process of conducting any research.
In this article, we’ve outlined essential tips to help you create a research report. When writing your report, you should always have the audience at the back of your mind, as this would set the tone for the document.
Connect to Formplus, Get Started Now - It's Free!
- ethnographic research survey
- research report
- research report survey
- busayo.longe
You may also like:
Assessment Tools: Types, Examples & Importance
In this article, you’ll learn about different assessment tools to help you evaluate performance in various contexts
Ethnographic Research: Types, Methods + [Question Examples]
Simple guide on ethnographic research, it types, methods, examples and advantages. Also highlights how to conduct an ethnographic...
21 Chrome Extensions for Academic Researchers in 2022
In this article, we will discuss a number of chrome extensions you can use to make your research process even seamless
How to Write a Problem Statement for your Research
Learn how to write problem statements before commencing any research effort. Learn about its structure and explore examples
Formplus - For Seamless Data Collection
Collect data the right way with a versatile data collection tool. try formplus and transform your work productivity today..
Want to create or adapt books like this? Learn more about how Pressbooks supports open publishing practices.
Chapter 11: Presenting Your Research
Writing a Research Report in American Psychological Association (APA) Style
Learning Objectives
- Identify the major sections of an APA-style research report and the basic contents of each section.
- Plan and write an effective APA-style research report.
In this section, we look at how to write an APA-style empirical research report , an article that presents the results of one or more new studies. Recall that the standard sections of an empirical research report provide a kind of outline. Here we consider each of these sections in detail, including what information it contains, how that information is formatted and organized, and tips for writing each section. At the end of this section is a sample APA-style research report that illustrates many of these principles.
Sections of a Research Report
Title page and abstract.
An APA-style research report begins with a title page . The title is centred in the upper half of the page, with each important word capitalized. The title should clearly and concisely (in about 12 words or fewer) communicate the primary variables and research questions. This sometimes requires a main title followed by a subtitle that elaborates on the main title, in which case the main title and subtitle are separated by a colon. Here are some titles from recent issues of professional journals published by the American Psychological Association.
- Sex Differences in Coping Styles and Implications for Depressed Mood
- Effects of Aging and Divided Attention on Memory for Items and Their Contexts
- Computer-Assisted Cognitive Behavioural Therapy for Child Anxiety: Results of a Randomized Clinical Trial
- Virtual Driving and Risk Taking: Do Racing Games Increase Risk-Taking Cognitions, Affect, and Behaviour?
Below the title are the authors’ names and, on the next line, their institutional affiliation—the university or other institution where the authors worked when they conducted the research. As we have already seen, the authors are listed in an order that reflects their contribution to the research. When multiple authors have made equal contributions to the research, they often list their names alphabetically or in a randomly determined order.
In some areas of psychology, the titles of many empirical research reports are informal in a way that is perhaps best described as “cute.” They usually take the form of a play on words or a well-known expression that relates to the topic under study. Here are some examples from recent issues of the Journal Psychological Science .
- “Smells Like Clean Spirit: Nonconscious Effects of Scent on Cognition and Behavior”
- “Time Crawls: The Temporal Resolution of Infants’ Visual Attention”
- “Scent of a Woman: Men’s Testosterone Responses to Olfactory Ovulation Cues”
- “Apocalypse Soon?: Dire Messages Reduce Belief in Global Warming by Contradicting Just-World Beliefs”
- “Serial vs. Parallel Processing: Sometimes They Look Like Tweedledum and Tweedledee but They Can (and Should) Be Distinguished”
- “How Do I Love Thee? Let Me Count the Words: The Social Effects of Expressive Writing”
Individual researchers differ quite a bit in their preference for such titles. Some use them regularly, while others never use them. What might be some of the pros and cons of using cute article titles?
For articles that are being submitted for publication, the title page also includes an author note that lists the authors’ full institutional affiliations, any acknowledgments the authors wish to make to agencies that funded the research or to colleagues who commented on it, and contact information for the authors. For student papers that are not being submitted for publication—including theses—author notes are generally not necessary.
The abstract is a summary of the study. It is the second page of the manuscript and is headed with the word Abstract . The first line is not indented. The abstract presents the research question, a summary of the method, the basic results, and the most important conclusions. Because the abstract is usually limited to about 200 words, it can be a challenge to write a good one.
Introduction
The introduction begins on the third page of the manuscript. The heading at the top of this page is the full title of the manuscript, with each important word capitalized as on the title page. The introduction includes three distinct subsections, although these are typically not identified by separate headings. The opening introduces the research question and explains why it is interesting, the literature review discusses relevant previous research, and the closing restates the research question and comments on the method used to answer it.
The Opening
The opening , which is usually a paragraph or two in length, introduces the research question and explains why it is interesting. To capture the reader’s attention, researcher Daryl Bem recommends starting with general observations about the topic under study, expressed in ordinary language (not technical jargon)—observations that are about people and their behaviour (not about researchers or their research; Bem, 2003 [1] ). Concrete examples are often very useful here. According to Bem, this would be a poor way to begin a research report:
Festinger’s theory of cognitive dissonance received a great deal of attention during the latter part of the 20th century (p. 191)
The following would be much better:
The individual who holds two beliefs that are inconsistent with one another may feel uncomfortable. For example, the person who knows that he or she enjoys smoking but believes it to be unhealthy may experience discomfort arising from the inconsistency or disharmony between these two thoughts or cognitions. This feeling of discomfort was called cognitive dissonance by social psychologist Leon Festinger (1957), who suggested that individuals will be motivated to remove this dissonance in whatever way they can (p. 191).
After capturing the reader’s attention, the opening should go on to introduce the research question and explain why it is interesting. Will the answer fill a gap in the literature? Will it provide a test of an important theory? Does it have practical implications? Giving readers a clear sense of what the research is about and why they should care about it will motivate them to continue reading the literature review—and will help them make sense of it.
Breaking the Rules
Researcher Larry Jacoby reported several studies showing that a word that people see or hear repeatedly can seem more familiar even when they do not recall the repetitions—and that this tendency is especially pronounced among older adults. He opened his article with the following humourous anecdote:
A friend whose mother is suffering symptoms of Alzheimer’s disease (AD) tells the story of taking her mother to visit a nursing home, preliminary to her mother’s moving there. During an orientation meeting at the nursing home, the rules and regulations were explained, one of which regarded the dining room. The dining room was described as similar to a fine restaurant except that tipping was not required. The absence of tipping was a central theme in the orientation lecture, mentioned frequently to emphasize the quality of care along with the advantages of having paid in advance. At the end of the meeting, the friend’s mother was asked whether she had any questions. She replied that she only had one question: “Should I tip?” (Jacoby, 1999, p. 3)
Although both humour and personal anecdotes are generally discouraged in APA-style writing, this example is a highly effective way to start because it both engages the reader and provides an excellent real-world example of the topic under study.
The Literature Review
Immediately after the opening comes the literature review , which describes relevant previous research on the topic and can be anywhere from several paragraphs to several pages in length. However, the literature review is not simply a list of past studies. Instead, it constitutes a kind of argument for why the research question is worth addressing. By the end of the literature review, readers should be convinced that the research question makes sense and that the present study is a logical next step in the ongoing research process.
Like any effective argument, the literature review must have some kind of structure. For example, it might begin by describing a phenomenon in a general way along with several studies that demonstrate it, then describing two or more competing theories of the phenomenon, and finally presenting a hypothesis to test one or more of the theories. Or it might describe one phenomenon, then describe another phenomenon that seems inconsistent with the first one, then propose a theory that resolves the inconsistency, and finally present a hypothesis to test that theory. In applied research, it might describe a phenomenon or theory, then describe how that phenomenon or theory applies to some important real-world situation, and finally suggest a way to test whether it does, in fact, apply to that situation.
Looking at the literature review in this way emphasizes a few things. First, it is extremely important to start with an outline of the main points that you want to make, organized in the order that you want to make them. The basic structure of your argument, then, should be apparent from the outline itself. Second, it is important to emphasize the structure of your argument in your writing. One way to do this is to begin the literature review by summarizing your argument even before you begin to make it. “In this article, I will describe two apparently contradictory phenomena, present a new theory that has the potential to resolve the apparent contradiction, and finally present a novel hypothesis to test the theory.” Another way is to open each paragraph with a sentence that summarizes the main point of the paragraph and links it to the preceding points. These opening sentences provide the “transitions” that many beginning researchers have difficulty with. Instead of beginning a paragraph by launching into a description of a previous study, such as “Williams (2004) found that…,” it is better to start by indicating something about why you are describing this particular study. Here are some simple examples:
Another example of this phenomenon comes from the work of Williams (2004).
Williams (2004) offers one explanation of this phenomenon.
An alternative perspective has been provided by Williams (2004).
We used a method based on the one used by Williams (2004).
Finally, remember that your goal is to construct an argument for why your research question is interesting and worth addressing—not necessarily why your favourite answer to it is correct. In other words, your literature review must be balanced. If you want to emphasize the generality of a phenomenon, then of course you should discuss various studies that have demonstrated it. However, if there are other studies that have failed to demonstrate it, you should discuss them too. Or if you are proposing a new theory, then of course you should discuss findings that are consistent with that theory. However, if there are other findings that are inconsistent with it, again, you should discuss them too. It is acceptable to argue that the balance of the research supports the existence of a phenomenon or is consistent with a theory (and that is usually the best that researchers in psychology can hope for), but it is not acceptable to ignore contradictory evidence. Besides, a large part of what makes a research question interesting is uncertainty about its answer.
The Closing
The closing of the introduction—typically the final paragraph or two—usually includes two important elements. The first is a clear statement of the main research question or hypothesis. This statement tends to be more formal and precise than in the opening and is often expressed in terms of operational definitions of the key variables. The second is a brief overview of the method and some comment on its appropriateness. Here, for example, is how Darley and Latané (1968) [2] concluded the introduction to their classic article on the bystander effect:
These considerations lead to the hypothesis that the more bystanders to an emergency, the less likely, or the more slowly, any one bystander will intervene to provide aid. To test this proposition it would be necessary to create a situation in which a realistic “emergency” could plausibly occur. Each subject should also be blocked from communicating with others to prevent his getting information about their behaviour during the emergency. Finally, the experimental situation should allow for the assessment of the speed and frequency of the subjects’ reaction to the emergency. The experiment reported below attempted to fulfill these conditions. (p. 378)
Thus the introduction leads smoothly into the next major section of the article—the method section.
The method section is where you describe how you conducted your study. An important principle for writing a method section is that it should be clear and detailed enough that other researchers could replicate the study by following your “recipe.” This means that it must describe all the important elements of the study—basic demographic characteristics of the participants, how they were recruited, whether they were randomly assigned, how the variables were manipulated or measured, how counterbalancing was accomplished, and so on. At the same time, it should avoid irrelevant details such as the fact that the study was conducted in Classroom 37B of the Industrial Technology Building or that the questionnaire was double-sided and completed using pencils.
The method section begins immediately after the introduction ends with the heading “Method” (not “Methods”) centred on the page. Immediately after this is the subheading “Participants,” left justified and in italics. The participants subsection indicates how many participants there were, the number of women and men, some indication of their age, other demographics that may be relevant to the study, and how they were recruited, including any incentives given for participation.

After the participants section, the structure can vary a bit. Figure 11.1 shows three common approaches. In the first, the participants section is followed by a design and procedure subsection, which describes the rest of the method. This works well for methods that are relatively simple and can be described adequately in a few paragraphs. In the second approach, the participants section is followed by separate design and procedure subsections. This works well when both the design and the procedure are relatively complicated and each requires multiple paragraphs.
What is the difference between design and procedure? The design of a study is its overall structure. What were the independent and dependent variables? Was the independent variable manipulated, and if so, was it manipulated between or within subjects? How were the variables operationally defined? The procedure is how the study was carried out. It often works well to describe the procedure in terms of what the participants did rather than what the researchers did. For example, the participants gave their informed consent, read a set of instructions, completed a block of four practice trials, completed a block of 20 test trials, completed two questionnaires, and were debriefed and excused.
In the third basic way to organize a method section, the participants subsection is followed by a materials subsection before the design and procedure subsections. This works well when there are complicated materials to describe. This might mean multiple questionnaires, written vignettes that participants read and respond to, perceptual stimuli, and so on. The heading of this subsection can be modified to reflect its content. Instead of “Materials,” it can be “Questionnaires,” “Stimuli,” and so on.
The results section is where you present the main results of the study, including the results of the statistical analyses. Although it does not include the raw data—individual participants’ responses or scores—researchers should save their raw data and make them available to other researchers who request them. Several journals now encourage the open sharing of raw data online.
Although there are no standard subsections, it is still important for the results section to be logically organized. Typically it begins with certain preliminary issues. One is whether any participants or responses were excluded from the analyses and why. The rationale for excluding data should be described clearly so that other researchers can decide whether it is appropriate. A second preliminary issue is how multiple responses were combined to produce the primary variables in the analyses. For example, if participants rated the attractiveness of 20 stimulus people, you might have to explain that you began by computing the mean attractiveness rating for each participant. Or if they recalled as many items as they could from study list of 20 words, did you count the number correctly recalled, compute the percentage correctly recalled, or perhaps compute the number correct minus the number incorrect? A third preliminary issue is the reliability of the measures. This is where you would present test-retest correlations, Cronbach’s α, or other statistics to show that the measures are consistent across time and across items. A final preliminary issue is whether the manipulation was successful. This is where you would report the results of any manipulation checks.
The results section should then tackle the primary research questions, one at a time. Again, there should be a clear organization. One approach would be to answer the most general questions and then proceed to answer more specific ones. Another would be to answer the main question first and then to answer secondary ones. Regardless, Bem (2003) [3] suggests the following basic structure for discussing each new result:
- Remind the reader of the research question.
- Give the answer to the research question in words.
- Present the relevant statistics.
- Qualify the answer if necessary.
- Summarize the result.
Notice that only Step 3 necessarily involves numbers. The rest of the steps involve presenting the research question and the answer to it in words. In fact, the basic results should be clear even to a reader who skips over the numbers.
The discussion is the last major section of the research report. Discussions usually consist of some combination of the following elements:
- Summary of the research
- Theoretical implications
- Practical implications
- Limitations
- Suggestions for future research
The discussion typically begins with a summary of the study that provides a clear answer to the research question. In a short report with a single study, this might require no more than a sentence. In a longer report with multiple studies, it might require a paragraph or even two. The summary is often followed by a discussion of the theoretical implications of the research. Do the results provide support for any existing theories? If not, how can they be explained? Although you do not have to provide a definitive explanation or detailed theory for your results, you at least need to outline one or more possible explanations. In applied research—and often in basic research—there is also some discussion of the practical implications of the research. How can the results be used, and by whom, to accomplish some real-world goal?
The theoretical and practical implications are often followed by a discussion of the study’s limitations. Perhaps there are problems with its internal or external validity. Perhaps the manipulation was not very effective or the measures not very reliable. Perhaps there is some evidence that participants did not fully understand their task or that they were suspicious of the intent of the researchers. Now is the time to discuss these issues and how they might have affected the results. But do not overdo it. All studies have limitations, and most readers will understand that a different sample or different measures might have produced different results. Unless there is good reason to think they would have, however, there is no reason to mention these routine issues. Instead, pick two or three limitations that seem like they could have influenced the results, explain how they could have influenced the results, and suggest ways to deal with them.
Most discussions end with some suggestions for future research. If the study did not satisfactorily answer the original research question, what will it take to do so? What new research questions has the study raised? This part of the discussion, however, is not just a list of new questions. It is a discussion of two or three of the most important unresolved issues. This means identifying and clarifying each question, suggesting some alternative answers, and even suggesting ways they could be studied.
Finally, some researchers are quite good at ending their articles with a sweeping or thought-provoking conclusion. Darley and Latané (1968) [4] , for example, ended their article on the bystander effect by discussing the idea that whether people help others may depend more on the situation than on their personalities. Their final sentence is, “If people understand the situational forces that can make them hesitate to intervene, they may better overcome them” (p. 383). However, this kind of ending can be difficult to pull off. It can sound overreaching or just banal and end up detracting from the overall impact of the article. It is often better simply to end when you have made your final point (although you should avoid ending on a limitation).
The references section begins on a new page with the heading “References” centred at the top of the page. All references cited in the text are then listed in the format presented earlier. They are listed alphabetically by the last name of the first author. If two sources have the same first author, they are listed alphabetically by the last name of the second author. If all the authors are the same, then they are listed chronologically by the year of publication. Everything in the reference list is double-spaced both within and between references.
Appendices, Tables, and Figures
Appendices, tables, and figures come after the references. An appendix is appropriate for supplemental material that would interrupt the flow of the research report if it were presented within any of the major sections. An appendix could be used to present lists of stimulus words, questionnaire items, detailed descriptions of special equipment or unusual statistical analyses, or references to the studies that are included in a meta-analysis. Each appendix begins on a new page. If there is only one, the heading is “Appendix,” centred at the top of the page. If there is more than one, the headings are “Appendix A,” “Appendix B,” and so on, and they appear in the order they were first mentioned in the text of the report.
After any appendices come tables and then figures. Tables and figures are both used to present results. Figures can also be used to illustrate theories (e.g., in the form of a flowchart), display stimuli, outline procedures, and present many other kinds of information. Each table and figure appears on its own page. Tables are numbered in the order that they are first mentioned in the text (“Table 1,” “Table 2,” and so on). Figures are numbered the same way (“Figure 1,” “Figure 2,” and so on). A brief explanatory title, with the important words capitalized, appears above each table. Each figure is given a brief explanatory caption, where (aside from proper nouns or names) only the first word of each sentence is capitalized. More details on preparing APA-style tables and figures are presented later in the book.
Sample APA-Style Research Report
Figures 11.2, 11.3, 11.4, and 11.5 show some sample pages from an APA-style empirical research report originally written by undergraduate student Tomoe Suyama at California State University, Fresno. The main purpose of these figures is to illustrate the basic organization and formatting of an APA-style empirical research report, although many high-level and low-level style conventions can be seen here too.

Key Takeaways
- An APA-style empirical research report consists of several standard sections. The main ones are the abstract, introduction, method, results, discussion, and references.
- The introduction consists of an opening that presents the research question, a literature review that describes previous research on the topic, and a closing that restates the research question and comments on the method. The literature review constitutes an argument for why the current study is worth doing.
- The method section describes the method in enough detail that another researcher could replicate the study. At a minimum, it consists of a participants subsection and a design and procedure subsection.
- The results section describes the results in an organized fashion. Each primary result is presented in terms of statistical results but also explained in words.
- The discussion typically summarizes the study, discusses theoretical and practical implications and limitations of the study, and offers suggestions for further research.
- Practice: Look through an issue of a general interest professional journal (e.g., Psychological Science ). Read the opening of the first five articles and rate the effectiveness of each one from 1 ( very ineffective ) to 5 ( very effective ). Write a sentence or two explaining each rating.
- Practice: Find a recent article in a professional journal and identify where the opening, literature review, and closing of the introduction begin and end.
- Practice: Find a recent article in a professional journal and highlight in a different colour each of the following elements in the discussion: summary, theoretical implications, practical implications, limitations, and suggestions for future research.
Long Descriptions
Figure 11.1 long description: Table showing three ways of organizing an APA-style method section.
In the simple method, there are two subheadings: “Participants” (which might begin “The participants were…”) and “Design and procedure” (which might begin “There were three conditions…”).
In the typical method, there are three subheadings: “Participants” (“The participants were…”), “Design” (“There were three conditions…”), and “Procedure” (“Participants viewed each stimulus on the computer screen…”).
In the complex method, there are four subheadings: “Participants” (“The participants were…”), “Materials” (“The stimuli were…”), “Design” (“There were three conditions…”), and “Procedure” (“Participants viewed each stimulus on the computer screen…”). [Return to Figure 11.1]
- Bem, D. J. (2003). Writing the empirical journal article. In J. M. Darley, M. P. Zanna, & H. R. Roediger III (Eds.), The compleat academic: A practical guide for the beginning social scientist (2nd ed.). Washington, DC: American Psychological Association. ↵
- Darley, J. M., & Latané, B. (1968). Bystander intervention in emergencies: Diffusion of responsibility. Journal of Personality and Social Psychology, 4 , 377–383. ↵
A type of research article which describes one or more new empirical studies conducted by the authors.
The page at the beginning of an APA-style research report containing the title of the article, the authors’ names, and their institutional affiliation.
A summary of a research study.
The third page of a manuscript containing the research question, the literature review, and comments about how to answer the research question.
An introduction to the research question and explanation for why this question is interesting.
A description of relevant previous research on the topic being discusses and an argument for why the research is worth addressing.
The end of the introduction, where the research question is reiterated and the method is commented upon.
The section of a research report where the method used to conduct the study is described.
The main results of the study, including the results from statistical analyses, are presented in a research article.
Section of a research report that summarizes the study's results and interprets them by referring back to the study's theoretical background.
Part of a research report which contains supplemental material.
Research Methods in Psychology - 2nd Canadian Edition Copyright © 2015 by Paul C. Price, Rajiv Jhangiani, & I-Chant A. Chiang is licensed under a Creative Commons Attribution-NonCommercial-ShareAlike 4.0 International License , except where otherwise noted.
Share This Book
Research report guide: Definition, types, and tips
Last updated
5 March 2024
Reviewed by
From successful product launches or software releases to planning major business decisions, research reports serve many vital functions. They can summarize evidence and deliver insights and recommendations to save companies time and resources. They can reveal the most value-adding actions a company should take.
However, poorly constructed reports can have the opposite effect! Taking the time to learn established research-reporting rules and approaches will equip you with in-demand skills. You’ll be able to capture and communicate information applicable to numerous situations and industries, adding another string to your resume bow.
- What are research reports?
A research report is a collection of contextual data, gathered through organized research, that provides new insights into a particular challenge (which, for this article, is business-related). Research reports are a time-tested method for distilling large amounts of data into a narrow band of focus.
Their effectiveness often hinges on whether the report provides:
Strong, well-researched evidence
Comprehensive analysis
Well-considered conclusions and recommendations
Though the topic possibilities are endless, an effective research report keeps a laser-like focus on the specific questions or objectives the researcher believes are key to achieving success. Many research reports begin as research proposals, which usually include the need for a report to capture the findings of the study and recommend a course of action.
A description of the research method used, e.g., qualitative, quantitative, or other
Statistical analysis
Causal (or explanatory) research (i.e., research identifying relationships between two variables)
Inductive research, also known as ‘theory-building’
Deductive research, such as that used to test theories
Action research, where the research is actively used to drive change
- Importance of a research report
Research reports can unify and direct a company's focus toward the most appropriate strategic action. Of course, spending resources on a report takes up some of the company's human and financial resources. Choosing when a report is called for is a matter of judgment and experience.
Some development models used heavily in the engineering world, such as Waterfall development, are notorious for over-relying on research reports. With Waterfall development, there is a linear progression through each step of a project, and each stage is precisely documented and reported on before moving to the next.
The pace of the business world is faster than the speed at which your authors can produce and disseminate reports. So how do companies strike the right balance between creating and acting on research reports?
The answer lies, again, in the report's defined objectives. By paring down your most pressing interests and those of your stakeholders, your research and reporting skills will be the lenses that keep your company's priorities in constant focus.
Honing your company's primary objectives can save significant amounts of time and align research and reporting efforts with ever-greater precision.
Some examples of well-designed research objectives are:
Proving whether or not a product or service meets customer expectations
Demonstrating the value of a service, product, or business process to your stakeholders and investors
Improving business decision-making when faced with a lack of time or other constraints
Clarifying the relationship between a critical cause and effect for problematic business processes
Prioritizing the development of a backlog of products or product features
Comparing business or production strategies
Evaluating past decisions and predicting future outcomes
- Features of a research report
Research reports generally require a research design phase, where the report author(s) determine the most important elements the report must contain.
Just as there are various kinds of research, there are many types of reports.
Here are the standard elements of almost any research-reporting format:
Report summary. A broad but comprehensive overview of what readers will learn in the full report. Summaries are usually no more than one or two paragraphs and address all key elements of the report. Think of the key takeaways your primary stakeholders will want to know if they don’t have time to read the full document.
Introduction. Include a brief background of the topic, the type of research, and the research sample. Consider the primary goal of the report, who is most affected, and how far along the company is in meeting its objectives.
Methods. A description of how the researcher carried out data collection, analysis, and final interpretations of the data. Include the reasons for choosing a particular method. The methods section should strike a balance between clearly presenting the approach taken to gather data and discussing how it is designed to achieve the report's objectives.
Data analysis. This section contains interpretations that lead readers through the results relevant to the report's thesis. If there were unexpected results, include here a discussion on why that might be. Charts, calculations, statistics, and other supporting information also belong here (or, if lengthy, as an appendix). This should be the most detailed section of the research report, with references for further study. Present the information in a logical order, whether chronologically or in order of importance to the report's objectives.
Conclusion. This should be written with sound reasoning, often containing useful recommendations. The conclusion must be backed by a continuous thread of logic throughout the report.
- How to write a research paper
With a clear outline and robust pool of research, a research paper can start to write itself, but what's a good way to start a research report?
Research report examples are often the quickest way to gain inspiration for your report. Look for the types of research reports most relevant to your industry and consider which makes the most sense for your data and goals.
The research report outline will help you organize the elements of your report. One of the most time-tested report outlines is the IMRaD structure:
Introduction
...and Discussion
Pay close attention to the most well-established research reporting format in your industry, and consider your tone and language from your audience's perspective. Learn the key terms inside and out; incorrect jargon could easily harm the perceived authority of your research paper.
Along with a foundation in high-quality research and razor-sharp analysis, the most effective research reports will also demonstrate well-developed:
Internal logic
Narrative flow
Conclusions and recommendations
Readability, striking a balance between simple phrasing and technical insight
How to gather research data for your report
The validity of research data is critical. Because the research phase usually occurs well before the writing phase, you normally have plenty of time to vet your data.
However, research reports could involve ongoing research, where report authors (sometimes the researchers themselves) write portions of the report alongside ongoing research.
One such research-report example would be an R&D department that knows its primary stakeholders are eager to learn about a lengthy work in progress and any potentially important outcomes.
However you choose to manage the research and reporting, your data must meet robust quality standards before you can rely on it. Vet any research with the following questions in mind:
Does it use statistically valid analysis methods?
Do the researchers clearly explain their research, analysis, and sampling methods?
Did the researchers provide any caveats or advice on how to interpret their data?
Have you gathered the data yourself or were you in close contact with those who did?
Is the source biased?
Usually, flawed research methods become more apparent the further you get through a research report.
It's perfectly natural for good research to raise new questions, but the reader should have no uncertainty about what the data represents. There should be no doubt about matters such as:
Whether the sampling or analysis methods were based on sound and consistent logic
What the research samples are and where they came from
The accuracy of any statistical functions or equations
Validation of testing and measuring processes
When does a report require design validation?
A robust design validation process is often a gold standard in highly technical research reports. Design validation ensures the objects of a study are measured accurately, which lends more weight to your report and makes it valuable to more specialized industries.
Product development and engineering projects are the most common research-report examples that typically involve a design validation process. Depending on the scope and complexity of your research, you might face additional steps to validate your data and research procedures.
If you’re including design validation in the report (or report proposal), explain and justify your data-collection processes. Good design validation builds greater trust in a research report and lends more weight to its conclusions.
Choosing the right analysis method
Just as the quality of your report depends on properly validated research, a useful conclusion requires the most contextually relevant analysis method. This means comparing different statistical methods and choosing the one that makes the most sense for your research.
Most broadly, research analysis comes down to quantitative or qualitative methods (respectively: measurable by a number vs subjectively qualified values). There are also mixed research methods, which bridge the need for merging hard data with qualified assessments and still reach a cohesive set of conclusions.
Some of the most common analysis methods in research reports include:
Significance testing (aka hypothesis analysis), which compares test and control groups to determine how likely the data was the result of random chance.
Regression analysis , to establish relationships between variables, control for extraneous variables , and support correlation analysis.
Correlation analysis (aka bivariate testing), a method to identify and determine the strength of linear relationships between variables. It’s effective for detecting patterns from complex data, but care must be exercised to not confuse correlation with causation.
With any analysis method, it's important to justify which method you chose in the report. You should also provide estimates of the statistical accuracy (e.g., the p-value or confidence level of quantifiable data) of any data analysis.
This requires a commitment to the report's primary aim. For instance, this may be achieving a certain level of customer satisfaction by analyzing the cause and effect of changes to how service is delivered. Even better, use statistical analysis to calculate which change is most positively correlated with improved levels of customer satisfaction.
- Tips for writing research reports
There's endless good advice for writing effective research reports, and it almost all depends on the subjective aims of the people behind the report. Due to the wide variety of research reports, the best tips will be unique to each author's purpose.
Consider the following research report tips in any order, and take note of the ones most relevant to you:
No matter how in depth or detailed your report might be, provide a well-considered, succinct summary. At the very least, give your readers a quick and effective way to get up to speed.
Pare down your target audience (e.g., other researchers, employees, laypersons, etc.), and adjust your voice for their background knowledge and interest levels
For all but the most open-ended research, clarify your objectives, both for yourself and within the report.
Leverage your team members’ talents to fill in any knowledge gaps you might have. Your team is only as good as the sum of its parts.
Justify why your research proposal’s topic will endure long enough to derive value from the finished report.
Consolidate all research and analysis functions onto a single user-friendly platform. There's no reason to settle for less than developer-grade tools suitable for non-developers.
What's the format of a research report?
The research-reporting format is how the report is structured—a framework the authors use to organize their data, conclusions, arguments, and recommendations. The format heavily determines how the report's outline develops, because the format dictates the overall structure and order of information (based on the report's goals and research objectives).
What's the purpose of a research-report outline?
A good report outline gives form and substance to the report's objectives, presenting the results in a readable, engaging way. For any research-report format, the outline should create momentum along a chain of logic that builds up to a conclusion or interpretation.
What's the difference between a research essay and a research report?
There are several key differences between research reports and essays:
Research report:
Ordered into separate sections
More commercial in nature
Often includes infographics
Heavily descriptive
More self-referential
Usually provides recommendations
Research essay
Does not rely on research report formatting
More academically minded
Normally text-only
Less detailed
Omits discussion of methods
Usually non-prescriptive
Get started today
Go from raw data to valuable insights with a flexible research platform
Editor’s picks
Last updated: 21 December 2023
Last updated: 16 December 2023
Last updated: 6 October 2023
Last updated: 5 March 2024
Last updated: 25 November 2023
Last updated: 15 February 2024
Last updated: 11 March 2024
Last updated: 12 December 2023
Last updated: 6 March 2024
Last updated: 10 April 2023
Last updated: 20 December 2023
Latest articles
Related topics, log in or sign up.
Get started for free

An official website of the United States government
The .gov means it’s official. Federal government websites often end in .gov or .mil. Before sharing sensitive information, make sure you’re on a federal government site.
The site is secure. The https:// ensures that you are connecting to the official website and that any information you provide is encrypted and transmitted securely.
- Publications
- Account settings
Preview improvements coming to the PMC website in October 2024. Learn More or Try it out now .
- Advanced Search
- Journal List
- J Korean Med Sci
- v.37(16); 2022 Apr 25
A Practical Guide to Writing Quantitative and Qualitative Research Questions and Hypotheses in Scholarly Articles
Edward barroga.
1 Department of General Education, Graduate School of Nursing Science, St. Luke’s International University, Tokyo, Japan.
Glafera Janet Matanguihan
2 Department of Biological Sciences, Messiah University, Mechanicsburg, PA, USA.
The development of research questions and the subsequent hypotheses are prerequisites to defining the main research purpose and specific objectives of a study. Consequently, these objectives determine the study design and research outcome. The development of research questions is a process based on knowledge of current trends, cutting-edge studies, and technological advances in the research field. Excellent research questions are focused and require a comprehensive literature search and in-depth understanding of the problem being investigated. Initially, research questions may be written as descriptive questions which could be developed into inferential questions. These questions must be specific and concise to provide a clear foundation for developing hypotheses. Hypotheses are more formal predictions about the research outcomes. These specify the possible results that may or may not be expected regarding the relationship between groups. Thus, research questions and hypotheses clarify the main purpose and specific objectives of the study, which in turn dictate the design of the study, its direction, and outcome. Studies developed from good research questions and hypotheses will have trustworthy outcomes with wide-ranging social and health implications.
INTRODUCTION
Scientific research is usually initiated by posing evidenced-based research questions which are then explicitly restated as hypotheses. 1 , 2 The hypotheses provide directions to guide the study, solutions, explanations, and expected results. 3 , 4 Both research questions and hypotheses are essentially formulated based on conventional theories and real-world processes, which allow the inception of novel studies and the ethical testing of ideas. 5 , 6
It is crucial to have knowledge of both quantitative and qualitative research 2 as both types of research involve writing research questions and hypotheses. 7 However, these crucial elements of research are sometimes overlooked; if not overlooked, then framed without the forethought and meticulous attention it needs. Planning and careful consideration are needed when developing quantitative or qualitative research, particularly when conceptualizing research questions and hypotheses. 4
There is a continuing need to support researchers in the creation of innovative research questions and hypotheses, as well as for journal articles that carefully review these elements. 1 When research questions and hypotheses are not carefully thought of, unethical studies and poor outcomes usually ensue. Carefully formulated research questions and hypotheses define well-founded objectives, which in turn determine the appropriate design, course, and outcome of the study. This article then aims to discuss in detail the various aspects of crafting research questions and hypotheses, with the goal of guiding researchers as they develop their own. Examples from the authors and peer-reviewed scientific articles in the healthcare field are provided to illustrate key points.
DEFINITIONS AND RELATIONSHIP OF RESEARCH QUESTIONS AND HYPOTHESES
A research question is what a study aims to answer after data analysis and interpretation. The answer is written in length in the discussion section of the paper. Thus, the research question gives a preview of the different parts and variables of the study meant to address the problem posed in the research question. 1 An excellent research question clarifies the research writing while facilitating understanding of the research topic, objective, scope, and limitations of the study. 5
On the other hand, a research hypothesis is an educated statement of an expected outcome. This statement is based on background research and current knowledge. 8 , 9 The research hypothesis makes a specific prediction about a new phenomenon 10 or a formal statement on the expected relationship between an independent variable and a dependent variable. 3 , 11 It provides a tentative answer to the research question to be tested or explored. 4
Hypotheses employ reasoning to predict a theory-based outcome. 10 These can also be developed from theories by focusing on components of theories that have not yet been observed. 10 The validity of hypotheses is often based on the testability of the prediction made in a reproducible experiment. 8
Conversely, hypotheses can also be rephrased as research questions. Several hypotheses based on existing theories and knowledge may be needed to answer a research question. Developing ethical research questions and hypotheses creates a research design that has logical relationships among variables. These relationships serve as a solid foundation for the conduct of the study. 4 , 11 Haphazardly constructed research questions can result in poorly formulated hypotheses and improper study designs, leading to unreliable results. Thus, the formulations of relevant research questions and verifiable hypotheses are crucial when beginning research. 12
CHARACTERISTICS OF GOOD RESEARCH QUESTIONS AND HYPOTHESES
Excellent research questions are specific and focused. These integrate collective data and observations to confirm or refute the subsequent hypotheses. Well-constructed hypotheses are based on previous reports and verify the research context. These are realistic, in-depth, sufficiently complex, and reproducible. More importantly, these hypotheses can be addressed and tested. 13
There are several characteristics of well-developed hypotheses. Good hypotheses are 1) empirically testable 7 , 10 , 11 , 13 ; 2) backed by preliminary evidence 9 ; 3) testable by ethical research 7 , 9 ; 4) based on original ideas 9 ; 5) have evidenced-based logical reasoning 10 ; and 6) can be predicted. 11 Good hypotheses can infer ethical and positive implications, indicating the presence of a relationship or effect relevant to the research theme. 7 , 11 These are initially developed from a general theory and branch into specific hypotheses by deductive reasoning. In the absence of a theory to base the hypotheses, inductive reasoning based on specific observations or findings form more general hypotheses. 10
TYPES OF RESEARCH QUESTIONS AND HYPOTHESES
Research questions and hypotheses are developed according to the type of research, which can be broadly classified into quantitative and qualitative research. We provide a summary of the types of research questions and hypotheses under quantitative and qualitative research categories in Table 1 .
Research questions in quantitative research
In quantitative research, research questions inquire about the relationships among variables being investigated and are usually framed at the start of the study. These are precise and typically linked to the subject population, dependent and independent variables, and research design. 1 Research questions may also attempt to describe the behavior of a population in relation to one or more variables, or describe the characteristics of variables to be measured ( descriptive research questions ). 1 , 5 , 14 These questions may also aim to discover differences between groups within the context of an outcome variable ( comparative research questions ), 1 , 5 , 14 or elucidate trends and interactions among variables ( relationship research questions ). 1 , 5 We provide examples of descriptive, comparative, and relationship research questions in quantitative research in Table 2 .
Hypotheses in quantitative research
In quantitative research, hypotheses predict the expected relationships among variables. 15 Relationships among variables that can be predicted include 1) between a single dependent variable and a single independent variable ( simple hypothesis ) or 2) between two or more independent and dependent variables ( complex hypothesis ). 4 , 11 Hypotheses may also specify the expected direction to be followed and imply an intellectual commitment to a particular outcome ( directional hypothesis ) 4 . On the other hand, hypotheses may not predict the exact direction and are used in the absence of a theory, or when findings contradict previous studies ( non-directional hypothesis ). 4 In addition, hypotheses can 1) define interdependency between variables ( associative hypothesis ), 4 2) propose an effect on the dependent variable from manipulation of the independent variable ( causal hypothesis ), 4 3) state a negative relationship between two variables ( null hypothesis ), 4 , 11 , 15 4) replace the working hypothesis if rejected ( alternative hypothesis ), 15 explain the relationship of phenomena to possibly generate a theory ( working hypothesis ), 11 5) involve quantifiable variables that can be tested statistically ( statistical hypothesis ), 11 6) or express a relationship whose interlinks can be verified logically ( logical hypothesis ). 11 We provide examples of simple, complex, directional, non-directional, associative, causal, null, alternative, working, statistical, and logical hypotheses in quantitative research, as well as the definition of quantitative hypothesis-testing research in Table 3 .
Research questions in qualitative research
Unlike research questions in quantitative research, research questions in qualitative research are usually continuously reviewed and reformulated. The central question and associated subquestions are stated more than the hypotheses. 15 The central question broadly explores a complex set of factors surrounding the central phenomenon, aiming to present the varied perspectives of participants. 15
There are varied goals for which qualitative research questions are developed. These questions can function in several ways, such as to 1) identify and describe existing conditions ( contextual research question s); 2) describe a phenomenon ( descriptive research questions ); 3) assess the effectiveness of existing methods, protocols, theories, or procedures ( evaluation research questions ); 4) examine a phenomenon or analyze the reasons or relationships between subjects or phenomena ( explanatory research questions ); or 5) focus on unknown aspects of a particular topic ( exploratory research questions ). 5 In addition, some qualitative research questions provide new ideas for the development of theories and actions ( generative research questions ) or advance specific ideologies of a position ( ideological research questions ). 1 Other qualitative research questions may build on a body of existing literature and become working guidelines ( ethnographic research questions ). Research questions may also be broadly stated without specific reference to the existing literature or a typology of questions ( phenomenological research questions ), may be directed towards generating a theory of some process ( grounded theory questions ), or may address a description of the case and the emerging themes ( qualitative case study questions ). 15 We provide examples of contextual, descriptive, evaluation, explanatory, exploratory, generative, ideological, ethnographic, phenomenological, grounded theory, and qualitative case study research questions in qualitative research in Table 4 , and the definition of qualitative hypothesis-generating research in Table 5 .
Qualitative studies usually pose at least one central research question and several subquestions starting with How or What . These research questions use exploratory verbs such as explore or describe . These also focus on one central phenomenon of interest, and may mention the participants and research site. 15
Hypotheses in qualitative research
Hypotheses in qualitative research are stated in the form of a clear statement concerning the problem to be investigated. Unlike in quantitative research where hypotheses are usually developed to be tested, qualitative research can lead to both hypothesis-testing and hypothesis-generating outcomes. 2 When studies require both quantitative and qualitative research questions, this suggests an integrative process between both research methods wherein a single mixed-methods research question can be developed. 1
FRAMEWORKS FOR DEVELOPING RESEARCH QUESTIONS AND HYPOTHESES
Research questions followed by hypotheses should be developed before the start of the study. 1 , 12 , 14 It is crucial to develop feasible research questions on a topic that is interesting to both the researcher and the scientific community. This can be achieved by a meticulous review of previous and current studies to establish a novel topic. Specific areas are subsequently focused on to generate ethical research questions. The relevance of the research questions is evaluated in terms of clarity of the resulting data, specificity of the methodology, objectivity of the outcome, depth of the research, and impact of the study. 1 , 5 These aspects constitute the FINER criteria (i.e., Feasible, Interesting, Novel, Ethical, and Relevant). 1 Clarity and effectiveness are achieved if research questions meet the FINER criteria. In addition to the FINER criteria, Ratan et al. described focus, complexity, novelty, feasibility, and measurability for evaluating the effectiveness of research questions. 14
The PICOT and PEO frameworks are also used when developing research questions. 1 The following elements are addressed in these frameworks, PICOT: P-population/patients/problem, I-intervention or indicator being studied, C-comparison group, O-outcome of interest, and T-timeframe of the study; PEO: P-population being studied, E-exposure to preexisting conditions, and O-outcome of interest. 1 Research questions are also considered good if these meet the “FINERMAPS” framework: Feasible, Interesting, Novel, Ethical, Relevant, Manageable, Appropriate, Potential value/publishable, and Systematic. 14
As we indicated earlier, research questions and hypotheses that are not carefully formulated result in unethical studies or poor outcomes. To illustrate this, we provide some examples of ambiguous research question and hypotheses that result in unclear and weak research objectives in quantitative research ( Table 6 ) 16 and qualitative research ( Table 7 ) 17 , and how to transform these ambiguous research question(s) and hypothesis(es) into clear and good statements.
a These statements were composed for comparison and illustrative purposes only.
b These statements are direct quotes from Higashihara and Horiuchi. 16
a This statement is a direct quote from Shimoda et al. 17
The other statements were composed for comparison and illustrative purposes only.
CONSTRUCTING RESEARCH QUESTIONS AND HYPOTHESES
To construct effective research questions and hypotheses, it is very important to 1) clarify the background and 2) identify the research problem at the outset of the research, within a specific timeframe. 9 Then, 3) review or conduct preliminary research to collect all available knowledge about the possible research questions by studying theories and previous studies. 18 Afterwards, 4) construct research questions to investigate the research problem. Identify variables to be accessed from the research questions 4 and make operational definitions of constructs from the research problem and questions. Thereafter, 5) construct specific deductive or inductive predictions in the form of hypotheses. 4 Finally, 6) state the study aims . This general flow for constructing effective research questions and hypotheses prior to conducting research is shown in Fig. 1 .

Research questions are used more frequently in qualitative research than objectives or hypotheses. 3 These questions seek to discover, understand, explore or describe experiences by asking “What” or “How.” The questions are open-ended to elicit a description rather than to relate variables or compare groups. The questions are continually reviewed, reformulated, and changed during the qualitative study. 3 Research questions are also used more frequently in survey projects than hypotheses in experiments in quantitative research to compare variables and their relationships.
Hypotheses are constructed based on the variables identified and as an if-then statement, following the template, ‘If a specific action is taken, then a certain outcome is expected.’ At this stage, some ideas regarding expectations from the research to be conducted must be drawn. 18 Then, the variables to be manipulated (independent) and influenced (dependent) are defined. 4 Thereafter, the hypothesis is stated and refined, and reproducible data tailored to the hypothesis are identified, collected, and analyzed. 4 The hypotheses must be testable and specific, 18 and should describe the variables and their relationships, the specific group being studied, and the predicted research outcome. 18 Hypotheses construction involves a testable proposition to be deduced from theory, and independent and dependent variables to be separated and measured separately. 3 Therefore, good hypotheses must be based on good research questions constructed at the start of a study or trial. 12
In summary, research questions are constructed after establishing the background of the study. Hypotheses are then developed based on the research questions. Thus, it is crucial to have excellent research questions to generate superior hypotheses. In turn, these would determine the research objectives and the design of the study, and ultimately, the outcome of the research. 12 Algorithms for building research questions and hypotheses are shown in Fig. 2 for quantitative research and in Fig. 3 for qualitative research.

EXAMPLES OF RESEARCH QUESTIONS FROM PUBLISHED ARTICLES
- EXAMPLE 1. Descriptive research question (quantitative research)
- - Presents research variables to be assessed (distinct phenotypes and subphenotypes)
- “BACKGROUND: Since COVID-19 was identified, its clinical and biological heterogeneity has been recognized. Identifying COVID-19 phenotypes might help guide basic, clinical, and translational research efforts.
- RESEARCH QUESTION: Does the clinical spectrum of patients with COVID-19 contain distinct phenotypes and subphenotypes? ” 19
- EXAMPLE 2. Relationship research question (quantitative research)
- - Shows interactions between dependent variable (static postural control) and independent variable (peripheral visual field loss)
- “Background: Integration of visual, vestibular, and proprioceptive sensations contributes to postural control. People with peripheral visual field loss have serious postural instability. However, the directional specificity of postural stability and sensory reweighting caused by gradual peripheral visual field loss remain unclear.
- Research question: What are the effects of peripheral visual field loss on static postural control ?” 20
- EXAMPLE 3. Comparative research question (quantitative research)
- - Clarifies the difference among groups with an outcome variable (patients enrolled in COMPERA with moderate PH or severe PH in COPD) and another group without the outcome variable (patients with idiopathic pulmonary arterial hypertension (IPAH))
- “BACKGROUND: Pulmonary hypertension (PH) in COPD is a poorly investigated clinical condition.
- RESEARCH QUESTION: Which factors determine the outcome of PH in COPD?
- STUDY DESIGN AND METHODS: We analyzed the characteristics and outcome of patients enrolled in the Comparative, Prospective Registry of Newly Initiated Therapies for Pulmonary Hypertension (COMPERA) with moderate or severe PH in COPD as defined during the 6th PH World Symposium who received medical therapy for PH and compared them with patients with idiopathic pulmonary arterial hypertension (IPAH) .” 21
- EXAMPLE 4. Exploratory research question (qualitative research)
- - Explores areas that have not been fully investigated (perspectives of families and children who receive care in clinic-based child obesity treatment) to have a deeper understanding of the research problem
- “Problem: Interventions for children with obesity lead to only modest improvements in BMI and long-term outcomes, and data are limited on the perspectives of families of children with obesity in clinic-based treatment. This scoping review seeks to answer the question: What is known about the perspectives of families and children who receive care in clinic-based child obesity treatment? This review aims to explore the scope of perspectives reported by families of children with obesity who have received individualized outpatient clinic-based obesity treatment.” 22
- EXAMPLE 5. Relationship research question (quantitative research)
- - Defines interactions between dependent variable (use of ankle strategies) and independent variable (changes in muscle tone)
- “Background: To maintain an upright standing posture against external disturbances, the human body mainly employs two types of postural control strategies: “ankle strategy” and “hip strategy.” While it has been reported that the magnitude of the disturbance alters the use of postural control strategies, it has not been elucidated how the level of muscle tone, one of the crucial parameters of bodily function, determines the use of each strategy. We have previously confirmed using forward dynamics simulations of human musculoskeletal models that an increased muscle tone promotes the use of ankle strategies. The objective of the present study was to experimentally evaluate a hypothesis: an increased muscle tone promotes the use of ankle strategies. Research question: Do changes in the muscle tone affect the use of ankle strategies ?” 23
EXAMPLES OF HYPOTHESES IN PUBLISHED ARTICLES
- EXAMPLE 1. Working hypothesis (quantitative research)
- - A hypothesis that is initially accepted for further research to produce a feasible theory
- “As fever may have benefit in shortening the duration of viral illness, it is plausible to hypothesize that the antipyretic efficacy of ibuprofen may be hindering the benefits of a fever response when taken during the early stages of COVID-19 illness .” 24
- “In conclusion, it is plausible to hypothesize that the antipyretic efficacy of ibuprofen may be hindering the benefits of a fever response . The difference in perceived safety of these agents in COVID-19 illness could be related to the more potent efficacy to reduce fever with ibuprofen compared to acetaminophen. Compelling data on the benefit of fever warrant further research and review to determine when to treat or withhold ibuprofen for early stage fever for COVID-19 and other related viral illnesses .” 24
- EXAMPLE 2. Exploratory hypothesis (qualitative research)
- - Explores particular areas deeper to clarify subjective experience and develop a formal hypothesis potentially testable in a future quantitative approach
- “We hypothesized that when thinking about a past experience of help-seeking, a self distancing prompt would cause increased help-seeking intentions and more favorable help-seeking outcome expectations .” 25
- “Conclusion
- Although a priori hypotheses were not supported, further research is warranted as results indicate the potential for using self-distancing approaches to increasing help-seeking among some people with depressive symptomatology.” 25
- EXAMPLE 3. Hypothesis-generating research to establish a framework for hypothesis testing (qualitative research)
- “We hypothesize that compassionate care is beneficial for patients (better outcomes), healthcare systems and payers (lower costs), and healthcare providers (lower burnout). ” 26
- Compassionomics is the branch of knowledge and scientific study of the effects of compassionate healthcare. Our main hypotheses are that compassionate healthcare is beneficial for (1) patients, by improving clinical outcomes, (2) healthcare systems and payers, by supporting financial sustainability, and (3) HCPs, by lowering burnout and promoting resilience and well-being. The purpose of this paper is to establish a scientific framework for testing the hypotheses above . If these hypotheses are confirmed through rigorous research, compassionomics will belong in the science of evidence-based medicine, with major implications for all healthcare domains.” 26
- EXAMPLE 4. Statistical hypothesis (quantitative research)
- - An assumption is made about the relationship among several population characteristics ( gender differences in sociodemographic and clinical characteristics of adults with ADHD ). Validity is tested by statistical experiment or analysis ( chi-square test, Students t-test, and logistic regression analysis)
- “Our research investigated gender differences in sociodemographic and clinical characteristics of adults with ADHD in a Japanese clinical sample. Due to unique Japanese cultural ideals and expectations of women's behavior that are in opposition to ADHD symptoms, we hypothesized that women with ADHD experience more difficulties and present more dysfunctions than men . We tested the following hypotheses: first, women with ADHD have more comorbidities than men with ADHD; second, women with ADHD experience more social hardships than men, such as having less full-time employment and being more likely to be divorced.” 27
- “Statistical Analysis
- ( text omitted ) Between-gender comparisons were made using the chi-squared test for categorical variables and Students t-test for continuous variables…( text omitted ). A logistic regression analysis was performed for employment status, marital status, and comorbidity to evaluate the independent effects of gender on these dependent variables.” 27
EXAMPLES OF HYPOTHESIS AS WRITTEN IN PUBLISHED ARTICLES IN RELATION TO OTHER PARTS
- EXAMPLE 1. Background, hypotheses, and aims are provided
- “Pregnant women need skilled care during pregnancy and childbirth, but that skilled care is often delayed in some countries …( text omitted ). The focused antenatal care (FANC) model of WHO recommends that nurses provide information or counseling to all pregnant women …( text omitted ). Job aids are visual support materials that provide the right kind of information using graphics and words in a simple and yet effective manner. When nurses are not highly trained or have many work details to attend to, these job aids can serve as a content reminder for the nurses and can be used for educating their patients (Jennings, Yebadokpo, Affo, & Agbogbe, 2010) ( text omitted ). Importantly, additional evidence is needed to confirm how job aids can further improve the quality of ANC counseling by health workers in maternal care …( text omitted )” 28
- “ This has led us to hypothesize that the quality of ANC counseling would be better if supported by job aids. Consequently, a better quality of ANC counseling is expected to produce higher levels of awareness concerning the danger signs of pregnancy and a more favorable impression of the caring behavior of nurses .” 28
- “This study aimed to examine the differences in the responses of pregnant women to a job aid-supported intervention during ANC visit in terms of 1) their understanding of the danger signs of pregnancy and 2) their impression of the caring behaviors of nurses to pregnant women in rural Tanzania.” 28
- EXAMPLE 2. Background, hypotheses, and aims are provided
- “We conducted a two-arm randomized controlled trial (RCT) to evaluate and compare changes in salivary cortisol and oxytocin levels of first-time pregnant women between experimental and control groups. The women in the experimental group touched and held an infant for 30 min (experimental intervention protocol), whereas those in the control group watched a DVD movie of an infant (control intervention protocol). The primary outcome was salivary cortisol level and the secondary outcome was salivary oxytocin level.” 29
- “ We hypothesize that at 30 min after touching and holding an infant, the salivary cortisol level will significantly decrease and the salivary oxytocin level will increase in the experimental group compared with the control group .” 29
- EXAMPLE 3. Background, aim, and hypothesis are provided
- “In countries where the maternal mortality ratio remains high, antenatal education to increase Birth Preparedness and Complication Readiness (BPCR) is considered one of the top priorities [1]. BPCR includes birth plans during the antenatal period, such as the birthplace, birth attendant, transportation, health facility for complications, expenses, and birth materials, as well as family coordination to achieve such birth plans. In Tanzania, although increasing, only about half of all pregnant women attend an antenatal clinic more than four times [4]. Moreover, the information provided during antenatal care (ANC) is insufficient. In the resource-poor settings, antenatal group education is a potential approach because of the limited time for individual counseling at antenatal clinics.” 30
- “This study aimed to evaluate an antenatal group education program among pregnant women and their families with respect to birth-preparedness and maternal and infant outcomes in rural villages of Tanzania.” 30
- “ The study hypothesis was if Tanzanian pregnant women and their families received a family-oriented antenatal group education, they would (1) have a higher level of BPCR, (2) attend antenatal clinic four or more times, (3) give birth in a health facility, (4) have less complications of women at birth, and (5) have less complications and deaths of infants than those who did not receive the education .” 30
Research questions and hypotheses are crucial components to any type of research, whether quantitative or qualitative. These questions should be developed at the very beginning of the study. Excellent research questions lead to superior hypotheses, which, like a compass, set the direction of research, and can often determine the successful conduct of the study. Many research studies have floundered because the development of research questions and subsequent hypotheses was not given the thought and meticulous attention needed. The development of research questions and hypotheses is an iterative process based on extensive knowledge of the literature and insightful grasp of the knowledge gap. Focused, concise, and specific research questions provide a strong foundation for constructing hypotheses which serve as formal predictions about the research outcomes. Research questions and hypotheses are crucial elements of research that should not be overlooked. They should be carefully thought of and constructed when planning research. This avoids unethical studies and poor outcomes by defining well-founded objectives that determine the design, course, and outcome of the study.
Disclosure: The authors have no potential conflicts of interest to disclose.
Author Contributions:
- Conceptualization: Barroga E, Matanguihan GJ.
- Methodology: Barroga E, Matanguihan GJ.
- Writing - original draft: Barroga E, Matanguihan GJ.
- Writing - review & editing: Barroga E, Matanguihan GJ.
Research methods & reporting
Quantifying possible bias in clinical and epidemiological studies with quantitative bias analysis: common approaches and limitations, assessing robustness to worst case publication bias using a simple subset meta-analysis, regression discontinuity design studies: a guide for health researchers, process guide for inferential studies using healthcare data from routine clinical practice to evaluate causal effects of drugs, updated recommendations for the cochrane rapid review methods guidance for rapid reviews of effectiveness, avoiding conflicts of interest and reputational risks associated with population research on food and nutrition, the estimands framework: a primer on the ich e9(r1) addendum, evaluation of clinical prediction models (part 3): calculating the sample size required for an external validation study, evaluation of clinical prediction models (part 2): how to undertake an external validation study, evaluation of clinical prediction models (part 1): from development to external validation, emulation of a target trial using electronic health records and a nested case-control design, rob-me: a tool for assessing risk of bias due to missing evidence in systematic reviews with meta-analysis, enhancing reporting quality and impact of early phase dose-finding clinical trials: consort dose-finding extension (consort-define) guidance, enhancing quality and impact of early phase dose-finding clinical trial protocols: spirit dose-finding extension (spirit-define) guidance, understanding how health interventions or exposures produce their effects using mediation analysis, a guide and pragmatic considerations for applying grade to network meta-analysis, a framework for assessing selection and misclassification bias in mendelian randomisation studies: an illustrative example between bmi and covid-19, practical thematic analysis: a guide for multidisciplinary health services research teams engaging in qualitative analysis, selection bias due to conditioning on a collider, the imprinting effect of covid-19 vaccines: an expected selection bias in observational studies, a step-by-step approach for selecting an optimal minimal important difference, recommendations for the development, implementation, and reporting of control interventions in trials of self-management therapies, methods for deriving risk difference (absolute risk reduction) from a meta-analysis, transparent reporting of multivariable prediction models for individual prognosis or diagnosis: checklist for systematic reviews and meta-analyses, consort harms 2022 statement, explanation, and elaboration: updated guideline for the reporting of harms in randomised trials, transparent reporting of multivariable prediction models: : explanation and elaboration, transparent reporting of multivariable prediction models: tripod-cluster checklist, bias by censoring for competing events in survival analysis, code-ehr best practice framework for the use of structured electronic healthcare records in clinical research, validation of prediction models in the presence of competing risks, reporting guideline for the early stage clinical evaluation of decision support systems driven by artificial intelligence, searching clinical trials registers: guide for systematic reviewers, how to design high quality acupuncture trials—a consensus informed by evidence, early phase clinical trials extension to guidelines for the content of statistical analysis plans, incorporating dose effects in network meta-analysis, consolidated health economic evaluation reporting standards 2022 statement, strengthening the reporting of observational studies in epidemiology using mendelian randomisation (strobe-mr): explanation and elaboration, a new framework for developing and evaluating complex interventions, adapting interventions to new contexts—the adapt guidance, recommendations for including or reviewing patient reported outcome endpoints in grant applications, consort extension for the reporting of randomised controlled trials conducted using cohorts and routinely collected data (consort-routine): checklist with explanation and elaboration, consort extension for the reporting of randomised controlled trials conducted using cohorts and routinely collected data, guidance for the design and reporting of studies evaluating the clinical performance of tests for present or past sars-cov-2 infection, the prisma 2020 statement: an updated guideline for reporting systematic reviews, prisma 2020 explanation and elaboration: updated guidance and exemplars for reporting systematic reviews, preferred reporting items for journal and conference abstracts of systematic reviews and meta-analyses of diagnostic test accuracy studies (prisma-dta for abstracts): checklist, explanation, and elaboration, designing and undertaking randomised implementation trials: guide for researchers, start-rwe: structured template for planning and reporting on the implementation of real world evidence studies, methodological standards for qualitative and mixed methods patient centered outcomes research, grade approach to drawing conclusions from a network meta-analysis using a minimally contextualised framework, grade approach to drawing conclusions from a network meta-analysis using a partially contextualised framework, use of multiple period, cluster randomised, crossover trial designs for comparative effectiveness research, when to replicate systematic reviews of interventions: consensus checklist, reporting guidelines for clinical trial reports for interventions involving artificial intelligence: the consort-ai extension, guidelines for clinical trial protocols for interventions involving artificial intelligence: the spirit-ai extension, preferred reporting items for systematic review and meta-analysis of diagnostic test accuracy studies (prisma-dta): explanation, elaboration, and checklist, non-adherence in non-inferiority trials: pitfalls and recommendations, the adaptive designs consort extension (ace) statement: a checklist with explanation and elaboration guideline for reporting randomised trials that use an adaptive design, machine learning and artificial intelligence research for patient benefit: 20 critical questions on transparency, replicability, ethics, and effectiveness, calculating the sample size required for developing a clinical prediction model, spirit extension and elaboration for n-of-1 trials: spent 2019 checklist, synthesis without meta-analysis (swim) in systematic reviews: reporting guideline, alternative approaches for confounding adjustment in observational studies using weighting based on the propensity score: a primer for practitioners, a guide to prospective meta-analysis, rob 2: a revised tool for assessing risk of bias in randomised trials, consort 2010 statement: extension to randomised crossover trials, when and how to use data from randomised trials to develop or validate prognostic models, guide to presenting clinical prediction models for use in clinical settings, a guide to systematic review and meta-analysis of prognostic factor studies, when continuous outcomes are measured using different scales: guide for meta-analysis and interpretation, the reporting of studies conducted using observational routinely collected health data statement for pharmacoepidemiology (record-pe), reporting of stepped wedge cluster randomised trials: extension of the consort 2010 statement with explanation and elaboration, delta,2, guidance on choosing the target difference and undertaking and reporting the sample size calculation for a randomised controlled trial, outcome reporting bias in trials: a methodological approach for assessment and adjustment in systematic reviews, reading mendelian randomisation studies: a guide, glossary, and checklist for clinicians, how to use fda drug approval documents for evidence syntheses, how to avoid common problems when using clinicaltrials.gov in research: 10 issues to consider, tidier-php: a reporting guideline for population health and policy interventions, analysis of cluster randomised trials with an assessment of outcome at baseline, key design considerations for adaptive clinical trials: a primer for clinicians, population attributable fraction, how to estimate the effect of treatment duration on survival outcomes using observational data, concerns about composite reference standards in diagnostic research, statistical methods to compare functional outcomes in randomized controlled trials with high mortality, consort-equity 2017 extension and elaboration for better reporting of health equity in randomised trials, handling time varying confounding in observational research, four study design principles for genetic investigations using next generation sequencing, amstar 2: a critical appraisal tool for systematic reviews that include randomised or non-randomised studies of healthcare interventions, or both, multivariate and network meta-analysis of multiple outcomes and multiple treatments: rationale, concepts, and examples, stard for abstracts: essential items for reporting diagnostic accuracy studies in journal or conference abstracts, statistics notes: percentage differences, symmetry, and natural logarithms, statistics notes: what is a percentage difference, gripp2 reporting checklists: tools to improve reporting of patient and public involvement in research, enhancing the usability of systematic reviews by improving the consideration and description of interventions, how to design efficient cluster randomised trials, consort 2010 statement: extension checklist for reporting within person randomised trials, life expectancy difference and life expectancy ratio: two measures of treatment effects in randomised trials with non-proportional hazards, standards for reporting implementation studies (stari) statement, meta-analytical methods to identify who benefits most from treatments: daft, deluded, or deft approach, follow us on, content links.
- Collections
- Health in South Asia
- Women’s, children’s & adolescents’ health
- News and views
- BMJ Opinion
- Rapid responses
- Editorial staff
- BMJ in the USA
- BMJ in South Asia
- Submit your paper
- BMA members
- Subscribers
- Advertisers and sponsors
Explore BMJ
- Our company
- BMJ Careers
- BMJ Learning
- BMJ Masterclasses
- BMJ Journals
- BMJ Student
- Academic edition of The BMJ
- BMJ Best Practice
- The BMJ Awards
- Email alerts
- Activate subscription
Information
- Skip to main content
- Skip to primary sidebar
- Skip to footer
- QuestionPro

- Solutions Industries Gaming Automotive Sports and events Education Government Travel & Hospitality Financial Services Healthcare Cannabis Technology Use Case NPS+ Communities Audience Contactless surveys Mobile LivePolls Member Experience GDPR Positive People Science 360 Feedback Surveys
- Resources Blog eBooks Survey Templates Case Studies Training Help center
Home Market Research
Research Reports: Definition and How to Write Them

Reports are usually spread across a vast horizon of topics but are focused on communicating information about a particular topic and a niche target market. The primary motive of research reports is to convey integral details about a study for marketers to consider while designing new strategies.
Certain events, facts, and other information based on incidents need to be relayed to the people in charge, and creating research reports is the most effective communication tool. Ideal research reports are extremely accurate in the offered information with a clear objective and conclusion. These reports should have a clean and structured format to relay information effectively.
What are Research Reports?
Research reports are recorded data prepared by researchers or statisticians after analyzing the information gathered by conducting organized research, typically in the form of surveys or qualitative methods .
A research report is a reliable source to recount details about a conducted research. It is most often considered to be a true testimony of all the work done to garner specificities of research.
The various sections of a research report are:
- Background/Introduction
- Implemented Methods
- Results based on Analysis
- Deliberation
Learn more: Quantitative Research
Components of Research Reports
Research is imperative for launching a new product/service or a new feature. The markets today are extremely volatile and competitive due to new entrants every day who may or may not provide effective products. An organization needs to make the right decisions at the right time to be relevant in such a market with updated products that suffice customer demands.
The details of a research report may change with the purpose of research but the main components of a report will remain constant. The research approach of the market researcher also influences the style of writing reports. Here are seven main components of a productive research report:
- Research Report Summary: The entire objective along with the overview of research are to be included in a summary which is a couple of paragraphs in length. All the multiple components of the research are explained in brief under the report summary. It should be interesting enough to capture all the key elements of the report.
- Research Introduction: There always is a primary goal that the researcher is trying to achieve through a report. In the introduction section, he/she can cover answers related to this goal and establish a thesis which will be included to strive and answer it in detail. This section should answer an integral question: “What is the current situation of the goal?”. After the research design was conducted, did the organization conclude the goal successfully or they are still a work in progress – provide such details in the introduction part of the research report.
- Research Methodology: This is the most important section of the report where all the important information lies. The readers can gain data for the topic along with analyzing the quality of provided content and the research can also be approved by other market researchers . Thus, this section needs to be highly informative with each aspect of research discussed in detail. Information needs to be expressed in chronological order according to its priority and importance. Researchers should include references in case they gained information from existing techniques.
- Research Results: A short description of the results along with calculations conducted to achieve the goal will form this section of results. Usually, the exposition after data analysis is carried out in the discussion part of the report.
Learn more: Quantitative Data
- Research Discussion: The results are discussed in extreme detail in this section along with a comparative analysis of reports that could probably exist in the same domain. Any abnormality uncovered during research will be deliberated in the discussion section. While writing research reports, the researcher will have to connect the dots on how the results will be applicable in the real world.
- Research References and Conclusion: Conclude all the research findings along with mentioning each and every author, article or any content piece from where references were taken.
Learn more: Qualitative Observation
15 Tips for Writing Research Reports
Writing research reports in the manner can lead to all the efforts going down the drain. Here are 15 tips for writing impactful research reports:
- Prepare the context before starting to write and start from the basics: This was always taught to us in school – be well-prepared before taking a plunge into new topics. The order of survey questions might not be the ideal or most effective order for writing research reports. The idea is to start with a broader topic and work towards a more specific one and focus on a conclusion or support, which a research should support with the facts. The most difficult thing to do in reporting, without a doubt is to start. Start with the title, the introduction, then document the first discoveries and continue from that. Once the marketers have the information well documented, they can write a general conclusion.
- Keep the target audience in mind while selecting a format that is clear, logical and obvious to them: Will the research reports be presented to decision makers or other researchers? What are the general perceptions around that topic? This requires more care and diligence. A researcher will need a significant amount of information to start writing the research report. Be consistent with the wording, the numbering of the annexes and so on. Follow the approved format of the company for the delivery of research reports and demonstrate the integrity of the project with the objectives of the company.
- Have a clear research objective: A researcher should read the entire proposal again, and make sure that the data they provide contributes to the objectives that were raised from the beginning. Remember that speculations are for conversations, not for research reports, if a researcher speculates, they directly question their own research.
- Establish a working model: Each study must have an internal logic, which will have to be established in the report and in the evidence. The researchers’ worst nightmare is to be required to write research reports and realize that key questions were not included.
Learn more: Quantitative Observation
- Gather all the information about the research topic. Who are the competitors of our customers? Talk to other researchers who have studied the subject of research, know the language of the industry. Misuse of the terms can discourage the readers of research reports from reading further.
- Read aloud while writing. While reading the report, if the researcher hears something inappropriate, for example, if they stumble over the words when reading them, surely the reader will too. If the researcher can’t put an idea in a single sentence, then it is very long and they must change it so that the idea is clear to everyone.
- Check grammar and spelling. Without a doubt, good practices help to understand the report. Use verbs in the present tense. Consider using the present tense, which makes the results sound more immediate. Find new words and other ways of saying things. Have fun with the language whenever possible.
- Discuss only the discoveries that are significant. If some data are not really significant, do not mention them. Remember that not everything is truly important or essential within research reports.
Learn more: Qualitative Data
- Try and stick to the survey questions. For example, do not say that the people surveyed “were worried” about an research issue , when there are different degrees of concern.
- The graphs must be clear enough so that they understand themselves. Do not let graphs lead the reader to make mistakes: give them a title, include the indications, the size of the sample, and the correct wording of the question.
- Be clear with messages. A researcher should always write every section of the report with an accuracy of details and language.
- Be creative with titles – Particularly in segmentation studies choose names “that give life to research”. Such names can survive for a long time after the initial investigation.
- Create an effective conclusion: The conclusion in the research reports is the most difficult to write, but it is an incredible opportunity to excel. Make a precise summary. Sometimes it helps to start the conclusion with something specific, then it describes the most important part of the study, and finally, it provides the implications of the conclusions.
- Get a couple more pair of eyes to read the report. Writers have trouble detecting their own mistakes. But they are responsible for what is presented. Ensure it has been approved by colleagues or friends before sending the find draft out.
Learn more: Market Research and Analysis
MORE LIKE THIS

Government Customer Experience: Impact on Government Service
Apr 11, 2024

Employee Engagement App: Top 11 For Workforce Improvement
Apr 10, 2024

Top 15 Employee Evaluation Software to Enhance Performance

Event Feedback Software: Top 11 Best in 2024
Apr 9, 2024
Other categories
- Academic Research
- Artificial Intelligence
- Assessments
- Brand Awareness
- Case Studies
- Communities
- Consumer Insights
- Customer effort score
- Customer Engagement
- Customer Experience
- Customer Loyalty
- Customer Research
- Customer Satisfaction
- Employee Benefits
- Employee Engagement
- Employee Retention
- Friday Five
- General Data Protection Regulation
- Insights Hub
- Life@QuestionPro
- Market Research
- Mobile diaries
- Mobile Surveys
- New Features
- Online Communities
- Question Types
- Questionnaire
- QuestionPro Products
- Release Notes
- Research Tools and Apps
- Revenue at Risk
- Survey Templates
- Training Tips
- Uncategorized
- Video Learning Series
- What’s Coming Up
- Workforce Intelligence
Research Methods In Psychology
Saul Mcleod, PhD
Editor-in-Chief for Simply Psychology
BSc (Hons) Psychology, MRes, PhD, University of Manchester
Saul Mcleod, PhD., is a qualified psychology teacher with over 18 years of experience in further and higher education. He has been published in peer-reviewed journals, including the Journal of Clinical Psychology.
Learn about our Editorial Process
Olivia Guy-Evans, MSc
Associate Editor for Simply Psychology
BSc (Hons) Psychology, MSc Psychology of Education
Olivia Guy-Evans is a writer and associate editor for Simply Psychology. She has previously worked in healthcare and educational sectors.
Research methods in psychology are systematic procedures used to observe, describe, predict, and explain behavior and mental processes. They include experiments, surveys, case studies, and naturalistic observations, ensuring data collection is objective and reliable to understand and explain psychological phenomena.

Hypotheses are statements about the prediction of the results, that can be verified or disproved by some investigation.
There are four types of hypotheses :
- Null Hypotheses (H0 ) – these predict that no difference will be found in the results between the conditions. Typically these are written ‘There will be no difference…’
- Alternative Hypotheses (Ha or H1) – these predict that there will be a significant difference in the results between the two conditions. This is also known as the experimental hypothesis.
- One-tailed (directional) hypotheses – these state the specific direction the researcher expects the results to move in, e.g. higher, lower, more, less. In a correlation study, the predicted direction of the correlation can be either positive or negative.
- Two-tailed (non-directional) hypotheses – these state that a difference will be found between the conditions of the independent variable but does not state the direction of a difference or relationship. Typically these are always written ‘There will be a difference ….’
All research has an alternative hypothesis (either a one-tailed or two-tailed) and a corresponding null hypothesis.
Once the research is conducted and results are found, psychologists must accept one hypothesis and reject the other.
So, if a difference is found, the Psychologist would accept the alternative hypothesis and reject the null. The opposite applies if no difference is found.
Sampling techniques
Sampling is the process of selecting a representative group from the population under study.

A sample is the participants you select from a target population (the group you are interested in) to make generalizations about.
Representative means the extent to which a sample mirrors a researcher’s target population and reflects its characteristics.
Generalisability means the extent to which their findings can be applied to the larger population of which their sample was a part.
- Volunteer sample : where participants pick themselves through newspaper adverts, noticeboards or online.
- Opportunity sampling : also known as convenience sampling , uses people who are available at the time the study is carried out and willing to take part. It is based on convenience.
- Random sampling : when every person in the target population has an equal chance of being selected. An example of random sampling would be picking names out of a hat.
- Systematic sampling : when a system is used to select participants. Picking every Nth person from all possible participants. N = the number of people in the research population / the number of people needed for the sample.
- Stratified sampling : when you identify the subgroups and select participants in proportion to their occurrences.
- Snowball sampling : when researchers find a few participants, and then ask them to find participants themselves and so on.
- Quota sampling : when researchers will be told to ensure the sample fits certain quotas, for example they might be told to find 90 participants, with 30 of them being unemployed.
Experiments always have an independent and dependent variable .
- The independent variable is the one the experimenter manipulates (the thing that changes between the conditions the participants are placed into). It is assumed to have a direct effect on the dependent variable.
- The dependent variable is the thing being measured, or the results of the experiment.

Operationalization of variables means making them measurable/quantifiable. We must use operationalization to ensure that variables are in a form that can be easily tested.
For instance, we can’t really measure ‘happiness’, but we can measure how many times a person smiles within a two-hour period.
By operationalizing variables, we make it easy for someone else to replicate our research. Remember, this is important because we can check if our findings are reliable.
Extraneous variables are all variables which are not independent variable but could affect the results of the experiment.
It can be a natural characteristic of the participant, such as intelligence levels, gender, or age for example, or it could be a situational feature of the environment such as lighting or noise.
Demand characteristics are a type of extraneous variable that occurs if the participants work out the aims of the research study, they may begin to behave in a certain way.
For example, in Milgram’s research , critics argued that participants worked out that the shocks were not real and they administered them as they thought this was what was required of them.
Extraneous variables must be controlled so that they do not affect (confound) the results.
Randomly allocating participants to their conditions or using a matched pairs experimental design can help to reduce participant variables.
Situational variables are controlled by using standardized procedures, ensuring every participant in a given condition is treated in the same way
Experimental Design
Experimental design refers to how participants are allocated to each condition of the independent variable, such as a control or experimental group.
- Independent design ( between-groups design ): each participant is selected for only one group. With the independent design, the most common way of deciding which participants go into which group is by means of randomization.
- Matched participants design : each participant is selected for only one group, but the participants in the two groups are matched for some relevant factor or factors (e.g. ability; sex; age).
- Repeated measures design ( within groups) : each participant appears in both groups, so that there are exactly the same participants in each group.
- The main problem with the repeated measures design is that there may well be order effects. Their experiences during the experiment may change the participants in various ways.
- They may perform better when they appear in the second group because they have gained useful information about the experiment or about the task. On the other hand, they may perform less well on the second occasion because of tiredness or boredom.
- Counterbalancing is the best way of preventing order effects from disrupting the findings of an experiment, and involves ensuring that each condition is equally likely to be used first and second by the participants.
If we wish to compare two groups with respect to a given independent variable, it is essential to make sure that the two groups do not differ in any other important way.
Experimental Methods
All experimental methods involve an iv (independent variable) and dv (dependent variable)..
- Field experiments are conducted in the everyday (natural) environment of the participants. The experimenter still manipulates the IV, but in a real-life setting. It may be possible to control extraneous variables, though such control is more difficult than in a lab experiment.
- Natural experiments are when a naturally occurring IV is investigated that isn’t deliberately manipulated, it exists anyway. Participants are not randomly allocated, and the natural event may only occur rarely.
Case studies are in-depth investigations of a person, group, event, or community. It uses information from a range of sources, such as from the person concerned and also from their family and friends.
Many techniques may be used such as interviews, psychological tests, observations and experiments. Case studies are generally longitudinal: in other words, they follow the individual or group over an extended period of time.
Case studies are widely used in psychology and among the best-known ones carried out were by Sigmund Freud . He conducted very detailed investigations into the private lives of his patients in an attempt to both understand and help them overcome their illnesses.
Case studies provide rich qualitative data and have high levels of ecological validity. However, it is difficult to generalize from individual cases as each one has unique characteristics.
Correlational Studies
Correlation means association; it is a measure of the extent to which two variables are related. One of the variables can be regarded as the predictor variable with the other one as the outcome variable.
Correlational studies typically involve obtaining two different measures from a group of participants, and then assessing the degree of association between the measures.
The predictor variable can be seen as occurring before the outcome variable in some sense. It is called the predictor variable, because it forms the basis for predicting the value of the outcome variable.
Relationships between variables can be displayed on a graph or as a numerical score called a correlation coefficient.

- If an increase in one variable tends to be associated with an increase in the other, then this is known as a positive correlation .
- If an increase in one variable tends to be associated with a decrease in the other, then this is known as a negative correlation .
- A zero correlation occurs when there is no relationship between variables.
After looking at the scattergraph, if we want to be sure that a significant relationship does exist between the two variables, a statistical test of correlation can be conducted, such as Spearman’s rho.
The test will give us a score, called a correlation coefficient . This is a value between 0 and 1, and the closer to 1 the score is, the stronger the relationship between the variables. This value can be both positive e.g. 0.63, or negative -0.63.

A correlation between variables, however, does not automatically mean that the change in one variable is the cause of the change in the values of the other variable. A correlation only shows if there is a relationship between variables.
Correlation does not always prove causation, as a third variable may be involved.

Interview Methods
Interviews are commonly divided into two types: structured and unstructured.
A fixed, predetermined set of questions is put to every participant in the same order and in the same way.
Responses are recorded on a questionnaire, and the researcher presets the order and wording of questions, and sometimes the range of alternative answers.
The interviewer stays within their role and maintains social distance from the interviewee.
There are no set questions, and the participant can raise whatever topics he/she feels are relevant and ask them in their own way. Questions are posed about participants’ answers to the subject
Unstructured interviews are most useful in qualitative research to analyze attitudes and values.
Though they rarely provide a valid basis for generalization, their main advantage is that they enable the researcher to probe social actors’ subjective point of view.
Questionnaire Method
Questionnaires can be thought of as a kind of written interview. They can be carried out face to face, by telephone, or post.
The choice of questions is important because of the need to avoid bias or ambiguity in the questions, ‘leading’ the respondent or causing offense.
- Open questions are designed to encourage a full, meaningful answer using the subject’s own knowledge and feelings. They provide insights into feelings, opinions, and understanding. Example: “How do you feel about that situation?”
- Closed questions can be answered with a simple “yes” or “no” or specific information, limiting the depth of response. They are useful for gathering specific facts or confirming details. Example: “Do you feel anxious in crowds?”
Its other practical advantages are that it is cheaper than face-to-face interviews and can be used to contact many respondents scattered over a wide area relatively quickly.
Observations
There are different types of observation methods :
- Covert observation is where the researcher doesn’t tell the participants they are being observed until after the study is complete. There could be ethical problems or deception and consent with this particular observation method.
- Overt observation is where a researcher tells the participants they are being observed and what they are being observed for.
- Controlled : behavior is observed under controlled laboratory conditions (e.g., Bandura’s Bobo doll study).
- Natural : Here, spontaneous behavior is recorded in a natural setting.
- Participant : Here, the observer has direct contact with the group of people they are observing. The researcher becomes a member of the group they are researching.
- Non-participant (aka “fly on the wall): The researcher does not have direct contact with the people being observed. The observation of participants’ behavior is from a distance
Pilot Study
A pilot study is a small scale preliminary study conducted in order to evaluate the feasibility of the key s teps in a future, full-scale project.
A pilot study is an initial run-through of the procedures to be used in an investigation; it involves selecting a few people and trying out the study on them. It is possible to save time, and in some cases, money, by identifying any flaws in the procedures designed by the researcher.
A pilot study can help the researcher spot any ambiguities (i.e. unusual things) or confusion in the information given to participants or problems with the task devised.
Sometimes the task is too hard, and the researcher may get a floor effect, because none of the participants can score at all or can complete the task – all performances are low.
The opposite effect is a ceiling effect, when the task is so easy that all achieve virtually full marks or top performances and are “hitting the ceiling”.
Research Design
In cross-sectional research , a researcher compares multiple segments of the population at the same time
Sometimes, we want to see how people change over time, as in studies of human development and lifespan. Longitudinal research is a research design in which data-gathering is administered repeatedly over an extended period of time.
In cohort studies , the participants must share a common factor or characteristic such as age, demographic, or occupation. A cohort study is a type of longitudinal study in which researchers monitor and observe a chosen population over an extended period.
Triangulation means using more than one research method to improve the study’s validity.
Reliability
Reliability is a measure of consistency, if a particular measurement is repeated and the same result is obtained then it is described as being reliable.
- Test-retest reliability : assessing the same person on two different occasions which shows the extent to which the test produces the same answers.
- Inter-observer reliability : the extent to which there is an agreement between two or more observers.
Meta-Analysis
A meta-analysis is a systematic review that involves identifying an aim and then searching for research studies that have addressed similar aims/hypotheses.
This is done by looking through various databases, and then decisions are made about what studies are to be included/excluded.
Strengths: Increases the conclusions’ validity as they’re based on a wider range.
Weaknesses: Research designs in studies can vary, so they are not truly comparable.
Peer Review
A researcher submits an article to a journal. The choice of the journal may be determined by the journal’s audience or prestige.
The journal selects two or more appropriate experts (psychologists working in a similar field) to peer review the article without payment. The peer reviewers assess: the methods and designs used, originality of the findings, the validity of the original research findings and its content, structure and language.
Feedback from the reviewer determines whether the article is accepted. The article may be: Accepted as it is, accepted with revisions, sent back to the author to revise and re-submit or rejected without the possibility of submission.
The editor makes the final decision whether to accept or reject the research report based on the reviewers comments/ recommendations.
Peer review is important because it prevent faulty data from entering the public domain, it provides a way of checking the validity of findings and the quality of the methodology and is used to assess the research rating of university departments.
Peer reviews may be an ideal, whereas in practice there are lots of problems. For example, it slows publication down and may prevent unusual, new work being published. Some reviewers might use it as an opportunity to prevent competing researchers from publishing work.
Some people doubt whether peer review can really prevent the publication of fraudulent research.
The advent of the internet means that a lot of research and academic comment is being published without official peer reviews than before, though systems are evolving on the internet where everyone really has a chance to offer their opinions and police the quality of research.
Types of Data
- Quantitative data is numerical data e.g. reaction time or number of mistakes. It represents how much or how long, how many there are of something. A tally of behavioral categories and closed questions in a questionnaire collect quantitative data.
- Qualitative data is virtually any type of information that can be observed and recorded that is not numerical in nature and can be in the form of written or verbal communication. Open questions in questionnaires and accounts from observational studies collect qualitative data.
- Primary data is first-hand data collected for the purpose of the investigation.
- Secondary data is information that has been collected by someone other than the person who is conducting the research e.g. taken from journals, books or articles.
Validity means how well a piece of research actually measures what it sets out to, or how well it reflects the reality it claims to represent.
Validity is whether the observed effect is genuine and represents what is actually out there in the world.
- Concurrent validity is the extent to which a psychological measure relates to an existing similar measure and obtains close results. For example, a new intelligence test compared to an established test.
- Face validity : does the test measure what it’s supposed to measure ‘on the face of it’. This is done by ‘eyeballing’ the measuring or by passing it to an expert to check.
- Ecological validit y is the extent to which findings from a research study can be generalized to other settings / real life.
- Temporal validity is the extent to which findings from a research study can be generalized to other historical times.
Features of Science
- Paradigm – A set of shared assumptions and agreed methods within a scientific discipline.
- Paradigm shift – The result of the scientific revolution: a significant change in the dominant unifying theory within a scientific discipline.
- Objectivity – When all sources of personal bias are minimised so not to distort or influence the research process.
- Empirical method – Scientific approaches that are based on the gathering of evidence through direct observation and experience.
- Replicability – The extent to which scientific procedures and findings can be repeated by other researchers.
- Falsifiability – The principle that a theory cannot be considered scientific unless it admits the possibility of being proved untrue.
Statistical Testing
A significant result is one where there is a low probability that chance factors were responsible for any observed difference, correlation, or association in the variables tested.
If our test is significant, we can reject our null hypothesis and accept our alternative hypothesis.
If our test is not significant, we can accept our null hypothesis and reject our alternative hypothesis. A null hypothesis is a statement of no effect.
In Psychology, we use p < 0.05 (as it strikes a balance between making a type I and II error) but p < 0.01 is used in tests that could cause harm like introducing a new drug.
A type I error is when the null hypothesis is rejected when it should have been accepted (happens when a lenient significance level is used, an error of optimism).
A type II error is when the null hypothesis is accepted when it should have been rejected (happens when a stringent significance level is used, an error of pessimism).
Ethical Issues
- Informed consent is when participants are able to make an informed judgment about whether to take part. It causes them to guess the aims of the study and change their behavior.
- To deal with it, we can gain presumptive consent or ask them to formally indicate their agreement to participate but it may invalidate the purpose of the study and it is not guaranteed that the participants would understand.
- Deception should only be used when it is approved by an ethics committee, as it involves deliberately misleading or withholding information. Participants should be fully debriefed after the study but debriefing can’t turn the clock back.
- All participants should be informed at the beginning that they have the right to withdraw if they ever feel distressed or uncomfortable.
- It causes bias as the ones that stayed are obedient and some may not withdraw as they may have been given incentives or feel like they’re spoiling the study. Researchers can offer the right to withdraw data after participation.
- Participants should all have protection from harm . The researcher should avoid risks greater than those experienced in everyday life and they should stop the study if any harm is suspected. However, the harm may not be apparent at the time of the study.
- Confidentiality concerns the communication of personal information. The researchers should not record any names but use numbers or false names though it may not be possible as it is sometimes possible to work out who the researchers were.
Main Navigation
/prod01/channel_8/media/scu-dep/current-students/images/Coffs-harbour_student-group_20220616_33.jpg "research methods in report")
- Accept offer and enrol
- Current Students
Personalise your experience
Did you mean..., diploma of arts and social sciences, art/science collaboration wins waterhouse natural science art prize, unit of study scin4003 scientific research context, perspective and methods 2 (2025).
Future students: T: 1800 626 481 E: Email your enquiry here
Current students: Contact: Faculty of Science and Engineering
Students studying at an education collaboration: Please contact your relevant institution
updated - DO NOT REMOVE THIS LINE 6:05 AM on Fri, 12 April
Show me unit information for year
Unit snapshot, credit points, faculty & college.
Faculty of Science and Engineering
Co-requisites
Students must have either completed, or enrol concurrently in, SCIN4002 - Scientific Research Context, Perspective and Methods 1
Unit description
Introduces science Honours students to the range of theoretical frameworks which may inform different types of scientific research and to the methods and methodologies which may be employed in the scientific research process. Encourages students to acquire the skills necessary to carry out, produce and report well designed and articulated research proposals and projects.
Unit content
Orientation: the nature of research; types of research.
The processes of developing a research project: planning and design; identifying the scope and range of a research project; the research design; research methods; formulating research questions; articulating research aims; the ethics of research.
Writing a research proposal: identification and articulation of theoretical frameworks and knowledge gaps relevant to your topic; literature reviews, identification and articulation of methodology; writing the text; citation and referencing; articulating expected outcomes; budget justification.
Introduction to research dissemination skills (scientific writing).
Availabilities
Learning outcomes.
Unit Learning Outcomes express learning achievement in terms of what a student should know, understand and be able to do on completion of a unit. These outcomes are aligned with the graduate attributes . The unit learning outcomes and graduate attributes are also the basis of evaluating prior learning.
On completion of this unit, students should be able to:
critically evaluate techniques and methods used in scientific research
demonstrate awareness of current scientific issues and methods
integrate scientific and management concepts and theories
develop a well designed and articulated research proposal including project summary, project description and budget.
Teaching and assessment
Gold coast (term), lismore (term), national marine science centre coffs harbour (term), online (term), prescribed learning resources, summer term.
- Prescribed text information is not currently available.
- Prescribed resources/equipment information is not currently available.
Prescribed Learning Resources may change in future Teaching Periods.
Fee information
Commonwealth Supported courses For information regarding Student Contribution Amounts please visit the Student Contribution Amounts .
Fee paying courses For postgraduate or undergraduate full-fee paying courses please check Domestic Postgraduate Fees OR Domestic Undergraduate Fees .
International
Please check the international course and fee list to determine the relevant fees.
Courses that offer this unit
Bachelor of science with honours (2025), bachelor of science with honours (2024), any questions we'd love to help.
This paper is in the following e-collection/theme issue:
Published on 11.4.2024 in Vol 26 (2024)
Evaluating the Digital Health Experience for Patients in Primary Care: Mixed Methods Study
Authors of this article:
Original Paper
- Melinda Ada Choy 1, 2 , BMed, MMed, DCH, MD ;
- Kathleen O'Brien 1 , BSc, GDipStats, MBBS, DCH ;
- Katelyn Barnes 1, 2 , BAPSC, MND, PhD ;
- Elizabeth Ann Sturgiss 3 , BMed, MPH, MForensMed, PhD ;
- Elizabeth Rieger 1 , BA, MClinPsych, PhD ;
- Kirsty Douglas 1, 2 , MBBS, DipRACOG, Grad Cert HE, MD
1 School of Medicine and Psychology, College of Health and Medicine, The Australian National University, Canberra, Australia
2 Academic Unit of General Practice, Office of Professional Leadership and Education, ACT Health Directorate, Canberra, Australia
3 School of Primary and Allied Health Care, Monash University, Melbourne, Australia
Corresponding Author:
Melinda Ada Choy, BMed, MMed, DCH, MD
School of Medicine and Psychology
College of Health and Medicine
The Australian National University
Phone: 61 51244947
Email: [email protected]
Background: The digital health divide for socioeconomic disadvantage describes a pattern in which patients considered socioeconomically disadvantaged, who are already marginalized through reduced access to face-to-face health care, are additionally hindered through less access to patient-initiated digital health. A comprehensive understanding of how patients with socioeconomic disadvantage access and experience digital health is essential for improving the digital health divide. Primary care patients, especially those with chronic disease, have experience of the stages of initial help seeking and self-management of their health, which renders them a key demographic for research on patient-initiated digital health access.
Objective: This study aims to provide comprehensive primary mixed methods data on the patient experience of barriers to digital health access, with a focus on the digital health divide.
Methods: We applied an exploratory mixed methods design to ensure that our survey was primarily shaped by the experiences of our interviewees. First, we qualitatively explored the experience of digital health for 19 patients with socioeconomic disadvantage and chronic disease and second, we quantitatively measured some of these findings by designing and administering a survey to 487 Australian general practice patients from 24 general practices.
Results: In our qualitative first phase, the key barriers found to accessing digital health included (1) strong patient preference for human-based health services; (2) low trust in digital health services; (3) high financial costs of necessary tools, maintenance, and repairs; (4) poor publicly available internet access options; (5) reduced capacity to engage due to increased life pressures; and (6) low self-efficacy and confidence in using digital health. In our quantitative second phase, 31% (151/487) of the survey participants were found to have never used a form of digital health, while 10.7% (52/487) were low- to medium-frequency users and 48.5% (236/487) were high-frequency users. High-frequency users were more likely to be interested in digital health and had higher self-efficacy. Low-frequency users were more likely to report difficulty affording the financial costs needed for digital access.
Conclusions: While general digital interest, financial cost, and digital health literacy and empowerment are clear factors in digital health access in a broad primary care population, the digital health divide is also facilitated in part by a stepped series of complex and cumulative barriers. Genuinely improving digital health access for 1 cohort or even 1 person requires a series of multiple different interventions tailored to specific sequential barriers. Within primary care, patient-centered care that continues to recognize the complex individual needs of, and barriers facing, each patient should be part of addressing the digital health divide.
Introduction
The promise of ehealth.
The rapid growth of digital health, sped up by the COVID-19 pandemic and associated lockdowns, brings the promise of improved health care efficiency, empowerment of consumers, and health care equity [ 1 ]. Digital health is the use of information and communication technology to improve health [ 2 ]. eHealth, which is a type of digital health, refers to the use of internet-based technology for health care and can be used by systems, providers, and patients [ 2 ]. At the time of this study (before COVID-19), examples of eHealth used by patients in Australia included searching for web-based health information, booking appointments on the web, participating in online peer-support health forums, using mobile phone health apps (mobile health), emailing health care providers, and patient portals for electronic health records.
Digital health is expected to improve chronic disease management and has already shown great potential in improving chronic disease health outcomes [ 3 , 4 ]. Just under half of the Australian population (47.3%) has at least 1 chronic disease [ 5 ]. Rates of chronic disease and complications from chronic disease are overrepresented among those with socioeconomic disadvantage [ 6 ]. Therefore, patients with chronic disease and socioeconomic disadvantage have a greater need for the potential benefits of digital health, such as an improvement in their health outcomes. However, there is a risk that those who could benefit most from digital health services are the least likely to receive them, exemplifying the inverse care law in the digital age by Hart [ 7 ].
Our Current Understanding of the Digital Health Divide
While the rapid growth of digital health brings the promise of health care equity, it may also intensify existing inequities [ 8 ]. The digital health divide for socioeconomic disadvantage describes a pattern in which patients considered socioeconomically disadvantaged who are already marginalized through poor access to traditional health care are additionally hindered through poor access to digital health [ 9 ]. In Australia, only 67.4% of households in the lowest household income quintile have home internet access, compared to 86% of the general population and 96.9% of households in the highest household income quintile [ 10 ]. Survey-based studies have also shown that even with internet access, effective eHealth use is lower in populations considered disadvantaged, which speaks to broader barriers to digital health access [ 11 ].
The ongoing COVID-19 global pandemic has sped up digital health transitions with the rapid uptake of telephone and video consultations, e-prescription, and the ongoing rollout of e-mental health in Australia. These have supported the continuation of health care delivery while limiting physical contact and the pandemic spread; however, the early evidence shows that the digital health divide remains problematic. A rapid review identified challenges with reduced digital access and digital literacy among the older adults and racial and ethnic minority groups, which are both groups at greater health risk from COVID-19 infections [ 12 ]. An Australian population study showed that the rapid uptake of telehealth during peak pandemic was not uniform, with the older adults, very young, and those with limited English language proficiency having a lower uptake of general practitioner (GP) telehealth services [ 13 ].
To ensure that digital health improves health care outcome gaps, it is essential to better understand the nature and nuance of the digital health divide for socioeconomic disadvantage. The nature of the digital health divide for socioeconomic disadvantage has been explored primarily through quantitative survey data, some qualitative papers, a few mixed methods papers, and systematic reviews [ 11 , 14 - 16 ]. Identified barriers include a lack of physical hardware and adequate internet bandwidth, a reduced inclination to seek out digital health, and a low ability and confidence to use digital health effectively [ 16 ]. The few mixed methods studies that exist on the digital health divide generally triangulate quantitative and qualitative data on a specific disease type or population subgroup to draw a combined conclusion [ 17 , 18 ]. These studies have found digital health access to be associated with education, ethnicity, and gender as well as trust, complementary face-to-face services, and the desire for alternative sources of information [ 17 , 19 ].
What This Work Adds
This project sought to extend previous research by using an exploratory mixed methods design to ensure that the first step and driver of our survey of a larger population was primarily shaped by the experiences of our interviewees within primary care. This differs from the triangulation method, which places the qualitative and quantitative data as equal first contributors to the findings and does not allow one type of data to determine the direction of the other [ 18 ]. We qualitatively explored the experience of digital health for patients with socioeconomic disadvantage and chronic disease and then quantitatively measured some of the qualitative findings via a survey of the Australian general practice patient population. Our key objective was to provide comprehensive primary mixed methods data, describing the experience and extent of barriers to accessing digital health and its benefits, with a focus on the digital health divide. We completed this research in a primary care context to investigate a diverse community-based population with conceivable reasons to seek digital help in managing their health. Findings from this mixed methods study were intended to provide health care providers and policy makers with a more detailed understanding of how specific barriers affect different aspects or steps of accessing digital health. Ultimately, understanding digital health access can influence the future design and implementation of digital health services by more effectively avoiding certain barriers or building in enablers to achieve improved digital health access not only for everyone but also especially for those in need.
Study Design
We conducted a sequential exploratory mixed methods study to explore a complex phenomenon in depth and then measure its prevalence. We qualitatively explored the experience of digital health for patients with chronic disease and socioeconomic disadvantage in the first phase. Data from the first phase informed a quantitative survey of the phenomenon across a wider population in the second phase [ 18 ]. Both stages of research were conducted before the COVID-19 pandemic in Australia.
Recruitment
Qualitative phase participants.
The eligibility criteria for the qualitative phase were as follows: English-speaking adults aged ≥18 years with at least 1 self-reported chronic disease and 1 marker of socioeconomic disadvantage (indicated by ownership of a Health Care Card or receiving a disability pension, unemployment, or a user of public housing). A chronic disease was defined to potential participants as a diagnosed long-term health condition that had lasted at least 6 months (or is expected to last for at least 6 months; examples are listed in Multimedia Appendix 1 ). The markers of socioeconomic disadvantage we used to identify potential participants were based on criteria typically used by local general practices to determine which patients can have lower or no out-of-pocket expenses. Apart from unemployment, the 3 other criteria to identify socioeconomic disadvantage are means-tested government-allocated public social services [ 20 ]. Qualitative phase participants were recruited from May to July 2019 through 3 general practices and 1 service organization that serve populations considered socioeconomically disadvantaged across urban, regional, and rural regions in the Australian Capital Territory and South Eastern New South Wales. A total of 2 recruitment methods were used in consultation with and as per the choice of the participating organizations. Potential participants were either provided with an opportunity to engage with researchers (KB and MAC) in the general practice waiting room or identified by the practice or organization as suitable for an interview. Interested participants were given a detailed verbal and written description of the project in a private space before providing written consent to be interviewed. All interview participants received an Aus $50 (US $32.68) grocery shopping voucher in acknowledgment of their time.
Quantitative Phase Participants
Eligibility for the quantitative phase was English-speaking adults aged ≥18 years. The eligibility criteria for the quantitative phase were deliberately broader than those for the qualitative phase to achieve a larger sample size within the limitations of recruitment and with the intention that the factors of socioeconomic disadvantage and having a chronic disease could be compared to the digital health access of a more general population. The quantitative phase participants were recruited from November 2019 to February 2020. Study information and paper-based surveys were distributed and collected through 24 general practices across the Australian Capital Territory and South Eastern New South Wales regions, with an option for web-based completion.
Ethical Considerations
Qualitative and quantitative phase research protocols, including the participant information sheet, were approved by the Australian Capital Territory Health Human Research Ethics Committee (2019/ETH/00013) and the Australian National University Human Research Ethics Committee (2019/ETH00003). Qualitative phase participants were given a verbal and written explanation of the study, including how and when they could opt out, before they provided written consent. All interview participants received an Aus $50 (US $32.68) grocery shopping voucher in acknowledgment of their time. Quantitative participants were given a written explanation and their informed consent was implied by return of a completed survey. Participants in both phases of the study were told that all their data was deidentified. Consent was implied through the return of a completed survey.
Qualitative Data Collection and Analysis
Participants were purposively sampled to represent a range in age, gender, degree of socioeconomic disadvantage, and experience of digital health. The sampling and sample size were reviewed regularly by the research team as the interviews were being completed to identify potential thematic saturation.
The interview guide was developed by the research team based on a review of the literature and the patient dimensions of the framework of access by Levesque et al [ 21 ]. The framework by Levesque et al [ 21 ] is a conceptualization of health care access comprising 5 service and patient dimensions of accessibility and ability. The patient dimensions are as follows: (1) ability to perceive, (2) ability to seek, (3) ability to reach, (4) ability to pay, and (5) ability to engage [ 21 ]. The key interview topics included (1) digital health use and access, including facilitators and barriers; (2) attitudes toward digital health; and (3) self-perception of digital health skills and potential training. The interview guide was reviewed for face and content validity by the whole research team, a patient advocate, a digital inclusion charity representative, and the general practices where recruitment occurred. The questions and guide were iteratively refined by the research team to ensure relevance and support reaching data saturation. The interview guide has been provided as Multimedia Appendix 1 . The interviews, which took 45 minutes on average, were taped and transcribed. An interview summary sheet and reflective journal were completed by the interviewer after each interview to also capture nonverbal cues and tone.
Interview transcriptions were coded and processed by inductive thematic analysis. Data collection and analysis were completed in parallel to support the identification of data saturation. Data saturation was defined as no significant new information arising from new interviews and was identified by discussion with the research team [ 22 ]. The 2 interviewers (MAC and KB) independently coded the first 5 transcripts and reflected on them with another researcher (EAS) to ensure intercoder validity and reliability. The rest of the interviews were coded independently by the 2 interviewers, who regularly met to reflect on emerging themes and thematic saturation. Data saturation was initially indicated after 15 interviews and subsequently confirmed with a total of 19 interviews. Coding disagreements and theme development were discussed with at least 1 other researcher (EAS, ER, and KD). Thematic saturation and the final themes were agreed upon by the entire research team.
Quantitative Survey Development
The final themes derived in the qualitative phase of the project guided the specific quantitative phase research questions. The final themes were a list of ordered cumulative barriers experienced by participants in accessing digital health and its benefits ( Figure 1 ). The quantitative survey was designed to test the association between barriers to access and the frequency of use of digital health as a proxy measure for digital health access.

In the survey, the participants were asked about their demographic details, health and chronic diseases, knowledge, use and experience of digital health tools, internet access, perception of digital resource affordability, trust in digital health and traditional health services, perceived capability, health care empowerment, eHealth literacy, and relationship with their GP.
Existing scales and questions from the literature and standardized Australian-based surveys were used whenever possible. We used selected questions and scales from the Australian Bureau of Statistics standards, the eHealth Literacy Scale (eHEALS), the eHealth Literacy Questionnaire, and the Southgate Institute for Health Society and Equity [ 17 , 23 - 26 ]. We adapted other scales from the ICEpop Capability Measure for Adults, the Health Care Empowerment Inventory (HCEI), the Patient-Doctor Relationship Questionnaire, and the Chao continuity questionnaire [ 23 , 27 - 29 ]. Where an existing scale to measure a barrier or theme did not exist, the research team designed the questions based on the literature. Our questions around the frequency of digital health use were informed by multiple existing Australian-based surveys on general technology use [ 30 , 31 ]. Most of the questions used a Likert scale. Every choice regarding the design, adaptation, or copy of questions for the survey was influenced by the qualitative findings and decided on by full agreement among the 2 researchers who completed and coded the interviews. A complete copy of the survey is provided in Multimedia Appendix 2 .
Pilot-testing of the survey was completed with 5 patients, 2 experts on digital inclusion, and 3 local GPs for both the paper surveys and web-based surveys via Qualtrics Core XM (Qualtrics LLC). The resulting feedback on face and content validity, functionality of the survey logic, and feasibility of questionnaire completion was incorporated into the final version of the survey.
The survey was offered on paper with a participant information sheet, which gave the patients the option to complete the web-based survey. The survey was handed out to every patient on paper to avoid sampling bias through the exclusion of participants who could not complete the web-based survey [ 32 ].
Quantitative Data Treatment and Analysis
Data were exported from Qualtrics Core XM to an SPSS (version 26; IBM Corp) data set. Data cleaning and screening were undertaken (KB and KO).
Descriptive statistics (number and percentage) were used to summarize participant characteristics, preference measures, and frequency of eHealth use. Significance testing was conducted using chi-square tests, with a threshold of P <.05; effect sizes were measured by the φ coefficient for 2×2 comparisons and Cramer V statistic for all others. Where the cells sizes were too small, the categories were collapsed for the purposes of significance testing. The interpretation of effect sizes was as per the study by Cohen [ 33 ]. The analysis was conducted in SPSS and SAS (version 9.4; SAS Institute).
Participant Characteristics
Participants’ self-reported characteristics included gender, indigenous status, income category, highest level of education, marital status, and language spoken at home.
Age was derived from participant-reported year of birth and year of survey completion as of 2019 and stratified into age groups. The state or territory of residence was derived from the participant-reported postcode. The remoteness area was derived using the postcode reported by the participants and mapped to a modified concordance from the Australian Bureau of Statistics. Occupation-free text responses were coded using the Australian Bureau of Statistics Census statistics level 1 and 2 descriptors. The country of birth was mapped to Australia, other Organisation for Economic Cooperation and Development countries, and non–Organisation for Economic Cooperation and Development countries.
Frequency of eHealth Use
A summary measure of the frequency of eHealth use was derived from the questions on the use of different types of eHealth.
Specifically, respondents were asked if they had ever used any form of web-based health (“eHealth“) and, if so, to rate how often (never, at least once, every now and then, and most days) against 6 types of “eHealth” (searching for health information online, booking appointments online, emailing health care providers, using health-related mobile phone apps, accessing My Health Record, and accessing online health forums). The frequency of eHealth use was then classified as follows:
- High user: answered “most days” to at least 1 question on eHealth use OR answered “every now and then” to at least 2 questions on eHealth use
- Never user: answered “no” to having ever used any form of eHealth OR “never” to all 6 questions on eHealth use
- Low or medium user: all other respondents.
The frequency of eHealth use was reported as unweighted descriptive statistics (counts and percentages) against demographic characteristics and for the elements of each of the themes identified in phase 1.
Overview of Key Themes
Data were reported against the 6 themes from the phase 1 results of preference, trust, cost, structural access, capacity to engage, and self-efficacy. Where the components of trust, cost, capacity to engage, and self-efficacy had missing data (for less than half of the components only), mean imputation was used to minimize data loss. For each theme, the analysis excluded those for whom the frequency of eHealth use was unknown.
Preference measures (survey section D1 parts 1 to 3) asked participants to report against measures with a 4-point Likert scale (strongly disagree, disagree, agree, and strongly agree). Chi-square tests were conducted after the categories were condensed into 2 by combining strongly disagree and as well as combining strongly agree and agree.
Summary measures for trust were created in 4 domains: trust from the eHealth Literacy Questionnaire (survey section D1 parts 4 to 8), trust from Southgate—GPs, specialists, or allied health (survey section D2 parts 1 to 5), trust from Southgate—digital health (survey section D2 parts 6, 7, 9, and 10), and trust from Southgate—books or pamphlets (survey section D2 part 8). The data were grouped as low, moderate, and high trust based on the assigned scores from the component data. Chi-square tests were conducted comparing low-to-moderate trust against high trust for GP, specialists, or allied health and comparing low trust against moderate-to-high trust for book or pamphlet.
Summary measures for cost were created from survey item C10. To measure cost, participants were asked about whether they considered certain items or services to be affordable. These included cost items mentioned in the qualitative phase interviews relating to mobile phones (1 that connects to the internet, 1 with enough memory space to download apps, downloads or apps requiring payment, repairs, and maintenance costs), having an iPad or tablet with internet connectivity, a home computer or laptop (owning, repairs, and maintenance), home fixed internet access, and an adequate monthly data allowance. These 9 items were scored as “yes definitely”=1 or 0 otherwise. Chi-square tests were conducted with never and low or medium eHealth users combined.
Structural Access
Structural access included asking where the internet is used by participants (survey section C8) and factors relating to internet access (survey section C8 parts 1-3) reporting against a 4-point Likert scale (strongly disagree, disagree, agree, and strongly agree). Chi-square tests were conducted with strongly disagree, disagree, agree, or strongly agree, and never, low, or medium eHealth use combined.
Capacity to Engage
Summary measures for capacity to engage were created from survey section E1. To measure the capacity to engage, participants were asked about feeling “settled and secure,” “being independent,” and “achievement and progress” as an adaptation of the ICEpop Capability Measure for Adults [ 27 ], reporting against a 4-point Likert-like scale. Responses were scored from 1 (“I am unable to feel settled and secure in any areas of my life”) to 4 (“I am able to feel settled and secure in all areas of my life”).
The summary capacity measure was derived by the summation of responses across the 3 questions, which were classified into 4 groups, A to D, based on these scores. Where fewer than half of the responses were missing, mean imputation was used; otherwise, the record was excluded. Groups A and B were combined for significance testing.
Self-Efficacy
Summary measures for self-efficacy were adapted from the eHEALS (E3) and the HCEI (E2) [ 23 , 24 ].
Survey section E3—eHEALS—comprised 8 questions, with participants reporting against a 5-point Likert scale for each (strongly disagree, disagree, neither, agree, and strongly agree). These responses were assigned 1 to 5 points, respectively. The summary eHEALS measure was derived by the summation of responses across the 8 questions, which were classified into 5 groups, A to E, based on these scores. Where fewer than half of the responses were missing, mean imputation was used; otherwise, the record was excluded. Groups A to C and D to E were combined for significance testing.
Survey section E2—HCEI—comprised 5 questions, with participants reporting against a 5-point Likert scale for each (strongly disagree, disagree, neither, agree, and strongly agree). Strongly disagree and disagree and neither were combined, and similarly agree and strongly agree were combined for significance testing.
Qualitative Results
The demographic characteristics of the patients that we interviewed are presented in Table 1 .
The key barriers found to accessing digital health included (1) strong patient preference for human-based health services; (2) low trust in digital health services; (3) high financial costs of necessary tools, maintenance, and repairs; (4) poor publicly available internet access options; (5) reduced capacity to engage due to increased life pressures; and (6) low self-efficacy and confidence in using digital health.
Rather than being an equal list of factors, our interviewees described these barriers as a stepped series of cumulative hurdles, which is illustrated in Figure 1 . Initial issues of preference and trust were foundational to a person even when considering the option of digital health, while digital health confidence and literacy were barriers to full engagement with and optimal use of digital health. Alternatively, interviewees who did use digital health had been enabled by the same factors that were barriers to others.
a GP: general practitioner.
b Multiple answers per respondent.
Strong Patient Preference for Human-Based Health Services
Some patients expressed a strong preference for human-based health services rather than digital health services. In answer to a question about how digital health services could be improved, a patient said the following:
Well, having an option where you can actually bypass actually having to go through the app and actually talk directly to someone. [Participant #10]
For some patients, this preference for human-based health services appeared to be related to a lack of exposure to eHealth. These patients were not at all interested in or had never thought about digital health options. A participant responded the following to the interviewer’s questions:
Interviewer: So when...something feels not right, how do you find out what’s going on?
Respondent: I talk to Doctor XX.
Interviewer: Do you ever Google your symptoms or look online for information?
Respondent: No, I have never even thought of doing that actually. [Participant #11]
For other patients, their preference for human-based health care stemmed from negative experiences with technology. These patients reported actively disliking computers and technology in general and were generally frustrated with what they saw as the pitfalls of technology. A patient stated the following:
If computers and internet weren’t so frigging slow because everything is on like the slowest speed network ever and there’s ads blocking everything. Ads, (expletive) ads. [Participant #9]
A patient felt that he was pushed out of the workforce due his inability to keep up with technology-based changes and thus made a decision to never own a computer:
But, you know, in those days when I was a lot younger those sorts of things weren’t about and they’re just going ahead in leaps and bounds and that’s one of the reasons why I retired early. I retired at 63 because it was just moving too fast and it’s all computers and all those sorts of things and I just couldn’t keep up. [Participant #17]
Low Trust in Digital Health Services
Several patients described low trust levels for digital and internet-based technology in general. Their low trust was generally based on stories they had heard of other people’s negative experiences. A patient said the following:
I don’t trust the internet to be quite honest. You hear all these stories about people getting ripped off and I’ve worked too hard to get what I’ve got rather than let some clown get it on the internet for me. [Participant #11]
Some of this distrust was specific to eHealth. For example, some patients were highly suspicious of the government’s motives with regard to digital health and were concerned about the privacy of their health information, which made them hesitant about the concept of a universal electronic health record. In response to the interviewer’s question, a participant said the following:
Interviewer: Are there any other ways you think that eHealth might help you?
Respondent: I’m sorry but it just keeps coming back to me, Big Brother. [Participant #7]
Another participant said the following:
I just would run a mile from it because I just wouldn’t trust it. It wouldn’t be used to, as I said, for insurance or job information. [Participant #16]
High Financial Costs of the Necessary Tools, Maintenance, and Repairs
A wide variety of patients described affordability issues across several different aspects of the costs involved in digital health. They expressed difficulty in paying for the following items: a mobile phone that could connect to the internet, a mobile phone with enough memory space to download apps, mobile phone apps requiring extra payment without advertisements, mobile phone repair costs such as a broken screen, a computer or laptop, home internet access, and adequate monthly data allowance and speeds to functionally use the internet. Current popular payment systems, such as plans, were not feasible for some patients. A participant stated the following:
I don’t have a computer...I’m not in the income bracket to own a computer really. Like I could, if I got one on a plan kind of thing or if I saved up for x-amount of time. But then like if I was going on the plan I’d be paying interest for having it on like lay-buy kind of thing, paying it off, and if it ever got lost or stolen I would still have to repay that off, which is always a hassle. And yeah. Yeah, I’m like financially not in the state where I’m able to...own a computer right now as I’m kind of paying off a number of debts. [Participant #9]
Poor Publicly Available Internet Access Options
Some patients described struggling without home internet access. While they noted some cost-free public internet access points, such as libraries, hotel bars, and restaurants, they often found these to be inconvenient, lacking in privacy, and constituting low-quality options for digital health. A patient stated the following:
...it’s incredibly slow at the library. And I know why...a friend I went to school with used to belong to the council and the way they set it up, they just got the raw end of the stick and it is really, really slow. It’s bizarre but you can go to the X Hotel and it’s heaps quicker. [Participant #15]
In response to the interviewer's question, a participant said the following:
Interviewer: And do you feel comfortable doing private stuff on computers at the library...?
Respondent: Not really, no, but I don’t have any other choice, so, yeah. [Participant #9]
Reduced Capacity to Engage Due to Increased Life Pressures
When discussing why they were not using digital health or why they had stopped using digital health, patients often described significant competing priorities and life pressures that affected their capacity to engage. An unemployed patient mentioned that his time and energy on the internet were focused primarily on finding work and that he barely had time to focus on his health in general, let alone engage in digital health.
Other patients reported that they often felt that their ability to learn about and spend time on digital health was taken up by caring for sick family members, paying basic bills, or learning English. Some patients said that the time they would have spent learning digital skills when they were growing up had been lost to adverse life circumstances such as being in jail:
So we didn’t have computers in the house when I was growing up. And I didn’t know I’ve never...I’ve been in and out of jail for 28 odd years so it sort of takes away from learning from this cause it’s a whole different… it’s a whole different way of using a telephone from a prison. [Participant #11]
Low Self-Efficacy and Confidence in Starting the Digital Health Process
Some patients had a pervasive self-perception of being slow learners and being unable to use technology. Their stories of being unconfident learners seemed to stem from the fact that they had been told throughout their lives that they were intellectually behind. A patient said the following:
The computer people...wouldn’t take my calls because I’ve always been dumb with that sort of stuff. Like I only found out this later on in life, but I’m actually severely numerically dyslexic. Like I have to triple-check everything with numbers. [Participant #7]
Another patient stated the following:
I like went to two English classes like a normal English class with all the kids and then another English class with about seven kids in there because I just couldn’t I don’t know maybe because I spoke another language at home and they sort of like know I was a bit backward. [Participant #6]
These patients and others had multiple missing pieces of information that they felt made it harder to engage in digital health compared to “easier” human-based services. A patient said the following:
Yeah I’ve heard of booking online but I just I don’t know I find it easier just to ring up. And I’ll answer an email from a health care provider but I wouldn’t know where to start to look for their email address. [Participant #11]
In contrast, the patients who did connect with digital health described themselves as independent question askers and proactive people. Even when they did not know how to use a specific digital health tool, they were confident in attempting to and asking for help when they needed it. A patient said the following:
I’m a “I will find my way through this, no matter how long it takes me” kind of person. So maybe it’s more my personality...If I have to ask for help from somewhere, wherever it is, I will definitely do that. [Participant #3]
Quantitative Results
A total of 487 valid survey responses were received from participants across 24 general practices. The participant characteristics are presented in detail in Table S1 in Multimedia Appendix 3 .
The mean age of the participants was approximately 50 years (females 48.9, SD 19.4 years; males 52.8, SD 20.0 years), and 68.2% (332/487) of the participants identified as female. Overall, 34.3% (151/439) of respondents reported never using eHealth, and 53.8% (236/439) reported high eHealth use.
There were statistically significant ( P <.05) differences in the frequency of eHealth use in terms of age group, gender, state, remoteness, highest level of education, employment status, occupation group, marital status, and language spoken at home, with effect sizes being small to medium. Specifically, high eHealth characteristics were associated with younger age, being female, living in an urban area, and being employed.
Table 2 presents the frequency of eHealth use against 3 internet preference questions.
Preference for using the internet and technology in general and for health needs in particular were significantly related to the frequency of eHealth use ( P <.05 for each), with the effect sizes being small to medium.
a Excludes those for whom frequency of eHealth use is unknown.
b Chi-square tests conducted with strongly disagree and disagree combined, and agree and strongly agree combined.
Table 3 presents the frequency of eHealth use against 4 measures of trust.
The degree of trust was not statistically significantly different for the frequency of eHealth use for any of the domains.
b eHLQ: eHealth Literacy Questionnaire.
c Derived from survey question D1, parts 4 to 8. Mean imputation used where ≤2 responses were missing. If >2 responses were missing, the records were excluded.
d Derived from survey question D2, parts 1 to 5. Mean imputation used where ≤2 responses were missing. If >2 responses were missing, the records were excluded.
e Chi-square test conducted comparing low-to-moderate trust against high trust.
f Derived from survey question D2, parts 6, 7, 9, and 10. Mean imputation used where ≤2 responses were missing. If >2 responses were missing, the records were excluded.
g Derived from survey question D2 part 8.
h Chi-square test conducted comparing low trust against moderate-to-high trust.
Affordability of items and services was reported as No cost difficulty or Cost difficulty. eHealth frequency of use responses were available for 273 participants; among those with no cost difficulty , 1% (2/204) were never users, 14.2% (29/204) were low or medium users, and 84.8% (173/204) were high users of eHealth; among those with cost difficulty , 1% (1/69) were never users, 26% (18/69) were low or medium users, and 73% (50/69) were high users. There was a statistically significant difference in the presence of cost as a barrier between never and low or medium eHealth users compared to high users ( χ 2 1 =5.25; P =.02), although the effect size was small.
Table 4 presents the frequency of eHealth use for elements of structural access.
Quality of internet access and feeling limited in access to the internet were significantly associated with frequency of eHealth use ( P <.05), although the effect sizes were small.
b N/A: not applicable (cell sizes insufficient for chi-square test).
c Chi-square tests conducted with strongly disagree and disagree combined, agree and strongly agree combined, and never and low or medium categories combined.
Table 5 presents the frequency of eHealth use against respondents’ capacity to engage.
Capacity to engage was not significantly different for the frequency of eHealth use ( P =.54).
b Derived from survey item E1. Where 1 response was missing, the mean imputation was used. If >1 response was missing, the record was excluded.
c Chi-square tests conducted with groups A and B combined.
Table 6 presents the frequency of eHealth use for elements of self-efficacy.
Statistically significant results were observed for the relationship between self-efficacy by eHEALS (moderate effect size) and frequency of eHealth use as well as for some of the questions from the HCEI (reliance on health professionals or others to access and explain information; small effect size; P <.05).
b eHEALS: eHealth Literacy Scale.
c eHEALS derived from item E3 (8 parts). Where ≤ 4 responses were missing, mean imputation was used. If >4 responses were missing, the records were excluded. Groups A to C as well as groups D to E were combined for the chi-square test.
d Strongly disagree, disagree, neither, and agree or strongly agree combined for significance testing.
Principal Findings
This paper reports on the findings of a sequential exploratory mixed methods study on the barriers to digital health access for a group of patients in Australian family medicine, with a particular focus on chronic disease and socioeconomic disadvantage.
In the qualitative first phase, the patients with socioeconomic disadvantage and chronic disease described 6 cumulative barriers, as demonstrated in Figure 1 . Many nonusers of digital health preferred human-based services and were not interested in technology, while others were highly suspicious of the technology in general. Some digitally interested patients could not afford quality hardware and internet connectivity, a barrier that was doubled by low quality and privacy when accessing publicly available internet connections. Furthermore, although some digitally interested patients had internet access, their urgent life circumstances left scarce opportunity to access digital health and develop digital health skills and confidence.
In our quantitative second phase, 31% (151/487) of the survey participants from Australian general practices were found to have never used a form of digital health. Survey participants were more likely to use digital health tools frequently when they also had a general digital interest and a digital health interest. Those who did not frequently access digital health were more likely to report difficulty affording the financial costs needed for digital access. The survey participants who frequently accessed digital health were more likely to have high eHealth literacy and high levels of patient empowerment.
Comparison With Prior Work
In terms of general digital health access, the finding that 31% (151/487) of the survey participants had never used one of the described forms of eHealth is in keeping with an Australian-based general digital participation study that found that approximately 9% of the participants were nonusers and 17% rarely engaged with the internet at all [ 34 ]. With regard to the digital health divide, another Australian-based digital health divide study found that increased age, living in a lower socioeconomic area, being Aboriginal or Torres Strait Islander, being male, and having no tertiary education were factors negatively associated with access to digital health services [ 17 ]. Their findings correspond to our findings that higher-frequency users of eHealth were associated with younger age, being female, living in an urban area, and being employed. Both studies reinforce the evidence of the digital health divide based on gender, age, and socioeconomic disadvantage in Australia.
With regard to digital health barriers, our findings provide expanded details on the range of digital health items and services that present a cost barrier to consumers. Affordability is a known factor in digital access and digital health access, and it is measured often by general self-report or relative expenditure on internet access to income [ 30 ]. Our study revealed the comprehensive list of relevant costs for patients. Our study also demonstrated factors of cost affordability beyond the dollar value of an item, as interviewees described the struggle of using slow public internet access without privacy features and the risks involved in buying a computer in installments. When we reflected on the complexity and detail of the cost barrier in our survey, participants demonstrated a clear association between cost and the frequency of digital health use. This suggests that a way to improve digital health access for some people is to improve the quality, security, and accessibility of public internet access options as well as to provide free or subsidized hardware, internet connection, and maintenance options for those in need, work that is being done by at least 1 digital inclusion charity in the United Kingdom [ 35 ].
Many studies recognize the factors of eHealth literacy and digital confidence for beneficial digital health access [ 36 ]. Our interviews demonstrated that some patients with socioeconomic disadvantage have low digital confidence, but that this is often underlined by a socially reinforced lifelong low self-confidence in their intellectual ability. In contrast, active users, regardless of other demographic factors, described themselves as innately proactive question askers. This was reinforced by our finding of a relationship between health care empowerment and the frequency of eHealth use. This suggests that while digital health education and eHealth literacy programs can improve access for some patients, broader and deeper long-term solutions addressing socioeconomic drivers of digital exclusion are needed to improve digital health access for some patients with socioeconomic disadvantage [ 8 ]. The deep permeation of socially enforced low self-confidence and lifelong poverty experienced by some interviewees demonstrate that the provision of free hardware and a class on digital health skills can be, for some, a superficial offering when the key underlying factor is persistent general socioeconomic inequality.
The digital health divide literature tends to identify the digital health divide, the factors and barriers that contribute to it, and the potential for it to widen if not specifically addressed [ 16 ]. Our findings have also identified the divide and the barriers, but what this study adds through our qualitative phase in particular is a description of the complex interaction of those barriers and the stepped nature of some of those barriers as part of the individual’s experience in trying to access digital health.
Strengths and Limitations
A key strength of this study is the use of a sequential exploratory mixed methods design. The initial qualitative phase guided a phenomenological exploration of digital health access experiences for patients with chronic disease and socioeconomic disadvantage. Our results in both study phases stem from the patients’ real-life experiences of digital health access. While some of our results echo the findings of other survey-based studies on general digital and digital health participation, our method revealed a greater depth and detail of some of these barriers, as demonstrated in how our findings compare to prior work.
As mentioned previously, the emphasis of this study on the qualitative first phase is a strength that helped describe the interactions between different barriers. The interviewees described their experiences as cumulative unequal stepped barriers rather than as producing a nonordered list of equal barriers. These findings expand on the known complexity of the issue of digital exclusion and add weight to the understanding that improving digital health access needs diverse, complex solutions [ 17 ]. There is no panacea for every individual’s digital health access, and thus, patient-centered digital health services, often guided by health professionals within the continuity of primary care, are also required to address the digital health divide [ 37 ].
While the sequential exploratory design is a strength of the study, it also created some limitations for the second quantitative phase. Our commitment to using the qualitative interview findings to inform the survey questions meant that we were unable to use previously validated scales for every question and that our results were less likely to lead to a normal distribution. This likely affected our ability to demonstrate significant associations for some barriers. We expect that further modeling is required to control for baseline characteristics and determine barrier patterns for different types of users.
One strength of this study is that the survey was administered to a broad population of Australian family medicine patients with diverse patterns of health via both paper-based and digital options. Many other digital health studies use solely digital surveys, which can affect the sample. However, we cannot draw conclusions from our survey about patients with chronic disease due to the limitations of the sample size for these subgroups.
Another sample-based limitation of this study was that our qualitative population did not include anyone aged from 18 to 24 years, despite multiple efforts to recruit. Future research will hopefully address this demographic more specifically.
While not strictly a limitation, we recognize that because this research was before COVID-19, it did not include questions about telehealth, which has become much more mainstream in recent years. The patients may also have changed their frequency of eHealth use because of COVID-19 and an increased reliance on digital services in general. Future work in this area or future versions of this survey should include telehealth and acknowledge the impact of COVID-19. However, the larger concept of the digital health divide exists before and after COVID-19, and in fact, our widespread increased reliance on digital services makes the digital divide an even more pressing issue [ 12 ].
Conclusions
The experience of digital health access across Australian primary care is highly variable and more difficult to access for those with socioeconomic disadvantage. While general digital interest, financial cost, and digital health literacy and empowerment are clear factors in digital health access in a broad primary care population, the digital health divide is also facilitated in part by a stepped series of complex and cumulative barriers.
Genuinely improving digital health access for 1 cohort or even 1 person requires a series of multiple different interventions tailored to specific sequential barriers. Given the rapid expansion of digital health during the global COVID-19 pandemic, attention to these issues is necessary if we are to avoid entrenching inequities in access to health care. Within primary care, patient-centered care that continues to recognize the complex individual needs of, and barriers facing, each patient should be a part of addressing the digital health divide.
Acknowledgments
The authors are thankful to the patients who shared their experiences with them via interview and survey completion. The authors are also very grateful to the general practices in the Australian Capital Territory and New South Wales who kindly gave their time and effort to help organize interviews, administer, and post surveys in the midst of the stress of day-to-day practice life and the bushfires of 2018-2019. The authors thank and acknowledge the creators of the eHealth Literacy Scale, the eHealth Literacy Questionnaire, the ICEpop Capability Measure for Adults, the Health Care Empowerment Inventory, the Patient-Doctor Relationship Questionnaire, the Chao continuity questionnaire, and the Southgate Institute for Health Society and Equity for their generosity in sharing their work with the authors [ 17 , 19 - 25 ]. This study would not have been possible without the support of the administrative team of the Academic Unit of General Practice. This project was funded by the Royal Australian College of General Practitioners (RACGP) through the RACGP Foundation IPN Medical Centres Grant, and the authors gratefully acknowledge their support.
Data Availability
The data sets generated during this study are not publicly available due to the nature of our original ethics approval but are available from the corresponding author on reasonable request.
Authors' Contributions
MAC acquired the funding, conceptualized the project, and organized interview recruitment. MAC and KB conducted interviews and analyzed the qualitative data. EAS, ER, and KD contributed to project planning, supervision and qualitative data analysis. MAC, KB and KO wrote the survey and planned quantitative data analysis. MAC and KB recruited practices for survey administration. KO and KB conducted the quantitative data analysis. MAC and KO, with KB drafted the paper. EAS, ER, and KD helped with reviewing and editing the paper.
Conflicts of Interest
None declared.
Phase 1 interview guide.
Phase 2 survey: eHealth and digital divide.
Phase 2 participant characteristics by frequency of eHealth use.
- Eysenbach G. What is e-health? J Med Internet Res. 2001;3(2):E20. [ FREE Full text ] [ CrossRef ] [ Medline ]
- Iyawa GE, Herselman M, Botha A. Digital health innovation ecosystems: from systematic literature review to conceptual framework. Procedia Comput Sci. 2016;100:244-252. [ FREE Full text ] [ CrossRef ]
- Berrouiguet S, Baca-García E, Brandt S, Walter M, Courtet P. Fundamentals for future mobile-health (mHealth): a systematic review of mobile phone and web-based text messaging in mental health. J Med Internet Res. Jun 10, 2016;18(6):e135. [ FREE Full text ] [ CrossRef ] [ Medline ]
- Shen H, van der Kleij RM, van der Boog PJ, Chang X, Chavannes NH. Electronic health self-management interventions for patients with chronic kidney disease: systematic review of quantitative and qualitative evidence. J Med Internet Res. Nov 05, 2019;21(11):e12384. [ FREE Full text ] [ CrossRef ] [ Medline ]
- Australia's health 2018. Australian Institute of Health and Welfare. 2018. URL: https://www.aihw.gov.au/reports/australias-health/australias-health-2018/contents/table-of-contents [accessed 2024-04-04]
- Australian Institute of Health and Welfare. Chronic Diseases and Associated Risk Factors in Australia, 2006. Canberra, Australia. Australian Institute of Health and Welfare; 2006.
- Hart JT. The inverse care law. The Lancet. Feb 27, 1971;297(7696):405-412. [ CrossRef ]
- Davies AR, Honeyman M, Gann B. Addressing the digital inverse care law in the time of COVID-19: potential for digital technology to exacerbate or mitigate health inequalities. J Med Internet Res. Apr 07, 2021;23(4):e21726. [ FREE Full text ] [ CrossRef ] [ Medline ]
- Choi NG, Dinitto DM. The digital divide among low-income homebound older adults: internet use patterns, eHealth literacy, and attitudes toward computer/internet use. J Med Internet Res. May 02, 2013;15(5):e93. [ FREE Full text ] [ CrossRef ] [ Medline ]
- Household use of information technology. Australian Bureau of Statistics. 2018. URL: https://tinyurl.com/4efm6u92 [accessed 2024-03-24]
- Kontos E, Blake KD, Chou WY, Prestin A. Predictors of eHealth usage: insights on the digital divide from the health information national trends survey 2012. J Med Internet Res. Jul 16, 2014;16(7):e172. [ FREE Full text ] [ CrossRef ] [ Medline ]
- Litchfield I, Shukla D, Greenfield S. Impact of COVID-19 on the digital divide: a rapid review. BMJ Open. Oct 12, 2021;11(10):e053440. [ FREE Full text ] [ CrossRef ] [ Medline ]
- Butler DC, Joshy G, Douglas KA, Sayeed MS, Welsh J, Douglas A, et al. Changes in general practice use and costs with COVID-19 and telehealth initiatives: analysis of Australian whole-population linked data. Br J Gen Pract. Apr 27, 2023;73(730):e364-e373. [ FREE Full text ] [ CrossRef ] [ Medline ]
- Arsenijevic J, Tummers L, Bosma N. Adherence to electronic health tools among vulnerable groups: systematic literature review and meta-analysis. J Med Internet Res. Feb 06, 2020;22(2):e11613. [ FREE Full text ] [ CrossRef ] [ Medline ]
- Kontos EZ, Bennett GG, Viswanath K. Barriers and facilitators to home computer and internet use among urban novice computer users of low socioeconomic position. J Med Internet Res. Oct 22, 2007;9(4):e31. [ FREE Full text ] [ CrossRef ] [ Medline ]
- Latulippe K, Hamel C, Giroux D. Social health inequalities and eHealth: a literature review with qualitative synthesis of theoretical and empirical studies. J Med Internet Res. Apr 27, 2017;19(4):e136. [ FREE Full text ] [ CrossRef ] [ Medline ]
- Foley K, Freeman T, Ward P, Lawler A, Osborne R, Fisher M. Exploring access to, use of and benefits from population-oriented digital health services in Australia. Health Promot Int. Aug 30, 2021;36(4):1105-1115. [ CrossRef ] [ Medline ]
- Cresswell JW, Plano Clark VL. Designing and Conducting Mixed Methods Research. Thousand Oaks, CA. SAGE Publications; 2007.
- Tappen RM, Cooley ME, Luckmann R, Panday S. Digital health information disparities in older adults: a mixed methods study. J Racial Ethn Health Disparities. Feb 2022;9(1):82-92. [ FREE Full text ] [ CrossRef ] [ Medline ]
- Who can get a card. Services Australia. URL: https://www.servicesaustralia.gov.au/who-can-get-health-care-card?context=21981 [accessed 2023-11-03]
- Levesque JF, Harris MF, Russell G. Patient-centred access to health care: conceptualising access at the interface of health systems and populations. Int J Equity Health. Mar 11, 2013;12:18. [ FREE Full text ] [ CrossRef ] [ Medline ]
- Bryant A, Charmaz K. The SAGE Handbook of Grounded Theory, Paperback Edition. Thousand Oaks, CA. SAGE Publications; 2010.
- Johnson MO, Rose CD, Dilworth SE, Neilands TB. Advances in the conceptualization and measurement of health care empowerment: development and validation of the health care empowerment inventory. PLoS One. 2012;7(9):e45692. [ FREE Full text ] [ CrossRef ] [ Medline ]
- Norman CD, Skinner HA. eHEALS: the eHealth literacy scale. J Med Internet Res. Nov 14, 2006;8(4):e27. [ FREE Full text ] [ CrossRef ] [ Medline ]
- Kayser L, Karnoe A, Furstrand D, Batterham R, Christensen KB, Elsworth G, et al. A multidimensional tool based on the eHealth literacy framework: development and initial validity testing of the eHealth Literacy Questionnaire (eHLQ). J Med Internet Res. Feb 12, 2018;20(2):e36. [ FREE Full text ] [ CrossRef ] [ Medline ]
- Standards. Australian Bureau of Statistics. URL: https://www.abs.gov.au/statistics/standards [accessed 2024-04-04]
- Al-Janabi H, Flynn TN, Coast J. Development of a self-report measure of capability wellbeing for adults: the ICECAP-A. Qual Life Res. Feb 2012;21(1):167-176. [ FREE Full text ] [ CrossRef ] [ Medline ]
- Van der Feltz-Cornelis CM, Van Oppen P, Van Marwijk HW, De Beurs E, Van Dyck R. A patient-doctor relationship questionnaire (PDRQ-9) in primary care: development and psychometric evaluation. Gen Hosp Psychiatry. 2004;26(2):115-120. [ CrossRef ] [ Medline ]
- Chao J. Continuity of care: incorporating patient perceptions. Fam Med. 1988;20(5):333-337. [ Medline ]
- Wilson CK, Thomas J, Barraket J. Measuring digital inequality in Australia: the Australian digital inclusion index. JTDE. Jun 30, 2019;7(2):102-120. [ CrossRef ]
- Digital participation: a view of Australia's online behaviours. Australia Post. Jul 2017. URL: https://auspost.com.au/content/dam/auspost_corp/media/documents/white-paper-digital-inclusion.pdf [accessed 2024-04-04]
- Poli A, Kelfve S, Motel-Klingebiel A. A research tool for measuring non-participation of older people in research on digital health. BMC Public Health. Nov 08, 2019;19(1):1487. [ FREE Full text ] [ CrossRef ] [ Medline ]
- Cohen J. Statistical Power Analysis for the Behavioral Sciences Second Edition. London, UK. Routledge; 1988.
- Borg K, Smith L. Digital inclusion and online behaviour: five typologies of Australian internet users. Behav Inf Technol. Feb 15, 2018;37(4):367-380. [ CrossRef ]
- Mathers A, Richardson J, Vincent S, Joseph C, Stone E. Good Things Foundation COVID-19 response report. Good Things Foundation. 2020. URL: https://tinyurl.com/2peu3kak [accessed 2024-04-04]
- Norman CD, Skinner HA. eHealth literacy: essential skills for consumer health in a networked world. J Med Internet Res. Jun 16, 2006;8(2):e9. [ FREE Full text ] [ CrossRef ] [ Medline ]
- Neves AL, Burgers J. Digital technologies in primary care: implications for patient care and future research. Eur J Gen Pract. Dec 11, 2022;28(1):203-208. [ FREE Full text ] [ CrossRef ] [ Medline ]
Abbreviations
Edited by T Leung; submitted 03.07.23; peer-reviewed by T Freeman, H Shen; comments to author 16.08.23; revised version received 30.11.23; accepted 31.01.24; published 11.04.24.
©Melinda Ada Choy, Kathleen O'Brien, Katelyn Barnes, Elizabeth Ann Sturgiss, Elizabeth Rieger, Kirsty Douglas. Originally published in the Journal of Medical Internet Research (https://www.jmir.org), 11.04.2024.
This is an open-access article distributed under the terms of the Creative Commons Attribution License (https://creativecommons.org/licenses/by/4.0/), which permits unrestricted use, distribution, and reproduction in any medium, provided the original work, first published in the Journal of Medical Internet Research, is properly cited. The complete bibliographic information, a link to the original publication on https://www.jmir.org/, as well as this copyright and license information must be included.
Suggestions or feedback?
MIT News | Massachusetts Institute of Technology
- Machine learning
- Social justice
- Black holes
- Classes and programs
Departments
- Aeronautics and Astronautics
- Brain and Cognitive Sciences
- Architecture
- Political Science
- Mechanical Engineering
Centers, Labs, & Programs
- Abdul Latif Jameel Poverty Action Lab (J-PAL)
- Picower Institute for Learning and Memory
- Lincoln Laboratory
- School of Architecture + Planning
- School of Engineering
- School of Humanities, Arts, and Social Sciences
- Sloan School of Management
- School of Science
- MIT Schwarzman College of Computing
Desalination system could produce freshwater that is cheaper than tap water
Press contact :, media download.

*Terms of Use:
Images for download on the MIT News office website are made available to non-commercial entities, press and the general public under a Creative Commons Attribution Non-Commercial No Derivatives license . You may not alter the images provided, other than to crop them to size. A credit line must be used when reproducing images; if one is not provided below, credit the images to "MIT."

Previous image Next image
Engineers at MIT and in China are aiming to turn seawater into drinking water with a completely passive device that is inspired by the ocean, and powered by the sun.
In a paper appearing today in the journal Joule, the team outlines the design for a new solar desalination system that takes in saltwater and heats it with natural sunlight.
The configuration of the device allows water to circulate in swirling eddies, in a manner similar to the much larger “thermohaline” circulation of the ocean. This circulation, combined with the sun’s heat, drives water to evaporate, leaving salt behind. The resulting water vapor can then be condensed and collected as pure, drinkable water. In the meantime, the leftover salt continues to circulate through and out of the device, rather than accumulating and clogging the system.
The new system has a higher water-production rate and a higher salt-rejection rate than all other passive solar desalination concepts currently being tested.
The researchers estimate that if the system is scaled up to the size of a small suitcase, it could produce about 4 to 6 liters of drinking water per hour and last several years before requiring replacement parts. At this scale and performance, the system could produce drinking water at a rate and price that is cheaper than tap water.
“For the first time, it is possible for water, produced by sunlight, to be even cheaper than tap water,” says Lenan Zhang, a research scientist in MIT’s Device Research Laboratory.
The team envisions a scaled-up device could passively produce enough drinking water to meet the daily requirements of a small family. The system could also supply off-grid, coastal communities where seawater is easily accessible.
Zhang’s study co-authors include MIT graduate student Yang Zhong and Evelyn Wang, the Ford Professor of Engineering, along with Jintong Gao, Jinfang You, Zhanyu Ye, Ruzhu Wang, and Zhenyuan Xu of Shanghai Jiao Tong University in China.
A powerful convection
The team’s new system improves on their previous design — a similar concept of multiple layers, called stages. Each stage contained an evaporator and a condenser that used heat from the sun to passively separate salt from incoming water. That design, which the team tested on the roof of an MIT building, efficiently converted the sun’s energy to evaporate water, which was then condensed into drinkable water. But the salt that was left over quickly accumulated as crystals that clogged the system after a few days. In a real-world setting, a user would have to place stages on a frequent basis, which would significantly increase the system’s overall cost.
In a follow-up effort, they devised a solution with a similar layered configuration, this time with an added feature that helped to circulate the incoming water as well as any leftover salt. While this design prevented salt from settling and accumulating on the device, it desalinated water at a relatively low rate.
In the latest iteration, the team believes it has landed on a design that achieves both a high water-production rate, and high salt rejection, meaning that the system can quickly and reliably produce drinking water for an extended period. The key to their new design is a combination of their two previous concepts: a multistage system of evaporators and condensers, that is also configured to boost the circulation of water — and salt — within each stage.
“We introduce now an even more powerful convection, that is similar to what we typically see in the ocean, at kilometer-long scales,” Xu says.
The small circulations generated in the team’s new system is similar to the “thermohaline” convection in the ocean — a phenomenon that drives the movement of water around the world, based on differences in sea temperature (“thermo”) and salinity (“haline”).
“When seawater is exposed to air, sunlight drives water to evaporate. Once water leaves the surface, salt remains. And the higher the salt concentration, the denser the liquid, and this heavier water wants to flow downward,” Zhang explains. “By mimicking this kilometer-wide phenomena in small box, we can take advantage of this feature to reject salt.”
Tapping out
The heart of the team’s new design is a single stage that resembles a thin box, topped with a dark material that efficiently absorbs the heat of the sun. Inside, the box is separated into a top and bottom section. Water can flow through the top half, where the ceiling is lined with an evaporator layer that uses the sun’s heat to warm up and evaporate any water in direct contact. The water vapor is then funneled to the bottom half of the box, where a condensing layer air-cools the vapor into salt-free, drinkable liquid. The researchers set the entire box at a tilt within a larger, empty vessel, then attached a tube from the top half of the box down through the bottom of the vessel, and floated the vessel in saltwater.
In this configuration, water can naturally push up through the tube and into the box, where the tilt of the box, combined with the thermal energy from the sun, induces the water to swirl as it flows through. The small eddies help to bring water in contact with the upper evaporating layer while keeping salt circulating, rather than settling and clogging.
The team built several prototypes, with one, three, and 10 stages, and tested their performance in water of varying salinity, including natural seawater and water that was seven times saltier.
From these tests, the researchers calculated that if each stage were scaled up to a square meter, it would produce up to 5 liters of drinking water per hour, and that the system could desalinate water without accumulating salt for several years. Given this extended lifetime, and the fact that the system is entirely passive, requiring no electricity to run, the team estimates that the overall cost of running the system would be cheaper than what it costs to produce tap water in the United States.
“We show that this device is capable of achieving a long lifetime,” Zhong says. “That means that, for the first time, it is possible for drinking water produced by sunlight to be cheaper than tap water. This opens up the possibility for solar desalination to address real-world problems.”
“This is a very innovative approach that effectively mitigates key challenges in the field of desalination,” says Guihua Yu, who develops sustainable water and energy storage systems at the University of Texas at Austin, and was not involved in the research. “The design is particularly beneficial for regions struggling with high-salinity water. Its modular design makes it highly suitable for household water production, allowing for scalability and adaptability to meet individual needs.”
Funding for the research at Shanghai Jiao Tong University was supported by the Natural Science Foundation of China.
Share this news article on:
Press mentions, time magazine.
A number of MIT spinouts and research projects – including the MOXIE instrument that successfully generated oxygen on Mars, a new solar-powered desalination system and MIT spinout SurgiBox – were featured on TIME’s Best Inventions of 2023 list.
Insider reporter Katie Hawkinson explores how MIT researchers developed a new solar-powered desalination system that can remove the salt from seawater for less than the cost of U.S. tap water. Creating a device that relies on solar power, “eliminates a major financial barrier, especially for low-income countries experiencing water scarcity,” Hawkinson explains.
The Hill reporter Sharon Udasin writes that MIT researchers have developed a new solar-powered desalination device that “could last several years and generate water at a rate and price that is less expensive than tap water.” The researchers estimated that “if their model was scaled up to the size of a small suitcase, it could produce about 4 to 6 liters of drinking water per hour,” writes Udasin.
The Daily Beast
MIT researchers have developed a new desalination system that uses solar energy to convert seawater into drinkable water, reports Tony Ho Tran for the Daily Beast . The device could make it possible to, “make freshwater that’s even more affordable than the water coming from Americans’ kitchen faucets.”
Previous item Next item
Related Links
- Evelyn Wang
- Lenan Zhang
- Device Research Lab
- Department of Mechanical Engineering
Related Topics
- Desalination
- Mechanical engineering
- Sustainability
Related Articles

Passive cooling system could benefit off-grid locations

Solar-powered system offers a route to inexpensive desalination

Solar-powered system extracts drinkable water from “dry” air

Simple, solar-powered water desalination
More mit news.

A biomedical engineer pivots from human movement to women’s health
Read full story →

MIT tops among single-campus universities in US patents granted

A new way to detect radiation involving cheap ceramics

A crossroads for computing at MIT

Growing our donated organ supply

New AI method captures uncertainty in medical images
- More news on MIT News homepage →
Massachusetts Institute of Technology 77 Massachusetts Avenue, Cambridge, MA, USA
- Map (opens in new window)
- Events (opens in new window)
- People (opens in new window)
- Careers (opens in new window)
- Accessibility
- Social Media Hub
- MIT on Facebook
- MIT on YouTube
- MIT on Instagram
Home Toggle navigation FR Toggle Search Search the site Search About us About us Head office Regional offices History Archives Background materials Photos and videos Accessibility Contact us Corporate governance Board of Directors Governing Council and Senior Management Governance documents Educational resources The Economy, Plain and Simple Explainers Financial education resources Careers Take a central role at the Bank of Canada with our current opportunities and scholarships.
Interest Rate Announcement and Monetary Policy Report
09:45 (ET) On eight scheduled dates each year, the Bank of Canada announces the setting for the overnight rate target in a press release explaining the factors behind the decision. Four times a year, Governing Council presents the Monetary Policy Report : the Bank’s base-case projection for inflation and growth in the Canadian economy, and its assessment of risks.
See the media advisory .
We use cookies to help us keep improving this website.
Voice of the US farmer 2023–24: Farmers seek path to scale sustainably
Since 2018, McKinsey has gone into the field to better understand farmers’ mindsets. Following our publication of “Global Farmer Insights 2022,” 1 “ Global Farmer Insights 2022 ,” McKinsey, accessed March 29, 2024. we surveyed nearly 500 US farmers in 2023 to learn about their profitability, outlook on purchasing decisions, and adoption of sustainability practices and agtech solutions. 2 Survey conducted in fourth quarter 2023. There were 485 responses through computer-assisted web interviewing. Farmers surveyed included row- and specialty-crop operations with a farm-size distribution of 60 percent with less than 1,000 acres, 33 percent with 1,000 to 5,000 acres, and 7 percent with more than 5,000 acres. The 2023 survey found that despite recent supply chain disruptions, price volatility, and inflation, many farmers are investing in adopting sustainable-farming practices and technology solutions.
The sustainable-farming environment is rapidly evolving
Sustainable-farming practices are necessary to meet decarbonization goals and broader environmental targets. 3 The US Department of Agriculture (USDA) defines sustainable agriculture as “farming in such a way to protect the environment, aid and expand natural resources, and to make the best use of nonrenewable resources.” “Sustainability agriculture,” National Agricultural Library, accessed March 29, 2024. Agriculture accounts for nearly a quarter of global emissions, 4 Climate change 2022: Mitigation of climate change: Summary for policymakers , Intergovernmental Panel on Climate Change, 2022. and it was identified as the industry that contributes the most to exceeding planetary boundaries in McKinsey’s 2022 report Nature in the balance . 5 Nature in the balance: What companies can do to restore natural capital , McKinsey, December 5, 2022.
About the authors
Governments, investors, and companies are taking action to promote change. For example, the US Department of Agriculture’s mandatory budget in 2023 included an estimated $7 billion dedicated to conservation, with an additional $17 billion in conservation funding mandated by the Inflation Reduction Act through 2031. 6 “CBO’s February 2023 baseline for farm programs,” Congressional Budget Office, February 2023; FY 2024 budget summary , US Department of Agriculture, 2024. Furthermore, many agriculture players and consumer goods companies have committed to regenerative farming and deforestation-free supply chains.
However, average 2021–22 global finance flows for agriculture were only $43 billion, compared with $515 billion for energy systems and $336 billion for transport. 7 Barbara Buchner et al., “Global landscape of climate finance 2023,” Climate Policy Initiative, November 2, 2023. And adoption of sustainable-farming practices is not increasing fast enough to meet the sustainability goals of food processors and consumer goods companies.
In 2022, we released The agricultural transition: Building a sustainable future , 8 The agricultural transition: Building a sustainable future , McKinsey, June 27, 2023. a report that examined on-farm decarbonization measures and laid out a path to meet decarbonization targets. As a part of our fourth quarter 2023 survey, we explored a selection of these and other practices to better understand farmer adoption and opportunities to scale it in the United States.
Adoption of sustainable-farming practices is growing, but penetration remains low
Although 90 percent of farmers expressed awareness of the selected sustainable-farming practices, holistic adoption remains low. While more than 68 percent of farmers surveyed have adopted reduced- or no-till practices, only about half are using variable-rate fertilizer application and 35 percent are using controlled-irrigation practices.
Sustainable-farming practices that require behavioral changes in agriculture lead the way in adoption (for example, reducing or eliminating tillage), followed by practices that require product changes, such as nitrogen stabilizers or inhibitors. Practices that require changes in equipment tend to have the lowest adoption levels (Exhibit 1).
Many farmers are adopting sustainable-farming practices, but they are implementing them on only a small share of their acreage—generally less than 30 percent. There is an opportunity to increase acreage penetration among current users, especially for practices such as cover cropping and use of biologicals.
There are further opportunities to increase overall adoption by educating farmers on newer practices and convincing farmers who have heard of but not used the practices to give them a try. For example, 74 percent of farmers said they had heard of on-farm renewable energy, but only 13 percent have adopted it and only 7 percent are planning to adopt it in the next two years. Furthermore, 16 percent of farmers said they had not heard of biologicals, and 46 percent had not heard of biochar as a fertilizer.
Specialty-crop farmers are leading the way on adoption of most sustainability practices (Exhibit 2). Adoption is at least 20 percent greater among specialty-crop farmers for half of the practices surveyed. For example, biologicals adoption is 11 percentage points higher for specialty crops than for row crops; 20 percent of specialty farmers said they have adopted on-farm renewable-energy generation compared with 11 percent of row-crop farmers. Moreover, a greater percentage of specialty-crop farmers said they plan to implement sustainability practices in the next two years compared with row-crop farmers.
Practice adoption is correlated with perceived ROI
Farmers adopting sustainable-farming practices say they expect a positive ROI. Adoption of practices is highly correlated with farmers’ perceived ROI. Practices with the highest perceived ROI, such as applying fertilizer based on soil sampling, reducing or eliminating tillage, and implementing variable-rate fertilization, also have the highest rates of adoption (Exhibit 3).
Farmers expect many of the practices to have positive long-term benefits, such as a 3 to 5 percent yield rise and higher land value. However, farmers said they expect costs to remain 1 to 3 percent higher for most practices after more than five years of adoption. The ROI on adoption of sustainable-farming practices is complex and depends on a combination of factors including crop yield, crop prices, land value, and input, labor, and equipment costs. Although farmers said they generally expect the use of sustainable-farming practices to raise their costs, they also expect this increase to pay dividends in higher crop yield, land value appreciation, and better crop pricing.
For example, surveyed farmers who grow cover crops said they are experiencing or expect to experience a 3 percent increase in crop yield, a 2 percent increase in crop prices, and a 3 percent increase in land value on average. They are also experiencing or expect to experience a 2 percent increase in input, labor, and equipment costs on average, but they expect the benefits to outweigh these costs. Notably, for some practices, such as reducing or eliminating tillage, farmers expect both revenue increases (through increased yields) and cost reductions.
There are a variety of barriers to adoption
Small and large farms face different barriers in adopting sustainable-farming practices. However, compensation is a major obstacle to implementation for farms of all sizes (Exhibit 4). For example, 51 percent of medium-size and large farms with more than 1,000 acres and 39 percent of small farms identified obtaining a market premium (higher price) for sustainably grown crops or commodities as a top barrier to adoption. Moreover, 45 percent of medium-size and large farms see generating additional revenue from sustainability assets (for example, carbon credits) as their biggest barrier to adoption. Farmers with less than 1,000 acres are far more likely than those with bigger holdings to face challenges in implementing sustainable-farming practices (for example, operational barriers).
The most attractive incentives to unlock the transition to sustainable-farming practices vary by farm size (Exhibit 5). Representatives of medium-size and large farms with more than 1,000 acres said that certainty on operational benefits and reliable information on expected ROI are key. On the other hand, small farms with less than 1,000 acres highlighted the availability of financial incentives and assurance of a green premium (higher price) as the top two factors necessary to promote adoption. Overall, farmers are focused on gaining confidence in the economic benefits of sustainable-farming practices before making the full transition.
Across the board, both small and large farmers highlighted crop and commodity premiums from buyers of sustainable crops as the most attractive financial lever to increase adoption of sustainable-farming practices. Generating long-term and reliable sources of economic benefit may be key to driving additional adoption.
Government programs have seen greater participation than industry programs
Government-led programs designed to boost adoption of sustainable practices have substantially greater participation among farmers than industry programs do. These initiatives, such as the Environmental Quality Incentives Program (EQIP), are helping to spur adoption among farmers.
Of surveyed farmers, 57 percent said they were participating in a government program, while only 4 percent were participating in an industry-sponsored program, including the more than 15 carbon programs launched since 2016. 9 Lisa Moore et al., Agricultural carbon programs: From program chaos to systems change , American Farmland Trust, August 19, 2023. Adoption of sustainable-farming practices was at least 20 percent greater among government program participants than among those not enrolled in any program for ten of the 13 surveyed practices (Exhibit 6). This could indicate that government programs are driving adoption and that continued programmatic support from governments and industry players may encourage more farmers to transition to sustainable-farming practices.
Industry players can take steps to support farmers
As the importance of sustainable-farming grows, winning players will partner with farmers to support them in growth and innovation. To do so, industry participants could consider the following:
- reassessing the share of value captured by the farmer and bringing transparency to consumers about the “true cost of food”
- building sustainability programs and making them accessible; practice adoption is higher among participants in programs, but most of these are small scale today
- investing in education to help farmers overcome operational challenges and generate further data points on yield and cost benefits, especially for less-adopted practices
- collaborating with smaller and specialty-crop farmers in the near term, as these farmers are more willing to adopt most practices in the next two years
- continuing to evolve and grow nutrient-related programs, such as applying variable-rate fertilizer; most farmers view these practices as ROI positive, but only about half have adopted them and only in a part of their acreage
Many agriculture players are making commitments to sustainable farming in response to the sector’s large emissions footprint. But the transition to sustainably produced food depends on changing farmers’ behaviors and operational decisions. Our survey suggests that agriculture ecosystem players should consider how they can meet farmers’ expressed need for compensation for investments in sustainable-farming practices and provide reliable information about practice implementation and operational benefits.
David Fiocco is a senior partner in McKinsey’s Minneapolis office, Vasanth Ganesan is a partner in the New York office, Maria Garcia de la Serrana Lozano is an associate partner in the San Francisco office, and Julia Kalanik and Wilson Roen are consultants in the Chicago office.
The authors wish to thank Rui Chen, Raissa Dantas, Emma Galeucia, David Greenawalt, Emmanuel Mwaka, and Asha Sharma for their contributions to this article.
Explore a career with us
Related articles.

From green ammonia to lower-carbon foods

Building food and agriculture businesses for a green future
Have a language expert improve your writing
Run a free plagiarism check in 10 minutes, generate accurate citations for free.
- Knowledge Base
Methodology
- What Is Qualitative Research? | Methods & Examples
What Is Qualitative Research? | Methods & Examples
Published on June 19, 2020 by Pritha Bhandari . Revised on June 22, 2023.
Qualitative research involves collecting and analyzing non-numerical data (e.g., text, video, or audio) to understand concepts, opinions, or experiences. It can be used to gather in-depth insights into a problem or generate new ideas for research.
Qualitative research is the opposite of quantitative research , which involves collecting and analyzing numerical data for statistical analysis.
Qualitative research is commonly used in the humanities and social sciences, in subjects such as anthropology, sociology, education, health sciences, history, etc.
- How does social media shape body image in teenagers?
- How do children and adults interpret healthy eating in the UK?
- What factors influence employee retention in a large organization?
- How is anxiety experienced around the world?
- How can teachers integrate social issues into science curriculums?
Table of contents
Approaches to qualitative research, qualitative research methods, qualitative data analysis, advantages of qualitative research, disadvantages of qualitative research, other interesting articles, frequently asked questions about qualitative research.
Qualitative research is used to understand how people experience the world. While there are many approaches to qualitative research, they tend to be flexible and focus on retaining rich meaning when interpreting data.
Common approaches include grounded theory, ethnography , action research , phenomenological research, and narrative research. They share some similarities, but emphasize different aims and perspectives.
Note that qualitative research is at risk for certain research biases including the Hawthorne effect , observer bias , recall bias , and social desirability bias . While not always totally avoidable, awareness of potential biases as you collect and analyze your data can prevent them from impacting your work too much.
Prevent plagiarism. Run a free check.
Each of the research approaches involve using one or more data collection methods . These are some of the most common qualitative methods:
- Observations: recording what you have seen, heard, or encountered in detailed field notes.
- Interviews: personally asking people questions in one-on-one conversations.
- Focus groups: asking questions and generating discussion among a group of people.
- Surveys : distributing questionnaires with open-ended questions.
- Secondary research: collecting existing data in the form of texts, images, audio or video recordings, etc.
- You take field notes with observations and reflect on your own experiences of the company culture.
- You distribute open-ended surveys to employees across all the company’s offices by email to find out if the culture varies across locations.
- You conduct in-depth interviews with employees in your office to learn about their experiences and perspectives in greater detail.
Qualitative researchers often consider themselves “instruments” in research because all observations, interpretations and analyses are filtered through their own personal lens.
For this reason, when writing up your methodology for qualitative research, it’s important to reflect on your approach and to thoroughly explain the choices you made in collecting and analyzing the data.
Qualitative data can take the form of texts, photos, videos and audio. For example, you might be working with interview transcripts, survey responses, fieldnotes, or recordings from natural settings.
Most types of qualitative data analysis share the same five steps:
- Prepare and organize your data. This may mean transcribing interviews or typing up fieldnotes.
- Review and explore your data. Examine the data for patterns or repeated ideas that emerge.
- Develop a data coding system. Based on your initial ideas, establish a set of codes that you can apply to categorize your data.
- Assign codes to the data. For example, in qualitative survey analysis, this may mean going through each participant’s responses and tagging them with codes in a spreadsheet. As you go through your data, you can create new codes to add to your system if necessary.
- Identify recurring themes. Link codes together into cohesive, overarching themes.
There are several specific approaches to analyzing qualitative data. Although these methods share similar processes, they emphasize different concepts.
Qualitative research often tries to preserve the voice and perspective of participants and can be adjusted as new research questions arise. Qualitative research is good for:
- Flexibility
The data collection and analysis process can be adapted as new ideas or patterns emerge. They are not rigidly decided beforehand.
- Natural settings
Data collection occurs in real-world contexts or in naturalistic ways.
- Meaningful insights
Detailed descriptions of people’s experiences, feelings and perceptions can be used in designing, testing or improving systems or products.
- Generation of new ideas
Open-ended responses mean that researchers can uncover novel problems or opportunities that they wouldn’t have thought of otherwise.
Researchers must consider practical and theoretical limitations in analyzing and interpreting their data. Qualitative research suffers from:
- Unreliability
The real-world setting often makes qualitative research unreliable because of uncontrolled factors that affect the data.
- Subjectivity
Due to the researcher’s primary role in analyzing and interpreting data, qualitative research cannot be replicated . The researcher decides what is important and what is irrelevant in data analysis, so interpretations of the same data can vary greatly.
- Limited generalizability
Small samples are often used to gather detailed data about specific contexts. Despite rigorous analysis procedures, it is difficult to draw generalizable conclusions because the data may be biased and unrepresentative of the wider population .
- Labor-intensive
Although software can be used to manage and record large amounts of text, data analysis often has to be checked or performed manually.
If you want to know more about statistics , methodology , or research bias , make sure to check out some of our other articles with explanations and examples.
- Chi square goodness of fit test
- Degrees of freedom
- Null hypothesis
- Discourse analysis
- Control groups
- Mixed methods research
- Non-probability sampling
- Quantitative research
- Inclusion and exclusion criteria
Research bias
- Rosenthal effect
- Implicit bias
- Cognitive bias
- Selection bias
- Negativity bias
- Status quo bias
Quantitative research deals with numbers and statistics, while qualitative research deals with words and meanings.
Quantitative methods allow you to systematically measure variables and test hypotheses . Qualitative methods allow you to explore concepts and experiences in more detail.
There are five common approaches to qualitative research :
- Grounded theory involves collecting data in order to develop new theories.
- Ethnography involves immersing yourself in a group or organization to understand its culture.
- Narrative research involves interpreting stories to understand how people make sense of their experiences and perceptions.
- Phenomenological research involves investigating phenomena through people’s lived experiences.
- Action research links theory and practice in several cycles to drive innovative changes.
Data collection is the systematic process by which observations or measurements are gathered in research. It is used in many different contexts by academics, governments, businesses, and other organizations.
There are various approaches to qualitative data analysis , but they all share five steps in common:
- Prepare and organize your data.
- Review and explore your data.
- Develop a data coding system.
- Assign codes to the data.
- Identify recurring themes.
The specifics of each step depend on the focus of the analysis. Some common approaches include textual analysis , thematic analysis , and discourse analysis .
Cite this Scribbr article
If you want to cite this source, you can copy and paste the citation or click the “Cite this Scribbr article” button to automatically add the citation to our free Citation Generator.
Bhandari, P. (2023, June 22). What Is Qualitative Research? | Methods & Examples. Scribbr. Retrieved April 11, 2024, from https://www.scribbr.com/methodology/qualitative-research/
Is this article helpful?

Pritha Bhandari
Other students also liked, qualitative vs. quantitative research | differences, examples & methods, how to do thematic analysis | step-by-step guide & examples, unlimited academic ai-proofreading.
✔ Document error-free in 5minutes ✔ Unlimited document corrections ✔ Specialized in correcting academic texts
IMAGES
VIDEO
COMMENTS
Developing your research methods is an integral part of your research design. When planning your methods, there are two key decisions you will make. First, ... In shorter scientific papers, where the aim is to report the findings of a specific study, you might simply describe what you did in a methods section.
The research methodology is an important section of any research paper or thesis, as it describes the methods and procedures that will be used to conduct the research. It should include details about the research design, data collection methods, data analysis techniques, and any ethical considerations.
Research Report is a written document that presents the results of a research project or study, including the research question, methodology, results, and conclusions, in a clear and objective manner. ... The methodology section describes the research design, methods, and procedures used to collect and analyze data. It should include ...
Quantitative research methods are used to collect and analyze numerical data. This type of research is useful when the objective is to test a hypothesis, determine cause-and-effect relationships, and measure the prevalence of certain phenomena. Quantitative research methods include surveys, experiments, and secondary data analysis.
Provide the rationality behind your chosen approach. Based on logic and reason, let your readers know why you have chosen said research methodologies. Additionally, you have to build strong arguments supporting why your chosen research method is the best way to achieve the desired outcome. 3. Explain your mechanism.
About Research Methods. This guide provides an overview of research methods, how to choose and use them, and supports and resources at UC Berkeley. As Patten and Newhart note in the book Understanding Research Methods, "Research methods are the building blocks of the scientific enterprise. They are the "how" for building systematic knowledge.
Your Methods Section contextualizes the results of your study, giving editors, reviewers and readers alike the information they need to understand and interpret your work. Your methods are key to establishing the credibility of your study, along with your data and the results themselves. A complete methods section should provide enough detail ...
A research report is a well-crafted document that outlines the processes, data, and findings of a systematic investigation. It is an important document that serves as a first-hand account of the research process, and it is typically considered an objective and accurate source of information.
4. Use subheadings: Dividing the Methods section in terms of the experiments helps the reader to follow the section better. You may write the specific objective of each experiment as a subheading. Alternatively, if applicable, the name of each experiment can also be used as subheading. 5.
research question. It uses explicit, systematic methods that are selected to minimise bias, thus providing reliable findings from which conclusions can be drawn and deci-sions made. Meta-analysis is the use of statistical methods to summarise and combine the results of independent studies. Many systematic reviews contain meta-analyses, but not all.
Identify the major sections of an APA-style research report and the basic contents of each section. Plan and write an effective APA-style research report. ... The abstract presents the research question, a summary of the method, the basic results, and the most important conclusions. Because the abstract is usually limited to about 200 words, it ...
A research report is a collection of contextual data, gathered through organized research, that provides new insights into a particular challenge (which, for this article, is business-related). Research reports are a time-tested method for distilling large amounts of data into a narrow band of focus.
INTRODUCTION. Scientific research is usually initiated by posing evidenced-based research questions which are then explicitly restated as hypotheses.1,2 The hypotheses provide directions to guide the study, solutions, explanations, and expected results.3,4 Both research questions and hypotheses are essentially formulated based on conventional theories and real-world processes, which allow the ...
A typical lab report would include the following sections: title, abstract, introduction, method, results, and discussion. The title page, abstract, references, and appendices are started on separate pages (subsections from the main body of the report are not). Use double-line spacing of text, font size 12, and include page numbers.
Abstract. This guide for writers of research reports consists of practical suggestions for writing a report that is clear, concise, readable, and understandable. It includes suggestions for terminology and notation and for writing each section of the report—introduction, method, results, and discussion. Much of the guide consists of ...
Continue to all research methods & reporting articles. RMR articles discuss the nuts and bolts of doing and writing up research. For doctors interested in doing and interpreting clinical research. Also papers that present new or updated research reporting guidelines.
Research reports are recorded data prepared by researchers or statisticians after analyzing the information gathered by conducting organized research, typically in the form of surveys or qualitative methods. A research report is a reliable source to recount details about a conducted research. It is most often considered to be a true testimony ...
Olivia Guy-Evans, MSc. Research methods in psychology are systematic procedures used to observe, describe, predict, and explain behavior and mental processes. They include experiments, surveys, case studies, and naturalistic observations, ensuring data collection is objective and reliable to understand and explain psychological phenomena.
A research design is a strategy for answering your research question using empirical data. Creating a research design means making decisions about: Your overall research objectives and approach. Whether you'll rely on primary research or secondary research. Your sampling methods or criteria for selecting subjects. Your data collection methods.
Nature of Research Qualitative Research Report This is the type of report is written for qualitative research. It outlines the methods, processes, and findings of a qualitative method of ...
This course covers foundations of the research process for experimental Psychology: reviewing and evaluating published journal articles, refining new research questions, conducting pilot studies, creating stimuli, sequencing experiments for optimal control and data quality, analyzing data, and communicating scientific methods and results clearly, effectively, and professionally in APA style.
Introduces science Honours students to the range of theoretical frameworks which may inform different types of scientific research and to the methods and methodologies which may be employed in the scientific research process. Encourages students to acquire the skills necessary to carry out, produce and report well designed and articulated research proposals and projects.
Low-frequency users were more likely to report difficulty affording the financial costs needed for digital access. ... which renders them a key demographic for research on patient-initiated digital health access. Objective: This study aims to provide comprehensive primary mixed methods data on the patient experience of barriers to digital ...
The Hill reporter Sharon Udasin writes that MIT researchers have developed a new solar-powered desalination device that "could last several years and generate water at a rate and price that is less expensive than tap water." The researchers estimated that "if their model was scaled up to the size of a small suitcase, it could produce about 4 to 6 liters of drinking water per hour ...
09:45 (ET)On eight scheduled dates each year, the Bank of Canada announces the setting for the overnight rate target in a press release explaining the factors behind the decision. Four times a year, Governing Council presents the Monetary Policy Report: the Bank's base-case projection for inflation and growth in the Canadian economy, and its assessment of risks.
The report also explores key entrepreneurial traits for business success and highlights demographic disparities and challenges in starting and running a business.
Farmers adopt sustainable farming methods at a low rate, even though 90% are aware of eco-friendly practices. They need more operational and financial support. ... 2023. a report that examined on-farm decarbonization measures and laid out a path to meet decarbonization targets. As a part of our fourth quarter 2023 survey, we explored a ...
Qualitative research involves collecting and analyzing non-numerical data (e.g., text, video, or audio) to understand concepts, opinions, or experiences. It can be used to gather in-depth insights into a problem or generate new ideas for research. Qualitative research is the opposite of quantitative research, which involves collecting and ...