

Descriptive Research: Methods, Types, and Examples | PPT

In order to understand what descriptive research is, one must first understand the different types of research methods. Descriptive research can be defined as a method used to describe something, usually in great detail. This type of research is often used in the sciences, such as in biology or psychology.
It can also be used in other fields, such as marketing or sociology. There are many different ways to collect data for descriptive research, lets take a look on examples, methods, types, pros and cons of Descriptive Research in this article.
- Table of Contents
What is Descriptive Research?
Descriptive research is a type of research that is used to describe a population or phenomenon. This type of research is often used in the social sciences, but can be used in other disciplines as well.
Descriptive research is often used to provide a snapshot of a population or phenomenon. It can also be used to answer questions about how something works or why something happens.
When doing a descriptive study, the researcher thoroughly details the circumstance or case in their research materials. This kind of research design is entirely theoretical, and the researcher gathers data, analyses it, prepares it, and then clearly displays it. It is the type of study design that is the most inclusive.
Descriptive research can be either quantitative or qualitative in nature.
Quantitative descriptive research
Quantitative descriptive research involves collecting data that can be quantified, such as age, gender, income levels, etc. This type of data is typically collected through surveys or other means of data collection.
Qualitative descriptive research
Qualitative descriptive research involves collecting data that cannot be quantified, such as opinions, beliefs, attitudes, etc. This type of data is typically collected through interviews or focus groups.
Examples of Descriptive Research
- How the real estate market in London has transformed in the last 20 years ?
- Which product C or D are clients of firm A most interested in ?
- What distinguishes hybrid cows from Indian wild cows in terms of genetics, behavior, and morphology ?
- How common is illness 1 in population Z ?
Characteristics of Descriptive Research
There are many different characteristics of descriptive research, which include:
Quantitative in Nature
In descriptive research, data is systematically and quantitatively collected so that the research problem may be statistically analyzed. It does not involve the manipulation of variables. This type of research is typically quantitative, meaning that it uses numerical data to describe the population or phenomenon.
Observational
Descriptive research is observational in that it simply observes and records what is happening. It does not try to explain why something is happening or to manipulate variables.
Uncontrolled Variables
Descriptive research differs from experimental research in that the variables are not managed or controlled. This is one of its most salient features. Instead, they are only recognized, scrutinized, and measured. It does not involve the manipulation of variables. This means that researchers cannot control what happens during the course of the study.
Basis for Further Research
The data gathered during descriptive research serves as a foundation for subsequent study since it aids in gaining a thorough grasp of the research topic in order to properly respond to it.
Cross-sectional Studies
Cross-sectional studies are typically used to do descriptive research. An observational study method known as a cross-sectional study involves obtaining data on various variables at the person level at a specific period.
Pros of Descriptive Research
Comprehensive.
Descriptive research frequently combines quantitative and qualitative methods, giving the research topic a more detailed knowledge.
Various Data Collection Techniques
The case study method, observational method, and survey method are just a few of the many data collection techniques that can be utilized in descriptive research. Quick and economical.
High External Validity
As research is conducted in the respondent’s natural context with no variables being altered, results generated using the descriptive method of research frequently have high levels of external validity.
Quick and Inexpensive
Since surveys are frequently used in descriptive research, it is possible to quickly, cost efficiently and efficiently collect data from a fairly large sample size.
Cons of Descriptive Research
Unable to validate or test research question.
Due to the fact that the data acquired does not assist in elucidating the reason of the phenomenon being examined, the descriptive technique of research cannot be utilized to test or validate the research problem.
Risk of Sampling Error
When choosing a sample group for a descriptive research study, random sampling is typically used. If the sample group isn’t representative of the larger population, chance may cause sampling error. Results from sampling mistake would be unreliable and unreliable.
Absence of Dependability
The data gathered could not be completely reliable if the research problem isn’t well-formulated. Additionally, this makes conducting a reliable investigation more difficult.
Possibility of False Responses
People’s reactions are crucial to descriptive research, especially when employing surveys. False responses may occasionally be given, which would undermine the reliability of the data gathered and, ultimately, the research’s conclusions.
Pros and Cons of Descriptive Research
Why to use descriptive research, comparing variables.
Descriptive research can be used to compare various variables and the responses of various demographics to various variables.
Validate the Current Conditions
Given that it requires a thorough investigation of each variable before drawing conclusions, descriptive research can be an effective method for determining the validity of an actual condition.
Analysis of Data Trends
The descriptive research approach can be used to track changes in variables over time, enabling the discovery and analysis of trends.
Describe the Features of the Subjects
Additionally, it can be utilized to identify the various traits of the participants. This can include qualities, attitudes, behaviors, and other attributes.
Methods of Descriptive Research
Descriptive research can be qualitative or quantitative in nature, and the researcher may choose to use one or both methods in order to best answer their research question(s). There are many different methods that can be used in descriptive research, and the type of method used will often depend on the type of data being collected.
There are three key methods used to carry out descriptive research.
Observations
Questionnaires or polls are used in survey research to get information from respondents on a particular subject. Since both have advantages, surveys should contain a mix of closed- and open-ended items. Because they may be conducted using a variety of digital and non-digital means, including email, websites, and phone surveys, surveys are a cost-effective technique of data collection.
The case study method entails conducting extensive research on specific people or groups of people. Instead of acquiring a wide volume of data to find correlations and trends, case studies include gathering precise data on a specifically defined subject. Therefore, rather of describing facts that can be generalized, this method is frequently used to describe the various traits of a particular subject.
Researchers can develop hypotheses through case studies that can broaden the scope of evaluation when researching the phenomenon.
With this approach, researchers keep a distance from the subjects they are studying and observe them in their natural environment. This enables them to acquire data on the behaviors and traits under investigation without having to rely on respondents to provide truthful and precise answers.
The observational approach is thought to be the best one for conducting descriptive research. Both qualitative and quantitative data must be gathered.
In conclusion, Descriptive Research is a type of research used to observe and describe phenomena. It is useful in providing detailed information about a specific event, behavior, or group. Although it cannot be used to draw causal relationships, it can be helpful in generating hypotheses for further research.
When deciding whether or not to use Descriptive Research, researchers should consider the pros and cons, as well as the specific research question they are trying to answer.
Other articles
Please read through some of our other articles with examples and explanations if you’d like to learn more about research methodology.
- PLS-SEM model
- Principal Components Analysis
- Multivariate Analysis
- Friedman Test
- Chi-Square Test (Χ²)
- Effect Size
Methodology
- Research Methods
- Quantitative Research
- Qualitative Research
- Case Study Research
- Survey Research
- Conclusive Research
- Descriptive Research
- Cross-Sectional Research
- Theoretical Framework
- Conceptual Framework
- Triangulation
- Grounded Theory
- Quasi-Experimental Design
- Mixed Method
- Correlational Research
- Randomized Controlled Trial
- Stratified Sampling
- Ethnography
- Ghost Authorship
- Secondary Data Collection
- Primary Data Collection
- Ex-Post-Facto
- Dissertation Topic
- Thesis Statement
- Research Proposal
- Research Questions
- Research Problem
- Research Gap
- Types of Research Gaps
- Operationalization of Variables
- Literature Review
- Research Hypothesis
- Questionnaire
- Reliability
- Measurement of Scale
- Sampling Techniques
- Acknowledgements
Related Posts
9 qualitative research designs and research methods, tips to increase your journal citation score, types of research quiz, difference between cohort study and case control study, convenience sampling: method and examples, difference between cohort and panel study, why is a pilot study important in research, panel survey: definition with examples, what is panel study, what is a cohort study | definition & examples.
bookmarked!!, I really like your site!
- Privacy Policy
Buy Me a Coffee

Home » Descriptive Research Design – Types, Methods and Examples
Descriptive Research Design – Types, Methods and Examples
Table of Contents

Descriptive Research Design
Definition:
Descriptive research design is a type of research methodology that aims to describe or document the characteristics, behaviors, attitudes, opinions, or perceptions of a group or population being studied.
Descriptive research design does not attempt to establish cause-and-effect relationships between variables or make predictions about future outcomes. Instead, it focuses on providing a detailed and accurate representation of the data collected, which can be useful for generating hypotheses, exploring trends, and identifying patterns in the data.
Types of Descriptive Research Design
Types of Descriptive Research Design are as follows:
Cross-sectional Study
This involves collecting data at a single point in time from a sample or population to describe their characteristics or behaviors. For example, a researcher may conduct a cross-sectional study to investigate the prevalence of certain health conditions among a population, or to describe the attitudes and beliefs of a particular group.
Longitudinal Study
This involves collecting data over an extended period of time, often through repeated observations or surveys of the same group or population. Longitudinal studies can be used to track changes in attitudes, behaviors, or outcomes over time, or to investigate the effects of interventions or treatments.
This involves an in-depth examination of a single individual, group, or situation to gain a detailed understanding of its characteristics or dynamics. Case studies are often used in psychology, sociology, and business to explore complex phenomena or to generate hypotheses for further research.
Survey Research
This involves collecting data from a sample or population through standardized questionnaires or interviews. Surveys can be used to describe attitudes, opinions, behaviors, or demographic characteristics of a group, and can be conducted in person, by phone, or online.
Observational Research
This involves observing and documenting the behavior or interactions of individuals or groups in a natural or controlled setting. Observational studies can be used to describe social, cultural, or environmental phenomena, or to investigate the effects of interventions or treatments.
Correlational Research
This involves examining the relationships between two or more variables to describe their patterns or associations. Correlational studies can be used to identify potential causal relationships or to explore the strength and direction of relationships between variables.
Data Analysis Methods
Descriptive research design data analysis methods depend on the type of data collected and the research question being addressed. Here are some common methods of data analysis for descriptive research:
Descriptive Statistics
This method involves analyzing data to summarize and describe the key features of a sample or population. Descriptive statistics can include measures of central tendency (e.g., mean, median, mode) and measures of variability (e.g., range, standard deviation).
Cross-tabulation
This method involves analyzing data by creating a table that shows the frequency of two or more variables together. Cross-tabulation can help identify patterns or relationships between variables.
Content Analysis
This method involves analyzing qualitative data (e.g., text, images, audio) to identify themes, patterns, or trends. Content analysis can be used to describe the characteristics of a sample or population, or to identify factors that influence attitudes or behaviors.
Qualitative Coding
This method involves analyzing qualitative data by assigning codes to segments of data based on their meaning or content. Qualitative coding can be used to identify common themes, patterns, or categories within the data.
Visualization
This method involves creating graphs or charts to represent data visually. Visualization can help identify patterns or relationships between variables and make it easier to communicate findings to others.
Comparative Analysis
This method involves comparing data across different groups or time periods to identify similarities and differences. Comparative analysis can help describe changes in attitudes or behaviors over time or differences between subgroups within a population.
Applications of Descriptive Research Design
Descriptive research design has numerous applications in various fields. Some of the common applications of descriptive research design are:
- Market research: Descriptive research design is widely used in market research to understand consumer preferences, behavior, and attitudes. This helps companies to develop new products and services, improve marketing strategies, and increase customer satisfaction.
- Health research: Descriptive research design is used in health research to describe the prevalence and distribution of a disease or health condition in a population. This helps healthcare providers to develop prevention and treatment strategies.
- Educational research: Descriptive research design is used in educational research to describe the performance of students, schools, or educational programs. This helps educators to improve teaching methods and develop effective educational programs.
- Social science research: Descriptive research design is used in social science research to describe social phenomena such as cultural norms, values, and beliefs. This helps researchers to understand social behavior and develop effective policies.
- Public opinion research: Descriptive research design is used in public opinion research to understand the opinions and attitudes of the general public on various issues. This helps policymakers to develop effective policies that are aligned with public opinion.
- Environmental research: Descriptive research design is used in environmental research to describe the environmental conditions of a particular region or ecosystem. This helps policymakers and environmentalists to develop effective conservation and preservation strategies.
Descriptive Research Design Examples
Here are some real-time examples of descriptive research designs:
- A restaurant chain wants to understand the demographics and attitudes of its customers. They conduct a survey asking customers about their age, gender, income, frequency of visits, favorite menu items, and overall satisfaction. The survey data is analyzed using descriptive statistics and cross-tabulation to describe the characteristics of their customer base.
- A medical researcher wants to describe the prevalence and risk factors of a particular disease in a population. They conduct a cross-sectional study in which they collect data from a sample of individuals using a standardized questionnaire. The data is analyzed using descriptive statistics and cross-tabulation to identify patterns in the prevalence and risk factors of the disease.
- An education researcher wants to describe the learning outcomes of students in a particular school district. They collect test scores from a representative sample of students in the district and use descriptive statistics to calculate the mean, median, and standard deviation of the scores. They also create visualizations such as histograms and box plots to show the distribution of scores.
- A marketing team wants to understand the attitudes and behaviors of consumers towards a new product. They conduct a series of focus groups and use qualitative coding to identify common themes and patterns in the data. They also create visualizations such as word clouds to show the most frequently mentioned topics.
- An environmental scientist wants to describe the biodiversity of a particular ecosystem. They conduct an observational study in which they collect data on the species and abundance of plants and animals in the ecosystem. The data is analyzed using descriptive statistics to describe the diversity and richness of the ecosystem.
How to Conduct Descriptive Research Design
To conduct a descriptive research design, you can follow these general steps:
- Define your research question: Clearly define the research question or problem that you want to address. Your research question should be specific and focused to guide your data collection and analysis.
- Choose your research method: Select the most appropriate research method for your research question. As discussed earlier, common research methods for descriptive research include surveys, case studies, observational studies, cross-sectional studies, and longitudinal studies.
- Design your study: Plan the details of your study, including the sampling strategy, data collection methods, and data analysis plan. Determine the sample size and sampling method, decide on the data collection tools (such as questionnaires, interviews, or observations), and outline your data analysis plan.
- Collect data: Collect data from your sample or population using the data collection tools you have chosen. Ensure that you follow ethical guidelines for research and obtain informed consent from participants.
- Analyze data: Use appropriate statistical or qualitative analysis methods to analyze your data. As discussed earlier, common data analysis methods for descriptive research include descriptive statistics, cross-tabulation, content analysis, qualitative coding, visualization, and comparative analysis.
- I nterpret results: Interpret your findings in light of your research question and objectives. Identify patterns, trends, and relationships in the data, and describe the characteristics of your sample or population.
- Draw conclusions and report results: Draw conclusions based on your analysis and interpretation of the data. Report your results in a clear and concise manner, using appropriate tables, graphs, or figures to present your findings. Ensure that your report follows accepted research standards and guidelines.
When to Use Descriptive Research Design
Descriptive research design is used in situations where the researcher wants to describe a population or phenomenon in detail. It is used to gather information about the current status or condition of a group or phenomenon without making any causal inferences. Descriptive research design is useful in the following situations:
- Exploratory research: Descriptive research design is often used in exploratory research to gain an initial understanding of a phenomenon or population.
- Identifying trends: Descriptive research design can be used to identify trends or patterns in a population, such as changes in consumer behavior or attitudes over time.
- Market research: Descriptive research design is commonly used in market research to understand consumer preferences, behavior, and attitudes.
- Health research: Descriptive research design is useful in health research to describe the prevalence and distribution of a disease or health condition in a population.
- Social science research: Descriptive research design is used in social science research to describe social phenomena such as cultural norms, values, and beliefs.
- Educational research: Descriptive research design is used in educational research to describe the performance of students, schools, or educational programs.
Purpose of Descriptive Research Design
The main purpose of descriptive research design is to describe and measure the characteristics of a population or phenomenon in a systematic and objective manner. It involves collecting data that describe the current status or condition of the population or phenomenon of interest, without manipulating or altering any variables.
The purpose of descriptive research design can be summarized as follows:
- To provide an accurate description of a population or phenomenon: Descriptive research design aims to provide a comprehensive and accurate description of a population or phenomenon of interest. This can help researchers to develop a better understanding of the characteristics of the population or phenomenon.
- To identify trends and patterns: Descriptive research design can help researchers to identify trends and patterns in the data, such as changes in behavior or attitudes over time. This can be useful for making predictions and developing strategies.
- To generate hypotheses: Descriptive research design can be used to generate hypotheses or research questions that can be tested in future studies. For example, if a descriptive study finds a correlation between two variables, this could lead to the development of a hypothesis about the causal relationship between the variables.
- To establish a baseline: Descriptive research design can establish a baseline or starting point for future research. This can be useful for comparing data from different time periods or populations.
Characteristics of Descriptive Research Design
Descriptive research design has several key characteristics that distinguish it from other research designs. Some of the main characteristics of descriptive research design are:
- Objective : Descriptive research design is objective in nature, which means that it focuses on collecting factual and accurate data without any personal bias. The researcher aims to report the data objectively without any personal interpretation.
- Non-experimental: Descriptive research design is non-experimental, which means that the researcher does not manipulate any variables. The researcher simply observes and records the behavior or characteristics of the population or phenomenon of interest.
- Quantitative : Descriptive research design is quantitative in nature, which means that it involves collecting numerical data that can be analyzed using statistical techniques. This helps to provide a more precise and accurate description of the population or phenomenon.
- Cross-sectional: Descriptive research design is often cross-sectional, which means that the data is collected at a single point in time. This can be useful for understanding the current state of the population or phenomenon, but it may not provide information about changes over time.
- Large sample size: Descriptive research design typically involves a large sample size, which helps to ensure that the data is representative of the population of interest. A large sample size also helps to increase the reliability and validity of the data.
- Systematic and structured: Descriptive research design involves a systematic and structured approach to data collection, which helps to ensure that the data is accurate and reliable. This involves using standardized procedures for data collection, such as surveys, questionnaires, or observation checklists.
Advantages of Descriptive Research Design
Descriptive research design has several advantages that make it a popular choice for researchers. Some of the main advantages of descriptive research design are:
- Provides an accurate description: Descriptive research design is focused on accurately describing the characteristics of a population or phenomenon. This can help researchers to develop a better understanding of the subject of interest.
- Easy to conduct: Descriptive research design is relatively easy to conduct and requires minimal resources compared to other research designs. It can be conducted quickly and efficiently, and data can be collected through surveys, questionnaires, or observations.
- Useful for generating hypotheses: Descriptive research design can be used to generate hypotheses or research questions that can be tested in future studies. For example, if a descriptive study finds a correlation between two variables, this could lead to the development of a hypothesis about the causal relationship between the variables.
- Large sample size : Descriptive research design typically involves a large sample size, which helps to ensure that the data is representative of the population of interest. A large sample size also helps to increase the reliability and validity of the data.
- Can be used to monitor changes : Descriptive research design can be used to monitor changes over time in a population or phenomenon. This can be useful for identifying trends and patterns, and for making predictions about future behavior or attitudes.
- Can be used in a variety of fields : Descriptive research design can be used in a variety of fields, including social sciences, healthcare, business, and education.
Limitation of Descriptive Research Design
Descriptive research design also has some limitations that researchers should consider before using this design. Some of the main limitations of descriptive research design are:
- Cannot establish cause and effect: Descriptive research design cannot establish cause and effect relationships between variables. It only provides a description of the characteristics of the population or phenomenon of interest.
- Limited generalizability: The results of a descriptive study may not be generalizable to other populations or situations. This is because descriptive research design often involves a specific sample or situation, which may not be representative of the broader population.
- Potential for bias: Descriptive research design can be subject to bias, particularly if the researcher is not objective in their data collection or interpretation. This can lead to inaccurate or incomplete descriptions of the population or phenomenon of interest.
- Limited depth: Descriptive research design may provide a superficial description of the population or phenomenon of interest. It does not delve into the underlying causes or mechanisms behind the observed behavior or characteristics.
- Limited utility for theory development: Descriptive research design may not be useful for developing theories about the relationship between variables. It only provides a description of the variables themselves.
- Relies on self-report data: Descriptive research design often relies on self-report data, such as surveys or questionnaires. This type of data may be subject to biases, such as social desirability bias or recall bias.
About the author
Muhammad Hassan
Researcher, Academic Writer, Web developer
You may also like

Questionnaire – Definition, Types, and Examples

Case Study – Methods, Examples and Guide

Observational Research – Methods and Guide

Quantitative Research – Methods, Types and...

Qualitative Research Methods

Explanatory Research – Types, Methods, Guide
An official website of the United States government
The .gov means it’s official. Federal government websites often end in .gov or .mil. Before sharing sensitive information, make sure you’re on a federal government site.
The site is secure. The https:// ensures that you are connecting to the official website and that any information you provide is encrypted and transmitted securely.
- Publications
- Account settings
Preview improvements coming to the PMC website in October 2024. Learn More or Try it out now .
- Advanced Search
- Journal List
- Perspect Clin Res
- v.10(1); Jan-Mar 2019
Study designs: Part 2 – Descriptive studies
Rakesh aggarwal.
Department of Gastroenterology, Sanjay Gandhi Postgraduate Institute of Medical Sciences, Lucknow, Uttar Pradesh, India
Priya Ranganathan
1 Department of Anaesthesiology, Tata Memorial Centre, Mumbai, Maharashtra, India
One of the first steps in planning a research study is the choice of study design. The available study designs are divided broadly into two types – observational and interventional. Of the various observational study designs, the descriptive design is the simplest. It allows the researcher to study and describe the distribution of one or more variables, without regard to any causal or other hypotheses. This article discusses the subtypes of descriptive study design, and their strengths and limitations.
INTRODUCTION
In our previous article in this series,[ 1 ] we introduced the concept of “study designs”– as “the set of methods and procedures used to collect and analyze data on variables specified in a particular research question.” Study designs are primarily of two types – observational and interventional, with the former being loosely divided into “descriptive” and “analytical.” In this article, we discuss the descriptive study designs.
WHAT IS A DESCRIPTIVE STUDY?
A descriptive study is one that is designed to describe the distribution of one or more variables, without regard to any causal or other hypothesis.
TYPES OF DESCRIPTIVE STUDIES
Descriptive studies can be of several types, namely, case reports, case series, cross-sectional studies, and ecological studies. In the first three of these, data are collected on individuals, whereas the last one uses aggregated data for groups.
Case reports and case series
A case report refers to the description of a patient with an unusual disease or with simultaneous occurrence of more than one condition. A case series is similar, except that it is an aggregation of multiple (often only a few) similar cases. Many case reports and case series are anecdotal and of limited value. However, some of these bring to the fore a hitherto unrecognized disease and play an important role in advancing medical science. For instance, HIV/AIDS was first recognized through a case report of disseminated Kaposi's sarcoma in a young homosexual man,[ 2 ] and a case series of such men with Pneumocystis carinii pneumonia.[ 3 ]
In other cases, description of a chance observation may open an entirely new line of investigation. Some examples include: fatal disseminated Bacillus Calmette–Guérin infection in a baby born to a mother taking infliximab for Crohn's disease suggesting that adminstration of infliximab may bring about reactivation of tuberculosis,[ 4 ] progressive multifocal leukoencephalopathy following natalizumab treatment – describing a new adverse effect of drugs that target cell adhesion molecule α4-integrin,[ 5 ] and demonstration of a tumor caused by invasive transformed cancer cells from a colonizing tapeworm in an HIV-infected person.[ 6 ]

Cross-sectional studies
Studies with a cross-sectional study design involve the collection of information on the presence or level of one or more variables of interest (health-related characteristic), whether exposure (e.g., a risk factor) or outcome (e.g., a disease) as they exist in a defined population at one particular time. If these data are analyzed only to determine the distribution of one or more variables, these are “descriptive.” However, often, in a cross-sectional study, the investigator also assesses the relationship between the presence of an exposure and that of an outcome. Such cross-sectional studies are referred to as “analytical” and will be discussed in the next article in this series.
Cross-sectional studies can be thought of as providing a “snapshot” of the frequency and characteristics of a disease in a population at a particular point in time. These are very good for measuring the prevalence of a disease or of a risk factor in a population. Thus, these are very helpful in assessing the disease burden and healthcare needs.
Let us look at a study that was aimed to assess the prevalence of myopia among Indian children.[ 7 ] In this study, trained health workers visited schools in Delhi and tested visual acuity in all children studying in classes 1–9. Of the 9884 children screened, 1297 (13.1%) had myopia (defined as spherical refractive error of −0.50 diopters (D) or worse in either or both eyes), and the mean myopic error was −1.86 ± 1.4 D. Furthermore, overall, 322 (3.3%), 247 (2.5%) and 3 children had mild, moderate, and severe visual impairment, respectively. These parts of the study looked at the prevalence and degree of myopia or of visual impairment, and did not assess the relationship of one variable with another or test a causative hypothesis – these qualify as a descriptive cross-sectional study. These data would be helpful to a health planner to assess the need for a school eye health program, and to know the proportion of children in her jurisdiction who would need corrective glasses.
The authors did, subsequently in the paper, look at the relationship of myopia (an outcome) with children's age, gender, socioeconomic status, type of school, mother's education, etc. (each of which qualifies as an exposure). Those parts of the paper look at the relationship between different variables and thus qualify as having “analytical” cross-sectional design.
Sometimes, cross-sectional studies are repeated after a time interval in the same population (using the same subjects as were included in the initial study, or a fresh sample) to identify temporal trends in the occurrence of one or more variables, and to determine the incidence of a disease (i.e., number of new cases) or its natural history. Indeed, the investigators in the myopia study above visited the same children and reassessed them a year later. This separate follow-up study[ 8 ] showed that “new” myopia had developed in 3.4% of children (incidence rate), with a mean change of −1.09 ± 0.55 D. Among those with myopia at the time of the initial survey, 49.2% showed progression of myopia with a mean change of −0.27 ± 0.42 D.
Cross-sectional studies are usually simple to do and inexpensive. Furthermore, these usually do not pose much of a challenge from an ethics viewpoint.
However, this design does carry a risk of bias, i.e., the results of the study may not represent the true situation in the population. This could arise from either selection bias or measurement bias. The former relates to differences between the population and the sample studied. The myopia study included only those children who attended school, and the prevalence of myopia could have been different in those did not attend school (e.g., those with severe myopia may not be able to see the blackboard and hence may have been more likely to drop out of school). The measurement bias in this study would relate to the accuracy of measurement and the cutoff used. If the investigators had used a cutoff of −0.25 D (instead of −0.50 D) to define myopia, the prevalence would have been higher. Furthermore, if the measurements were not done accurately, some cases with myopia could have been missed, or vice versa, affecting the study results.
Ecological studies
Ecological (also sometimes called as correlational) study design involves looking for association between an exposure and an outcome across populations rather than in individuals. For instance, a study in the United States found a relation between household firearm ownership in various states and the firearm death rates during the period 2007–2010.[ 9 ] Thus, in this study, the unit of assessment was a state and not an individual.
These studies are convenient to do since the data have often already been collected and are available from a reliable source. This design is particularly useful when the differences in exposure between individuals within a group are much smaller than the differences in exposure between groups. For instance, the intake of particular food items is likely to vary less between people in a particular group but can vary widely across groups, for example, people living in different countries.
However, the ecological study design has some important limitations.First, an association between exposure and outcome at the group level may not be true at the individual level (a phenomenon also referred to as “ecological fallacy”).[ 10 ] Second, the association may be related to a third factor which in turn is related to both the exposure and the outcome, the so-called “confounding”. For instance, an ecological association between higher income level and greater cardiovascular mortality across countries may be related to a higher prevalence of obesity. Third, migration of people between regions with different exposure levels may also introduce an error. A fourth consideration may be the use of differing definitions for exposure, outcome or both in different populations.
Descriptive studies, irrespective of the subtype, are often very easy to conduct. For case reports, case series, and ecological studies, the data are already available. For cross-sectional studies, these can be easily collected (usually in one encounter). Thus, these study designs are often inexpensive, quick and do not need too much effort. Furthermore, these studies often do not face serious ethics scrutiny, except if the information sought to be collected is of confidential nature (e.g., sexual practices, substance use, etc.).
Descriptive studies are useful for estimating the burden of disease (e.g., prevalence or incidence) in a population. This information is useful for resource planning. For instance, information on prevalence of cataract in a city may help the government decide on the appropriate number of ophthalmologic facilities. Data from descriptive studies done in different populations or done at different times in the same population may help identify geographic variation and temporal change in the frequency of disease. This may help generate hypotheses regarding the cause of the disease, which can then be verified using another, more complex design.
DISADVANTAGES
As with other study designs, descriptive studies have their own pitfalls. Case reports and case-series refer to a solitary patient or to only a few cases, who may represent a chance occurrence. Hence, conclusions based on these run the risk of being non-representative, and hence unreliable. In cross-sectional studies, the validity of results is highly dependent on whether the study sample is well representative of the population proposed to be studied, and whether all the individual measurements were made using an accurate and identical tool, or not. If the information on a variable cannot be obtained accurately, for instance in a study where the participants are asked about socially unacceptable (e.g., promiscuity) or illegal (e.g., substance use) behavior, the results are unlikely to be reliable.
Financial support and sponsorship
Conflicts of interest.
There are no conflicts of interest.
- Descriptive Research Designs: Types, Examples & Methods

One of the components of research is getting enough information about the research problem—the what, how, when and where answers, which is why descriptive research is an important type of research. It is very useful when conducting research whose aim is to identify characteristics, frequencies, trends, correlations, and categories.
This research method takes a problem with little to no relevant information and gives it a befitting description using qualitative and quantitative research method s. Descriptive research aims to accurately describe a research problem.
In the subsequent sections, we will be explaining what descriptive research means, its types, examples, and data collection methods.
What is Descriptive Research?
Descriptive research is a type of research that describes a population, situation, or phenomenon that is being studied. It focuses on answering the how, what, when, and where questions If a research problem, rather than the why.
This is mainly because it is important to have a proper understanding of what a research problem is about before investigating why it exists in the first place.
For example, an investor considering an investment in the ever-changing Amsterdam housing market needs to understand what the current state of the market is, how it changes (increasing or decreasing), and when it changes (time of the year) before asking for the why. This is where descriptive research comes in.
What Are The Types of Descriptive Research?
Descriptive research is classified into different types according to the kind of approach that is used in conducting descriptive research. The different types of descriptive research are highlighted below:
- Descriptive-survey
Descriptive survey research uses surveys to gather data about varying subjects. This data aims to know the extent to which different conditions can be obtained among these subjects.
For example, a researcher wants to determine the qualification of employed professionals in Maryland. He uses a survey as his research instrument , and each item on the survey related to qualifications is subjected to a Yes/No answer.
This way, the researcher can describe the qualifications possessed by the employed demographics of this community.
- Descriptive-normative survey
This is an extension of the descriptive survey, with the addition being the normative element. In the descriptive-normative survey, the results of the study should be compared with the norm.
For example, an organization that wishes to test the skills of its employees by a team may have them take a skills test. The skills tests are the evaluation tool in this case, and the result of this test is compared with the norm of each role.
If the score of the team is one standard deviation above the mean, it is very satisfactory, if within the mean, satisfactory, and one standard deviation below the mean is unsatisfactory.
- Descriptive-status
This is a quantitative description technique that seeks to answer questions about real-life situations. For example, a researcher researching the income of the employees in a company, and the relationship with their performance.
A survey will be carried out to gather enough data about the income of the employees, then their performance will be evaluated and compared to their income. This will help determine whether a higher income means better performance and low income means lower performance or vice versa.
- Descriptive-analysis
The descriptive-analysis method of research describes a subject by further analyzing it, which in this case involves dividing it into 2 parts. For example, the HR personnel of a company that wishes to analyze the job role of each employee of the company may divide the employees into the people that work at the Headquarters in the US and those that work from Oslo, Norway office.
A questionnaire is devised to analyze the job role of employees with similar salaries and who work in similar positions.
- Descriptive classification
This method is employed in biological sciences for the classification of plants and animals. A researcher who wishes to classify the sea animals into different species will collect samples from various search stations, then classify them accordingly.
- Descriptive-comparative
In descriptive-comparative research, the researcher considers 2 variables that are not manipulated, and establish a formal procedure to conclude that one is better than the other. For example, an examination body wants to determine the better method of conducting tests between paper-based and computer-based tests.
A random sample of potential participants of the test may be asked to use the 2 different methods, and factors like failure rates, time factors, and others will be evaluated to arrive at the best method.
- Correlative Survey
Correlative surveys are used to determine whether the relationship between 2 variables is positive, negative, or neutral. That is, if 2 variables say X and Y are directly proportional, inversely proportional or are not related to each other.
Examples of Descriptive Research
There are different examples of descriptive research, that may be highlighted from its types, uses, and applications. However, we will be restricting ourselves to only 3 distinct examples in this article.
- Comparing Student Performance:
An academic institution may wish 2 compare the performance of its junior high school students in English language and Mathematics. This may be used to classify students based on 2 major groups, with one group going ahead to study while courses, while the other study courses in the Arts & Humanities field.
Students who are more proficient in mathematics will be encouraged to go into STEM and vice versa. Institutions may also use this data to identify students’ weak points and work on ways to assist them.
- Scientific Classification
During the major scientific classification of plants, animals, and periodic table elements, the characteristics and components of each subject are evaluated and used to determine how they are classified.
For example, living things may be classified into kingdom Plantae or kingdom animal is depending on their nature. Further classification may group animals into mammals, pieces, vertebrae, invertebrae, etc.
All these classifications are made a result of descriptive research which describes what they are.
- Human Behavior
When studying human behaviour based on a factor or event, the researcher observes the characteristics, behaviour, and reaction, then use it to conclude. A company willing to sell to its target market needs to first study the behaviour of the market.
This may be done by observing how its target reacts to a competitor’s product, then use it to determine their behaviour.
What are the Characteristics of Descriptive Research?
The characteristics of descriptive research can be highlighted from its definition, applications, data collection methods, and examples. Some characteristics of descriptive research are:
- Quantitativeness
Descriptive research uses a quantitative research method by collecting quantifiable information to be used for statistical analysis of the population sample. This is very common when dealing with research in the physical sciences.
- Qualitativeness
It can also be carried out using the qualitative research method, to properly describe the research problem. This is because descriptive research is more explanatory than exploratory or experimental.
- Uncontrolled variables
In descriptive research, researchers cannot control the variables like they do in experimental research.
- The basis for further research
The results of descriptive research can be further analyzed and used in other research methods. It can also inform the next line of research, including the research method that should be used.
This is because it provides basic information about the research problem, which may give birth to other questions like why a particular thing is the way it is.
Why Use Descriptive Research Design?
Descriptive research can be used to investigate the background of a research problem and get the required information needed to carry out further research. It is used in multiple ways by different organizations, and especially when getting the required information about their target audience.
- Define subject characteristics :
It is used to determine the characteristics of the subjects, including their traits, behaviour, opinion, etc. This information may be gathered with the use of surveys, which are shared with the respondents who in this case, are the research subjects.
For example, a survey evaluating the number of hours millennials in a community spends on the internet weekly, will help a service provider make informed business decisions regarding the market potential of the community.
- Measure Data Trends
It helps to measure the changes in data over some time through statistical methods. Consider the case of individuals who want to invest in stock markets, so they evaluate the changes in prices of the available stocks to make a decision investment decision.
Brokerage companies are however the ones who carry out the descriptive research process, while individuals can view the data trends and make decisions.
Descriptive research is also used to compare how different demographics respond to certain variables. For example, an organization may study how people with different income levels react to the launch of a new Apple phone.
This kind of research may take a survey that will help determine which group of individuals are purchasing the new Apple phone. Do the low-income earners also purchase the phone, or only the high-income earners do?
Further research using another technique will explain why low-income earners are purchasing the phone even though they can barely afford it. This will help inform strategies that will lure other low-income earners and increase company sales.
- Validate existing conditions
When you are not sure about the validity of an existing condition, you can use descriptive research to ascertain the underlying patterns of the research object. This is because descriptive research methods make an in-depth analysis of each variable before making conclusions.
- Conducted Overtime
Descriptive research is conducted over some time to ascertain the changes observed at each point in time. The higher the number of times it is conducted, the more authentic the conclusion will be.
What are the Disadvantages of Descriptive Research?
- Response and Non-response Bias
Respondents may either decide not to respond to questions or give incorrect responses if they feel the questions are too confidential. When researchers use observational methods, respondents may also decide to behave in a particular manner because they feel they are being watched.
- The researcher may decide to influence the result of the research due to personal opinion or bias towards a particular subject. For example, a stockbroker who also has a business of his own may try to lure investors into investing in his own company by manipulating results.
- A case-study or sample taken from a large population is not representative of the whole population.
- Limited scope:The scope of descriptive research is limited to the what of research, with no information on why thereby limiting the scope of the research.
What are the Data Collection Methods in Descriptive Research?
There are 3 main data collection methods in descriptive research, namely; observational method, case study method, and survey research.
1. Observational Method
The observational method allows researchers to collect data based on their view of the behaviour and characteristics of the respondent, with the respondents themselves not directly having an input. It is often used in market research, psychology, and some other social science research to understand human behaviour.
It is also an important aspect of physical scientific research, with it being one of the most effective methods of conducting descriptive research . This process can be said to be either quantitative or qualitative.
Quantitative observation involved the objective collection of numerical data , whose results can be analyzed using numerical and statistical methods.
Qualitative observation, on the other hand, involves the monitoring of characteristics and not the measurement of numbers. The researcher makes his observation from a distance, records it, and is used to inform conclusions.
2. Case Study Method
A case study is a sample group (an individual, a group of people, organizations, events, etc.) whose characteristics are used to describe the characteristics of a larger group in which the case study is a subgroup. The information gathered from investigating a case study may be generalized to serve the larger group.
This generalization, may, however, be risky because case studies are not sufficient to make accurate predictions about larger groups. Case studies are a poor case of generalization.
3. Survey Research
This is a very popular data collection method in research designs. In survey research, researchers create a survey or questionnaire and distribute it to respondents who give answers.
Generally, it is used to obtain quick information directly from the primary source and also conducting rigorous quantitative and qualitative research. In some cases, survey research uses a blend of both qualitative and quantitative strategies.
Survey research can be carried out both online and offline using the following methods
- Online Surveys: This is a cheap method of carrying out surveys and getting enough responses. It can be carried out using Formplus, an online survey builder. Formplus has amazing tools and features that will help increase response rates.
- Offline Surveys: This includes paper forms, mobile offline forms , and SMS-based forms.
What Are The Differences Between Descriptive and Correlational Research?
Before going into the differences between descriptive and correlation research, we need to have a proper understanding of what correlation research is about. Therefore, we will be giving a summary of the correlation research below.
Correlational research is a type of descriptive research, which is used to measure the relationship between 2 variables, with the researcher having no control over them. It aims to find whether there is; positive correlation (both variables change in the same direction), negative correlation (the variables change in the opposite direction), or zero correlation (there is no relationship between the variables).
Correlational research may be used in 2 situations;
(i) when trying to find out if there is a relationship between two variables, and
(ii) when a causal relationship is suspected between two variables, but it is impractical or unethical to conduct experimental research that manipulates one of the variables.
Below are some of the differences between correlational and descriptive research:
- Definitions :
Descriptive research aims is a type of research that provides an in-depth understanding of the study population, while correlational research is the type of research that measures the relationship between 2 variables.
- Characteristics :
Descriptive research provides descriptive data explaining what the research subject is about, while correlation research explores the relationship between data and not their description.
- Predictions :
Predictions cannot be made in descriptive research while correlation research accommodates the possibility of making predictions.
Descriptive Research vs. Causal Research
Descriptive research and causal research are both research methodologies, however, one focuses on a subject’s behaviors while the latter focuses on a relationship’s cause-and-effect. To buttress the above point, descriptive research aims to describe and document the characteristics, behaviors, or phenomena of a particular or specific population or situation.
It focuses on providing an accurate and detailed account of an already existing state of affairs between variables. Descriptive research answers the questions of “what,” “where,” “when,” and “how” without attempting to establish any causal relationships or explain any underlying factors that might have caused the behavior.
Causal research, on the other hand, seeks to determine cause-and-effect relationships between variables. It aims to point out the factors that influence or cause a particular result or behavior. Causal research involves manipulating variables, controlling conditions or a subgroup, and observing the resulting effects. The primary objective of causal research is to establish a cause-effect relationship and provide insights into why certain phenomena happen the way they do.
Descriptive Research vs. Analytical Research
Descriptive research provides a detailed and comprehensive account of a specific situation or phenomenon. It focuses on describing and summarizing data without making inferences or attempting to explain underlying factors or the cause of the factor.
It is primarily concerned with providing an accurate and objective representation of the subject of research. While analytical research goes beyond the description of the phenomena and seeks to analyze and interpret data to discover if there are patterns, relationships, or any underlying factors.
It examines the data critically, applies statistical techniques or other analytical methods, and draws conclusions based on the discovery. Analytical research also aims to explore the relationships between variables and understand the underlying mechanisms or processes involved.
Descriptive Research vs. Exploratory Research
Descriptive research is a research method that focuses on providing a detailed and accurate account of a specific situation, group, or phenomenon. This type of research describes the characteristics, behaviors, or relationships within the given context without looking for an underlying cause.
Descriptive research typically involves collecting and analyzing quantitative or qualitative data to generate descriptive statistics or narratives. Exploratory research differs from descriptive research because it aims to explore and gain firsthand insights or knowledge into a relatively unexplored or poorly understood topic.
It focuses on generating ideas, hypotheses, or theories rather than providing definitive answers. Exploratory research is often conducted at the early stages of a research project to gather preliminary information and identify key variables or factors for further investigation. It involves open-ended interviews, observations, or small-scale surveys to gather qualitative data.
Read More – Exploratory Research: What are its Method & Examples?
Descriptive Research vs. Experimental Research
Descriptive research aims to describe and document the characteristics, behaviors, or phenomena of a particular population or situation. It focuses on providing an accurate and detailed account of the existing state of affairs.
Descriptive research typically involves collecting data through surveys, observations, or existing records and analyzing the data to generate descriptive statistics or narratives. It does not involve manipulating variables or establishing cause-and-effect relationships.
Experimental research, on the other hand, involves manipulating variables and controlling conditions to investigate cause-and-effect relationships. It aims to establish causal relationships by introducing an intervention or treatment and observing the resulting effects.
Experimental research typically involves randomly assigning participants to different groups, such as control and experimental groups, and measuring the outcomes. It allows researchers to control for confounding variables and draw causal conclusions.
Related – Experimental vs Non-Experimental Research: 15 Key Differences
Descriptive Research vs. Explanatory Research
Descriptive research focuses on providing a detailed and accurate account of a specific situation, group, or phenomenon. It aims to describe the characteristics, behaviors, or relationships within the given context.
Descriptive research is primarily concerned with providing an objective representation of the subject of study without explaining underlying causes or mechanisms. Explanatory research seeks to explain the relationships between variables and uncover the underlying causes or mechanisms.
It goes beyond description and aims to understand the reasons or factors that influence a particular outcome or behavior. Explanatory research involves analyzing data, conducting statistical analyses, and developing theories or models to explain the observed relationships.
Descriptive Research vs. Inferential Research
Descriptive research focuses on describing and summarizing data without making inferences or generalizations beyond the specific sample or population being studied. It aims to provide an accurate and objective representation of the subject of study.
Descriptive research typically involves analyzing data to generate descriptive statistics, such as means, frequencies, or percentages, to describe the characteristics or behaviors observed.
Inferential research, however, involves making inferences or generalizations about a larger population based on a smaller sample.
It aims to draw conclusions about the population characteristics or relationships by analyzing the sample data. Inferential research uses statistical techniques to estimate population parameters, test hypotheses, and determine the level of confidence or significance in the findings.
Related – Inferential Statistics: Definition, Types + Examples
Conclusion
The uniqueness of descriptive research partly lies in its ability to explore both quantitative and qualitative research methods. Therefore, when conducting descriptive research, researchers have the opportunity to use a wide variety of techniques that aids the research process.
Descriptive research explores research problems in-depth, beyond the surface level thereby giving a detailed description of the research subject. That way, it can aid further research in the field, including other research methods .
It is also very useful in solving real-life problems in various fields of social science, physical science, and education.

Connect to Formplus, Get Started Now - It's Free!
- descriptive research
- descriptive research method
- example of descriptive research
- types of descriptive research
- busayo.longe

You may also like:
Acceptance Sampling: Meaning, Examples, When to Use
In this post, we will discuss extensively what acceptance sampling is and when it is applied.

Cross-Sectional Studies: Types, Pros, Cons & Uses
In this article, we’ll look at what cross-sectional studies are, how it applies to your research and how to use Formplus to collect...
Type I vs Type II Errors: Causes, Examples & Prevention
This article will discuss the two different types of errors in hypothesis testing and how you can prevent them from occurring in your research
Extrapolation in Statistical Research: Definition, Examples, Types, Applications
In this article we’ll look at the different types and characteristics of extrapolation, plus how it contrasts to interpolation.
Formplus - For Seamless Data Collection
Collect data the right way with a versatile data collection tool. try formplus and transform your work productivity today..
Have a language expert improve your writing
Run a free plagiarism check in 10 minutes, generate accurate citations for free.
- Knowledge Base
Methodology
- What Is a Research Design | Types, Guide & Examples
What Is a Research Design | Types, Guide & Examples
Published on June 7, 2021 by Shona McCombes . Revised on November 20, 2023 by Pritha Bhandari.
A research design is a strategy for answering your research question using empirical data. Creating a research design means making decisions about:
- Your overall research objectives and approach
- Whether you’ll rely on primary research or secondary research
- Your sampling methods or criteria for selecting subjects
- Your data collection methods
- The procedures you’ll follow to collect data
- Your data analysis methods
A well-planned research design helps ensure that your methods match your research objectives and that you use the right kind of analysis for your data.
Table of contents
Step 1: consider your aims and approach, step 2: choose a type of research design, step 3: identify your population and sampling method, step 4: choose your data collection methods, step 5: plan your data collection procedures, step 6: decide on your data analysis strategies, other interesting articles, frequently asked questions about research design.
- Introduction
Before you can start designing your research, you should already have a clear idea of the research question you want to investigate.
There are many different ways you could go about answering this question. Your research design choices should be driven by your aims and priorities—start by thinking carefully about what you want to achieve.
The first choice you need to make is whether you’ll take a qualitative or quantitative approach.
Qualitative research designs tend to be more flexible and inductive , allowing you to adjust your approach based on what you find throughout the research process.
Quantitative research designs tend to be more fixed and deductive , with variables and hypotheses clearly defined in advance of data collection.
It’s also possible to use a mixed-methods design that integrates aspects of both approaches. By combining qualitative and quantitative insights, you can gain a more complete picture of the problem you’re studying and strengthen the credibility of your conclusions.
Practical and ethical considerations when designing research
As well as scientific considerations, you need to think practically when designing your research. If your research involves people or animals, you also need to consider research ethics .
- How much time do you have to collect data and write up the research?
- Will you be able to gain access to the data you need (e.g., by travelling to a specific location or contacting specific people)?
- Do you have the necessary research skills (e.g., statistical analysis or interview techniques)?
- Will you need ethical approval ?
At each stage of the research design process, make sure that your choices are practically feasible.
Receive feedback on language, structure, and formatting
Professional editors proofread and edit your paper by focusing on:
- Academic style
- Vague sentences
- Style consistency
See an example

Within both qualitative and quantitative approaches, there are several types of research design to choose from. Each type provides a framework for the overall shape of your research.
Types of quantitative research designs
Quantitative designs can be split into four main types.
- Experimental and quasi-experimental designs allow you to test cause-and-effect relationships
- Descriptive and correlational designs allow you to measure variables and describe relationships between them.
With descriptive and correlational designs, you can get a clear picture of characteristics, trends and relationships as they exist in the real world. However, you can’t draw conclusions about cause and effect (because correlation doesn’t imply causation ).
Experiments are the strongest way to test cause-and-effect relationships without the risk of other variables influencing the results. However, their controlled conditions may not always reflect how things work in the real world. They’re often also more difficult and expensive to implement.
Types of qualitative research designs
Qualitative designs are less strictly defined. This approach is about gaining a rich, detailed understanding of a specific context or phenomenon, and you can often be more creative and flexible in designing your research.
The table below shows some common types of qualitative design. They often have similar approaches in terms of data collection, but focus on different aspects when analyzing the data.
Your research design should clearly define who or what your research will focus on, and how you’ll go about choosing your participants or subjects.
In research, a population is the entire group that you want to draw conclusions about, while a sample is the smaller group of individuals you’ll actually collect data from.
Defining the population
A population can be made up of anything you want to study—plants, animals, organizations, texts, countries, etc. In the social sciences, it most often refers to a group of people.
For example, will you focus on people from a specific demographic, region or background? Are you interested in people with a certain job or medical condition, or users of a particular product?
The more precisely you define your population, the easier it will be to gather a representative sample.
- Sampling methods
Even with a narrowly defined population, it’s rarely possible to collect data from every individual. Instead, you’ll collect data from a sample.
To select a sample, there are two main approaches: probability sampling and non-probability sampling . The sampling method you use affects how confidently you can generalize your results to the population as a whole.
Probability sampling is the most statistically valid option, but it’s often difficult to achieve unless you’re dealing with a very small and accessible population.
For practical reasons, many studies use non-probability sampling, but it’s important to be aware of the limitations and carefully consider potential biases. You should always make an effort to gather a sample that’s as representative as possible of the population.
Case selection in qualitative research
In some types of qualitative designs, sampling may not be relevant.
For example, in an ethnography or a case study , your aim is to deeply understand a specific context, not to generalize to a population. Instead of sampling, you may simply aim to collect as much data as possible about the context you are studying.
In these types of design, you still have to carefully consider your choice of case or community. You should have a clear rationale for why this particular case is suitable for answering your research question .
For example, you might choose a case study that reveals an unusual or neglected aspect of your research problem, or you might choose several very similar or very different cases in order to compare them.
Data collection methods are ways of directly measuring variables and gathering information. They allow you to gain first-hand knowledge and original insights into your research problem.
You can choose just one data collection method, or use several methods in the same study.
Survey methods
Surveys allow you to collect data about opinions, behaviors, experiences, and characteristics by asking people directly. There are two main survey methods to choose from: questionnaires and interviews .
Observation methods
Observational studies allow you to collect data unobtrusively, observing characteristics, behaviors or social interactions without relying on self-reporting.
Observations may be conducted in real time, taking notes as you observe, or you might make audiovisual recordings for later analysis. They can be qualitative or quantitative.
Other methods of data collection
There are many other ways you might collect data depending on your field and topic.
If you’re not sure which methods will work best for your research design, try reading some papers in your field to see what kinds of data collection methods they used.
Secondary data
If you don’t have the time or resources to collect data from the population you’re interested in, you can also choose to use secondary data that other researchers already collected—for example, datasets from government surveys or previous studies on your topic.
With this raw data, you can do your own analysis to answer new research questions that weren’t addressed by the original study.
Using secondary data can expand the scope of your research, as you may be able to access much larger and more varied samples than you could collect yourself.
However, it also means you don’t have any control over which variables to measure or how to measure them, so the conclusions you can draw may be limited.
Prevent plagiarism. Run a free check.
As well as deciding on your methods, you need to plan exactly how you’ll use these methods to collect data that’s consistent, accurate, and unbiased.
Planning systematic procedures is especially important in quantitative research, where you need to precisely define your variables and ensure your measurements are high in reliability and validity.
Operationalization
Some variables, like height or age, are easily measured. But often you’ll be dealing with more abstract concepts, like satisfaction, anxiety, or competence. Operationalization means turning these fuzzy ideas into measurable indicators.
If you’re using observations , which events or actions will you count?
If you’re using surveys , which questions will you ask and what range of responses will be offered?
You may also choose to use or adapt existing materials designed to measure the concept you’re interested in—for example, questionnaires or inventories whose reliability and validity has already been established.
Reliability and validity
Reliability means your results can be consistently reproduced, while validity means that you’re actually measuring the concept you’re interested in.
For valid and reliable results, your measurement materials should be thoroughly researched and carefully designed. Plan your procedures to make sure you carry out the same steps in the same way for each participant.
If you’re developing a new questionnaire or other instrument to measure a specific concept, running a pilot study allows you to check its validity and reliability in advance.
Sampling procedures
As well as choosing an appropriate sampling method , you need a concrete plan for how you’ll actually contact and recruit your selected sample.
That means making decisions about things like:
- How many participants do you need for an adequate sample size?
- What inclusion and exclusion criteria will you use to identify eligible participants?
- How will you contact your sample—by mail, online, by phone, or in person?
If you’re using a probability sampling method , it’s important that everyone who is randomly selected actually participates in the study. How will you ensure a high response rate?
If you’re using a non-probability method , how will you avoid research bias and ensure a representative sample?
Data management
It’s also important to create a data management plan for organizing and storing your data.
Will you need to transcribe interviews or perform data entry for observations? You should anonymize and safeguard any sensitive data, and make sure it’s backed up regularly.
Keeping your data well-organized will save time when it comes to analyzing it. It can also help other researchers validate and add to your findings (high replicability ).
On its own, raw data can’t answer your research question. The last step of designing your research is planning how you’ll analyze the data.
Quantitative data analysis
In quantitative research, you’ll most likely use some form of statistical analysis . With statistics, you can summarize your sample data, make estimates, and test hypotheses.
Using descriptive statistics , you can summarize your sample data in terms of:
- The distribution of the data (e.g., the frequency of each score on a test)
- The central tendency of the data (e.g., the mean to describe the average score)
- The variability of the data (e.g., the standard deviation to describe how spread out the scores are)
The specific calculations you can do depend on the level of measurement of your variables.
Using inferential statistics , you can:
- Make estimates about the population based on your sample data.
- Test hypotheses about a relationship between variables.
Regression and correlation tests look for associations between two or more variables, while comparison tests (such as t tests and ANOVAs ) look for differences in the outcomes of different groups.
Your choice of statistical test depends on various aspects of your research design, including the types of variables you’re dealing with and the distribution of your data.
Qualitative data analysis
In qualitative research, your data will usually be very dense with information and ideas. Instead of summing it up in numbers, you’ll need to comb through the data in detail, interpret its meanings, identify patterns, and extract the parts that are most relevant to your research question.
Two of the most common approaches to doing this are thematic analysis and discourse analysis .
There are many other ways of analyzing qualitative data depending on the aims of your research. To get a sense of potential approaches, try reading some qualitative research papers in your field.
If you want to know more about the research process , methodology , research bias , or statistics , make sure to check out some of our other articles with explanations and examples.
- Simple random sampling
- Stratified sampling
- Cluster sampling
- Likert scales
- Reproducibility
Statistics
- Null hypothesis
- Statistical power
- Probability distribution
- Effect size
- Poisson distribution
Research bias
- Optimism bias
- Cognitive bias
- Implicit bias
- Hawthorne effect
- Anchoring bias
- Explicit bias
A research design is a strategy for answering your research question . It defines your overall approach and determines how you will collect and analyze data.
A well-planned research design helps ensure that your methods match your research aims, that you collect high-quality data, and that you use the right kind of analysis to answer your questions, utilizing credible sources . This allows you to draw valid , trustworthy conclusions.
Quantitative research designs can be divided into two main categories:
- Correlational and descriptive designs are used to investigate characteristics, averages, trends, and associations between variables.
- Experimental and quasi-experimental designs are used to test causal relationships .
Qualitative research designs tend to be more flexible. Common types of qualitative design include case study , ethnography , and grounded theory designs.
The priorities of a research design can vary depending on the field, but you usually have to specify:
- Your research questions and/or hypotheses
- Your overall approach (e.g., qualitative or quantitative )
- The type of design you’re using (e.g., a survey , experiment , or case study )
- Your data collection methods (e.g., questionnaires , observations)
- Your data collection procedures (e.g., operationalization , timing and data management)
- Your data analysis methods (e.g., statistical tests or thematic analysis )
A sample is a subset of individuals from a larger population . Sampling means selecting the group that you will actually collect data from in your research. For example, if you are researching the opinions of students in your university, you could survey a sample of 100 students.
In statistics, sampling allows you to test a hypothesis about the characteristics of a population.
Operationalization means turning abstract conceptual ideas into measurable observations.
For example, the concept of social anxiety isn’t directly observable, but it can be operationally defined in terms of self-rating scores, behavioral avoidance of crowded places, or physical anxiety symptoms in social situations.
Before collecting data , it’s important to consider how you will operationalize the variables that you want to measure.
A research project is an academic, scientific, or professional undertaking to answer a research question . Research projects can take many forms, such as qualitative or quantitative , descriptive , longitudinal , experimental , or correlational . What kind of research approach you choose will depend on your topic.
Cite this Scribbr article
If you want to cite this source, you can copy and paste the citation or click the “Cite this Scribbr article” button to automatically add the citation to our free Citation Generator.
McCombes, S. (2023, November 20). What Is a Research Design | Types, Guide & Examples. Scribbr. Retrieved March 28, 2024, from https://www.scribbr.com/methodology/research-design/
Is this article helpful?
Shona McCombes
Other students also liked, guide to experimental design | overview, steps, & examples, how to write a research proposal | examples & templates, ethical considerations in research | types & examples, unlimited academic ai-proofreading.
✔ Document error-free in 5minutes ✔ Unlimited document corrections ✔ Specialized in correcting academic texts
- Preferences

DESCRIPTIVE RESEARCH - PowerPoint PPT Presentation

DESCRIPTIVE RESEARCH
Descriptive research to behold is to look beyond the fact; to observe, to go beyond the observation look at the world of people, and you will be overwhelmed by what ... – powerpoint ppt presentation.
- To behold is to look beyond the fact to observe, to go beyond the observation
- Look at the world of people, and you will be overwhelmed by what you see
- But select from that mass of humanity a well-chosen few, and observe them with insight, and they will tell you more than all the multitudes together
- Involves either identifying the characteristics of an observed phenomenon or exploring possible correlations among two or more phenomena
- In every case, descriptive research examines a situation AS IT IS
- It does not involve changing or modifying the situation under investigation, nor is it intended to determine cause-and-effect relationships
- Strategies include sampling, making observations, interviewing take on a very different form when we want them to yield quantitative data
- Include observation studies, correlational research, developmental designs, and survey research
- All of these approaches yield quantitative information that can be summarized through statistical analyses
- Survey research is the most frequently used in all disciplines
- In qualitative studies, observations are usually recorded in great detail, perhaps with fieldnotes or videotapes that capture the wide variety of ways in which people act and interact
- From these data, the researcher constructs a complex yet integrated picture of how people spend their time
- In quantitative research, an observation study is quite different
- Typically, the focus is on a particular aspect of behaviour
- Furthermore, the behaviour is quantified in some way
- In some situations, each occurrence of the behaviour is counted to determine its overall frequency
- In other situations, the behaviour is rated for accuracy, intensity, maturity, or some other dimension
- But regardless of approach, the researcher strives to be as objective as possible in assessing the behaviour being studied
- To maintain such objectivity, he or she is likely to use strategies such as the following
- 1) Define the behaviour being studied in a precise, concrete manner so that the behaviour is easily recognised when it occurs
- 2) Divide the observation period into small segments and then record whether the behaviour does or does not occur during each segment
- 3) Use a rating scale to evaluate the behaviour in terms of specific dimensions
- 4) Have two or three people rate the same behaviour independently, without knowledge of one anothers ratings
- 5) Train the rater(s) to follow specific criteria when counting or evaluating the behaviour, and continue training until consistent ratings are obtained for any single occurrence of the behaviour
- Despite the extensive investment (time and energy), an observational study can yield data that portray much of the richness and complexity of human behaviour
- In some situations, then, it provides a quantitative alternative to such approaches as ethnographies and grounded theory studies
- A correlational study examines the extent to which differences in one characteristic or variable are related to differences in one or more other characteristics or variables
- A correlation exists if, when one variable increases, another variable either increases or decreases in a somewhat predictable fashion
- Simple correlation researchers gather data about two or more characteristics numbers that reflect specific measurements of the characteristics in question test scores, CGPAs, ratings,
- Each has two numbers, used to calculate correlation coefficient (r)
- If perfectly correlated r 1.00 or r -1.00
- If unrelated or remotely related, r is close to 0
- Moderate correlations are common
- Examining only two variables helpful to plot on scatterplot (also known as scattergram) to allow a visual inspection of the relationship between the two variables
- Refer to page 181 of the textbook for the scatterplot
- The diagonal line running through the middle of the dots is called the line of regression reflects a hypothetical perfect correlation
- If all the dots fell exactly on this line, r would be 1.00, dots below the line show children whose reading level is advanced for their age, and dots above the line show children who are lagging a bit in reading
- Can make 3 statements from the scatterplot.
- 1) Can describe the homogeneity or heterogeneity of the two variables (the extent to which the children are similar to or different from one another with respect to age and reading level. Eg. group of only age 6 and 7 has greater homogeneity than group of age 6 - 13)
- 2) Can describe the degree to which the two variables are intercorrelated by computing the correlation coefficient r
- 3) The most important, we can interpret the data and give them meaning childrens reading level improves as they grow older, without hesitation as shown by the upward trend of the dots from left to right
- In all correlational studies, be alert for faulty logic
- Correlation does not, in and of itself, indicate causation
- Although in some cases, influence may indeed be present, for example, chronological age influences mental development, including their reading ability
- But ultimately we can never infer a cause-and-effect relationship on the basis of correlation alone
- One variable correlates meaningfully with another only when a common causal bond links the phenomena of both variables in a logical relationship
- Increase in the population of birds in Tasik Serdang has no meaningful relationship with the increase of the population of elephants in Thailand the correlation is simply a fluke and meaningless
- In the example, the faulty logic is readily apparent, yet we often see similarly faulty reasoning proposed in correlational research reports
- Imagine that a researcher finds a correlation between socioeconomic level and academic performance - it would be all too easy to draw the conclusion that socioeconomic status directly affects academic achievement also if we could improve the familys economic status, then the learning ability of the familys children would also improve
- No, no, no! We cannot make an inference about causation on the basis of correlated data alone
- It is possible that salary does have an impact on childrens grades, BUT it is equally possible that it does not
- May be an undetermined third variable influences BOTH the salary and the childrens school performance
- If we were to infer that socioeconomic status directly affects academic achievement, not only would we be going far beyond the data we have, but we would also have trouble accounting for all of the worlds geniuses and intellectual giants, some of whom have been born of indigent parents and grown up in poverty
- The data may not lie, but the causal conclusions we draw from the data may, at times, be extremely suspect
- Nevertheless, a good researcher must not be content to stop at the point of finding a correlational relationship, because beneath the correlation lie some potentially quite interesting data whose interpretation may conceivably lead to the discovery of new and exciting information
- r is just a signpost pointing to further findings
- The forces of the correlated data will determine the ultimate meaning of the correlation
- We will not find correlation if the measurement instruments have poor validity and reliability
- For example, if the reading test used is neither a valid (accurate) nor reliable (consistent) measure of reading achievement, therefore we will not find correlation
- To study how a particular characteristic changes, use either 1) a cross-sectional (X-S) study or 2) a longitudinal (LG) study
- In a cross-sectional study, a developmental psychologist might study the nature of friendships for children at ages 4, 8, 12, and 16. A gerontologist might consider how retired people in their 70s, 80s, and 90s, are most likely to spend their leisure time
- In a longitudinal study, a single group of people is followed over the course of several months or years, and data related to the characteristic(s) under investigation are collected at various times
- For example, an educational psychologist might get measures of academic achievement and social adjustment for a group of Year Four students and then, 10 years later, find out which students had completed high school and which ones had not
- Obviously, cross-sectional studies are easier to conduct than longitudinal studies, because the researcher can collect all the needed data at a single time, and dont have to worry tracking down people
- An additional disadvantage of a longitudinal design is that when people respond repeatedly to the same measurement instrument, they are likely to improve simply because of their practice with the instrument, even if the characteristic being measured hasnt changed at all
- A disadvantage of cross-sectional designs is that the different age groups sampled may have been raised under different environmental conditions
- Groups of 20-year-olds and 70-year-olds different education standards
- A second disadvantage of a cross-sectional design is that we cannot compute correlations between characteristics at different age levels
- Survey means to look or see over or beyond
- Looking or seeing is not restricted to perception through the physical eye only
- Survey research involves acquiring information about one or more groups of people perhaps about their characteristics, opinions, attitudes, or previous experiences by asking them questions and tabulating their answers
- The ultimate goal is to learn about a large population by surveying a sample of that population
- This approach is called a descriptive survey or normative survey
- Reduced to its basic elements, a survey is quite simple in design The researcher poses a series of questions to willing participants summarises their responses with percentages, frequency counts, or more sophisticated statistical indexes and then draws inferences about a particular population from the responses of the sample
- It is a common approach, used with more or less sophistication in many areas of human activity
- This is not to suggest, however, that because of its frequent use, a survey is any less demanding in its design requirements or any easier for the researcher to conduct than any other type of research
- Quite the contrary, the survey design makes critical demands on the researcher that, if not carefully respected, may place the entire research effort in jeopardy
- Survey research captures a fleeting moment in time
- By drawing conclusions from one transitory collection of data, we may extrapolate about the state of affairs over a longer time period
- At best, the extrapolation is a conjecture, and sometimes a hazardous one at that, but it is our only way to generalise from what we see
- So often, survey reports that we read seem to suggest that what the researcher found in one sample population at one particular time can be accepted for all time as a constant
- An additional consideration in survey research is that we are relying on self-report data
- People are telling us what they believe to be true or, perhaps, what they think we want to hear
- Peoples memories for events are often distortions of reality What they think happened isnt always what did happen
- Furthermore, peoples descriptions of their attitudes and opinions are often constructed on the spot often times, they havent really thought about certain issues until a researcher poses a question about them and so may be coloured by recent events or the current context
- An additional problem is that some people may intentionally misrepresent the facts (at least, the facts as they know them) in order to present a favourable impression to the researcher
- Survey research typically employs a face-to-face interview, a telephone interview, or a written questionnaire
- In survey research, interviews are fairly structured
- In a structured interview, the researcher asks a standard set of questions and nothing more
- In a semi-structured interview, the research may follow the standard questions with one or more individually tailored questions to get clarification or probe a persons reasoning
- The interview tends to be informal and friendly in a qualitative study but more formal and emotionally neutral in a quantitative one
- Participants in a qualitative interview may feel as if theyre simply engaging in a friendly chat with the researcher, who is typically someone theyve come to know and trust
- In contrast, participants in survey research are continually aware that, yes, this is an interview, and that the temporary relationship theyve formed with the researcher will end once the interview is complete
- This is not to say, however, that a survey researcher shouldnt strive to establish rapport with participants
- Quite the contrary, the researcher is more likely to gain participants cooperation and encourage them to respond honestly if he or she is likable and friendly and shows a genuine interest in what they have to say
- Face-to-face interviews have the distinct advantage of enabling the researcher to establish rapport with potential participants and therefore gain their cooperation thus, such interviews yield the highest response rates the percentages of people agreeing to participate in survey research
- However, the time and expense involved may be prohibitive if the needed interviewees reside in a variety of states and countries
- Telephone interviews are less time-consuming and less expensive (they involve only the cost of long-distance calls), and the researcher has ready access to virtually anyone on the planet who has a telephone
- Although the response rate is not as high as for a face-to-face interview (many people are apt to be busy, annoyed at being bothered, or otherwise not interested in participating), it is considerably higher than for a mailed questionnaire
- The researcher cannot establish the same kind of rapport that is possible in a face-to-face situation, and the sample will be biased to the extent that people without phones are part of the population about whom the researcher wants to draw inferences
- Personal interviews, whether they be face-to-face or over the telephone, allow the researcher to clarify ambiguous answers and, when appropriate, seek follow-up information
- Because such interviews take time, however, they may not be practical when large sample sizes are important
- Data lie deep within the minds or attitudes, feelings, or reaction of men/women
- Instrument for observing the data beyond the physical reach is the questionnaires since paper-pencil questionnaires can be sent to a large number of people, including those who live thousands of miles away
- Thus, they may save the researcher travel expenses, and postage is typically cheaper than a lengthy long-distance telephone call
- The social scientist who collects data with a questionnaire and the physicist who determines the presence of radioactivity with a Geiger counter are at just about the same degree of remoteness from their respective sources of data Neither sees the source from which the data originate
- The Geiger counter and questionnaires are impersonal probe
- They are governed by practical guidelines
- From the perspective of survey participants, this distance becomes an additional advantage Participants can respond to questions with assurance that their responses will be anonymous, and so they may be more truthful than they would be in a personal interview, particularly when they are talking about sensitive or controversial issues
- Yet questionnaires have their drawbacks as well
- Typically, the majority of people who receive questionnaires dont return them in other words, there may be a low return rate and the people who do return them are not necessarily representative of the originally selected sample
- Even when people are willing participants in a questionnaire study, their responses will reflect their reading and writing skills and, perhaps, their misinterpretation of one or more questions
- Furthermore, by specifying in advance all of the questions that will be asked and thereby eliminating other questions that could be asked about the issue or phenomenon in question the researcher is apt to gain only limited, and possibly distorted, information
- Observation studies look at peoples behaviours, and developmental studies, correlational studies, and survey research frequently use questionnaires to learn about peoples behaviours, characteristics, attitudes, and opinions
- Behaviours and attitudes are often quite complex and so not, at least on the surface, easily evaluated or quantified
- Two techniques that facilitate both evaluation and quantification in such circumstances are the checklist and the rating scale
- A checklist is a list of behaviours, characteristics, or other entities that a researcher is investigating. Either the researcher or participants (depending on the study) simply check(s) whether each item on the list is observed, present, or true or else not observed, present, or true
- A rating scale is more useful when a behaviour, attitude, or other phenomenon of interest needs to be evaluated on a continuum of, say, inadequate to excellent, never to always, or strongly disapprove to strongly approve
- Rating scales were developed by Rensis Likert in the 1930s to assess peoples attitudes accordingly, they are sometimes called Likert scales
- Experts have mixed views about letting respondents remain neutral in interviews and questionnaires
- If you use rating scales in your own research, you should consider the implications of letting your respondentsstraddle the fence by including a no opinion or other neutral response, and design your scales accordingly
- Whenever you use checklists or rating scales, you simplify and more easily quantify peoples behaviours and attitudes
- In the process, however, you may lose valuable information
- Ultimately you will have to determine whether the trade-offs is worth it for the particular research problem you are investigating
- Interviewing involves much more than just asking questions
- The questions for the interview should be carefully planned and precisely worded to yield the kinds of data the researcher needs to answer his or her research question
- Make sure your interviewees are representative of the group
- Find a suitable location
- Get written permission
- Establish and maintain rapport
- Focus on the actual rather than on the abstract or hypothetical
- Dont put words in peoples mouths
- Record responses verbatim
- Keep your reactions to yourself
- Remember that you are not necessarily getting the facts
- But interviews are typically more structured in quantitative studies than they are in qualitative studies. The following are additional guidelines for conducting interviews in quantitative research
- 10. As you write the questions, consider how you can quantify the responses, and modify the questions accordingly. Remember, you are conducting a quantitative study. Thus, you will, to some extent, be coding peoples responses as numbers and, quite possibly, conducting statistical analyses on those numbers. You will be able to assign numerical codes to responses more easily if you identify an appropriate coding scheme ahead of time
- 11. Consider asking questions that will elicit qualitative information as well. You do not necessarily have to quantify everything. Peoples responses to a few open-ended questions may support or provide additional insights into the numerical data you obtain from more structured questions
- 12. Pilot-test the questions. When you plan your interview, you will, of course, be trying hard to develop clear and concise questions. Despite your best intentions, however, you may write questions that are ambiguous or misleading or that yield uninterpretable or otherwise useless responses. You can save yourself a great deal of time over the long run if you fine-tune your questions before you begin data collection. You can easily find the weak spots in your questions by asking a few volunteers to answer them in a pilot study
- 13. Restrict each question to a single idea. Dont try to get too much information in any single question in doing so, you may get multiple kinds of data mixed messages, so to speak that are difficult to interpret
- 14. Save controversial questions for the latter part of the interview. If you will be touching on sensitive topics (e.g., attitudes about AIDS, opinions about gun control), put them near the end of the interview, after you have established rapport and gained the persons trust
- 15. Seek clarifying information when necessary. Be alert for responses that are vague or otherwise difficult to interpret. Simple probes such as Can you tell me more about that? may produce the additional information you need
- Questionnaires seem so simple, yet in our experience they can be tricky to construct and administer
- One false step can lead to uninterpretable data or an abysmally low return rate
- 1. Keep it short. Your questionnaire should be as brief as possible and solicit only that information essential to the research project. You should test every item by two criteria (a) What do I intend to do with the information I am requesting? and (b) Is it absolutely essential to have this information to solve part of the research problem?
- 2. Use simple, clear, unambiguous language. Write questions that communicate exactly what you want to know. Avoid terms that your respondents may not understand, such as obscure words or technical jargon. Also avoid words that do not have precise meanings, such as several and usually
- 3. Check for unwarranted assumptions implicit in your questions. Consider a very simple question
- How many cigarettes do you smoke each day? It seems to be a clear and unambiguous question, especially if we accompany it with certain choices so that all the respondent has to do is to check one of them
- How many cigarettes do you smoke each day? (Check one of the following.)
- ? More than 25 ? 25-16 ? 15-11
- ? 10-6 ? 5-1 ? None
- One obvious assumption here is that the person is a smoker, which probably is not the case for all participants
- A second assumption is that a person smokes the same number of cigarettes each day, but for many smokers, this assumption is not true
- At work, if under pressure, they may be chain smokers and may smoke more
- But at home on weekends and holidays, they may relax and smoke only one or two cigarettes a day or go without smoking at all
- How are the people in this group supposed to answer the above question?
- What box does this type of smoker check?
- First, you have to inspect the assumption underlying the question Does it fit the reality?
- Had the author of the question considered the assumptions on which the question was predicated, he or she might first have asked questions as these
- Do you smoke cigarettes?
PowerShow.com is a leading presentation sharing website. It has millions of presentations already uploaded and available with 1,000s more being uploaded by its users every day. Whatever your area of interest, here you’ll be able to find and view presentations you’ll love and possibly download. And, best of all, it is completely free and easy to use.
You might even have a presentation you’d like to share with others. If so, just upload it to PowerShow.com. We’ll convert it to an HTML5 slideshow that includes all the media types you’ve already added: audio, video, music, pictures, animations and transition effects. Then you can share it with your target audience as well as PowerShow.com’s millions of monthly visitors. And, again, it’s all free.
About the Developers
PowerShow.com is brought to you by CrystalGraphics , the award-winning developer and market-leading publisher of rich-media enhancement products for presentations. Our product offerings include millions of PowerPoint templates, diagrams, animated 3D characters and more.

- Descriptive Research
- Popular Categories
Powerpoint Templates
Icon Bundle
Kpi Dashboard
Professional
Business Plans
Swot Analysis
Gantt Chart
Business Proposal
Marketing Plan
Project Management
Business Case
Business Model
Cyber Security
Business PPT
Digital Marketing
Digital Transformation
Human Resources
Product Management
Artificial Intelligence
Company Profile
Acknowledgement PPT
PPT Presentation
Reports Brochures
One Page Pitch
Interview PPT
All Categories
Powerpoint Templates and Google slides for Descriptive Research
Save your time and attract your audience with our fully editable ppt templates and slides..
Presenting Junior Research Analyst Job Description In Powerpoint And Google Slides Cpb slide which is completely adaptable. The graphics in this PowerPoint slide showcase five stages that will help you succinctly convey the information. In addition, you can alternate the color, font size, font type, and shapes of this PPT layout according to your content. This PPT presentation can be accessed with Google Slides and is available in both standard screen and widescreen aspect ratios. It is also a useful set to elucidate topics like Junior Research Analyst Job Description. This well-structured design can be downloaded in different formats like PDF, JPG, and PNG. So, without any delay, click on the download button now.
Presenting our Descriptive Research Business In Powerpoint And Google Slides Cpb PowerPoint template design. This PowerPoint slide showcases Four stages. It is useful to share insightful information on Descriptive Research Business This PPT slide can be easily accessed in standard screen and widescreen aspect ratios. It is also available in various formats like PDF, PNG, and JPG. Not only this, the PowerPoint slideshow is completely editable and you can effortlessly modify the font size, font type, and shapes according to your wish. Our PPT layout is compatible with Google Slides as well, so download and edit it as per your knowledge.
Presenting Research Analyst Jobs Description In Powerpoint And Google Slides Cpb slide which is completely adaptable. The graphics in this PowerPoint slide showcase three stages that will help you succinctly convey the information. In addition, you can alternate the color, font size, font type, and shapes of this PPT layout according to your content. This PPT presentation can be accessed with Google Slides and is available in both standard screen and widescreen aspect ratios. It is also a useful set to elucidate topics like Research Analyst Jobs Description. This well structured design can be downloaded in different formats like PDF, JPG, and PNG. So, without any delay, click on the download button now.
This slide shows sample of perfect job description that can be used to advertise specific job openings. It include elements such as job title, work location and skills required, etc. Increase audience engagement and knowledge by dispensing information using Recruitment And Selection Process Sample Job Description Format For Research Analyst Position. This template helps you present information on one stages. You can also present information on Work Location, Education And Work Experience, Requirement, Research And Analytics using this PPT design. This layout is completely editable so personaize it now to meet your audiences expectations.
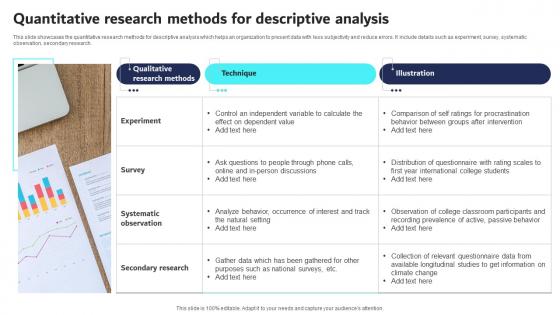
This slide showcases the quantitative research methods for descriptive analysis which helps an organization to present data with less subjectivity and reduce errors. It include details such as experiment, survey, systematic observation, secondary research. Introducing our Quantitative Research Methods For Descriptive Analysis set of slides. The topics discussed in these slides are Qualitative Research Methods, Experiment. This is an immediately available PowerPoint presentation that can be conveniently customized. Download it and convince your audience.
Presenting see job description market research project manager sample ppt files. This is a job description market research project manager sample ppt files. This is a one stage process. The stages in this process are success, job, quality, plan teamwork, concept, strategy, project, management.
Presenting Descriptive Research Designs In Powerpoint And Google Slides Cpb slide which is completely adaptable. The graphics in this PowerPoint slide showcase three stages that will help you succinctly convey the information. In addition, you can alternate the color, font size, font type, and shapes of this PPT layout according to your content. This PPT presentation can be accessed with Google Slides and is available in both standard screen and widescreen aspect ratios. It is also a useful set to elucidate topics like Descriptive Research Designs. This well structured design can be downloaded in different formats like PDF, JPG, and PNG. So, without any delay, click on the download button now.
Presenting our Descriptive Statistics Research Ppt Powerpoint Presentation Summary Infographics Cpb PowerPoint template design. This PowerPoint slide showcases six stages. It is useful to share insightful information on Descriptive Statistics Research This PPT slide can be easily accessed in standard screen and widescreen aspect ratios. It is also available in various formats like PDF, PNG, and JPG. Not only this, the PowerPoint slideshow is completely editable and you can effortlessly modify the font size, font type, and shapes according to your wish. Our PPT layout is compatible with Google Slides as well, so download and edit it as per your knowledge.
Presenting our Descriptive Vs Analytical Research Examples Ppt Powerpoint Presentation Icon Cpb PowerPoint template design. This PowerPoint slide showcases four stages. It is useful to share insightful information on Descriptive Vs Analytical Research Examples. This PPT slide can be easily accessed in standard screen and widescreen aspect ratios. It is also available in various formats like PDF, PNG, and JPG. Not only this, the PowerPoint slideshow is completely editable and you can effortlessly modify the font size, font type, and shapes according to your wish. Our PPT layout is compatible with Google Slides as well, so download and edit it as per your knowledge.
Presenting Descriptive Quantitative Research Ppt Powerpoint Presentation Visual Aids Cpb slide which is completely adaptable. The graphics in this PowerPoint slide showcase seven stages that will help you succinctly convey the information. In addition, you can alternate the color, font size, font type, and shapes of this PPT layout according to your content. This PPT presentation can be accessed with Google Slides and is available in both standard screen and widescreen aspect ratios. It is also a useful set to elucidate topics like Descriptive Quantitative Research. This well structured design can be downloaded in different formats like PDF, JPG, and PNG. So, without any delay, click on the download button now.
Presenting our Data Researcher Job Description In Powerpoint And Google Slides Cpb PowerPoint template design. This PowerPoint slide showcases five stages. It is useful to share insightful information on Data Researcher Job Description This PPT slide can be easily accessed in standard screen and widescreen aspect ratios. It is also available in various formats like PDF, PNG, and JPG. Not only this, the PowerPoint slideshow is completely editable and you can effortlessly modify the font size, font type, and shapes according to your wish. Our PPT layout is compatible with Google Slides as well, so download and edit it as per your knowledge.
Presenting Descriptive Quantitative Research Ppt Powerpoint Presentation Professional Icon Cpb slide which is completely adaptable. The graphics in this PowerPoint slide showcase three stages that will help you succinctly convey the information. In addition, you can alternate the color, font size, font type, and shapes of this PPT layout according to your content. This PPT presentation can be accessed with Google Slides and is available in both standard screen and widescreen aspect ratios. It is also a useful set to elucidate topics like Descriptive Quantitative Research. This well structured design can be downloaded in different formats like PDF, JPG, and PNG. So, without any delay, click on the download button now.
Presenting our Descriptive Research Ppt Powerpoint Presentation Infographic Template Example Introduction Cpb PowerPoint template design. This PowerPoint slide showcases five stages. It is useful to share insightful information on Descriptive Research This PPT slide can be easily accessed in standard screen and widescreen aspect ratios. It is also available in various formats like PDF, PNG, and JPG. Not only this, the PowerPoint slideshow is completely editable and you can effortlessly modify the font size, font type, and shapes according to your wish. Our PPT layout is compatible with Google Slides as well, so download and edit it as per your knowledge.
Presenting our Research Team Leader Job Description In Powerpoint And Google Slides Cpb PowerPoint template design. This PowerPoint slide showcases three stages. It is useful to share insightful information on Research Team Leader Job Description This PPT slide can be easily accessed in standard screen and widescreen aspect ratios. It is also available in various formats like PDF, PNG, and JPG. Not only this, the PowerPoint slideshow is completely editable and you can effortlessly modify the font size, font type, and shapes according to your wish. Our PPT layout is compatible with Google Slides as well, so download and edit it as per your knowledge.
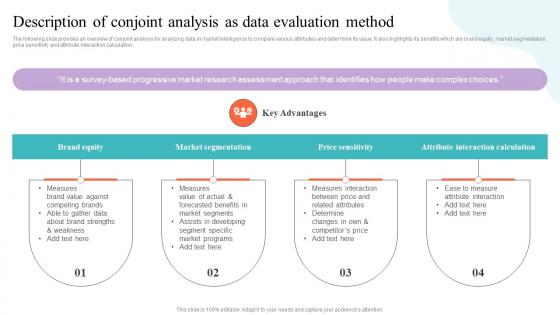
The following slide provides an overview of conjoint analysis for analyzing data in market intelligence to compare various attributes and determine its value. It also highlights its benefits which are brand equity, market segmentation, price sensitivity and attribute interaction calculation. Introducing Strategic Guide To Market Research Description Of Conjoint Analysis As Data Evaluation MKT SS V to increase your presentation threshold. Encompassed with Four stages, this template is a great option to educate and entice your audience. Dispence information on Customer Insight, Market Understanding, Product Intelligence, Competitive Intelligence using this template. Grab it now to reap its full benefits.
This slide presents a research and development team description document that outlines team roles and responsibilities and their goals. It includes key elements such as team leader, number of members, achievements, roles and responsibilities, etc. Introducing our Research And Development Team Description Matrix set of slides. The topics discussed in these slides are Team, Development, Research. This is an immediately available PowerPoint presentation that can be conveniently customized. Download it and convince your audience.
Presenting Descriptive Research Method Types In Powerpoint And Google Slides Cpb. slide which is completely adaptable. The graphics in this PowerPoint slide showcase five stages that will help you succinctly convey the information. In addition, you can alternate the color, font size, font type, and shapes of this PPT layout according to your content. This PPT presentation can be accessed with Google Slides and is available in both standard screen and widescreen aspect ratios. It is also a useful set to elucidate topics like Descriptive Research Method Types. This well structured design can be downloaded in different formats like PDF, JPG, and PNG. So, without any delay, click on the download button now.
Presenting our Descriptive Research Survey In Powerpoint And Google Slides Cpb. PowerPoint template design. This PowerPoint slide showcases four stages. It is useful to share insightful information on Descriptive Research Survey. This PPT slide can be easily accessed in standard screen and widescreen aspect ratios. It is also available in various formats like PDF, PNG, and JPG. Not only this, the PowerPoint slideshow is completely editable and you can effortlessly modify the font size, font type, and shapes according to your wish. Our PPT layout is compatible with Google Slides as well, so download and edit it as per your knowledge.
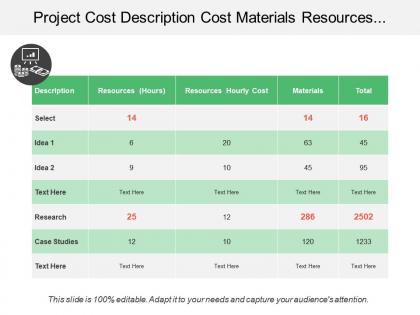
Presenting this set of slides with name - Project Cost Description Cost Materials Resources Research Total. This is a four stage process. The stages in this process are Project Budgeting, Project Financing, Project Cost.
Presenting this set of slides with name - Descript Research Quantitative Research Leadership Strategy Multiplier Effect. This is an editable seven stages graphic that deals with topics like Descript Research, Quantitative Research, Leadership Strategy, Multiplier Effect to help convey your message better graphically. This product is a premium product available for immediate download and is 100 percent editable in Powerpoint. Download this now and use it in your presentations to impress your audience.
Presenting this set of slides with name Descriptive Data Analysis Quantitative Research Ppt Powerpoint Presentation Summary Model Cpb. This is an editable Powerpoint five stages graphic that deals with topics like Descriptive Data Analysis Quantitative Research to help convey your message better graphically. This product is a premium product available for immediate download and is 100 percent editable in Powerpoint. Download this now and use it in your presentations to impress your audience.
Presenting this set of slides with name Descriptive Research Ppt Powerpoint Presentation Outline Microsoft Cpb. This is an editable Powerpoint five stages graphic that deals with topics like Descriptive Research to help convey your message better graphically. This product is a premium product available for immediate download and is 100 percent editable in Powerpoint. Download this now and use it in your presentations to impress your audience.
Presenting this set of slides with name Operations Research Analyst Job Description Ppt Powerpoint Presentation Inspiration Gallery Cpb. This is an editable Powerpoint five stages graphic that deals with topics like Operations Research Analyst Job Description to help convey your message better graphically. This product is a premium product available for immediate download and is 100 percent editable in Powerpoint. Download this now and use it in your presentations to impress your audience.
Presenting this set of slides with name Descriptive Research Methods Ppt Powerpoint Presentation Visual Aids Example 2015 Cpb. This is an editable Powerpoint six stages graphic that deals with topics like Descriptive Research Methods to help convey your message better graphically. This product is a premium product available for immediate download and is 100 percent editable in Powerpoint. Download this now and use it in your presentations to impress your audience.
Here we present One Page Research Proposal With Project Description Presentation Report Infographic PPT PDF Document one pager PowerPoint template. Present a summary of your project in a synchronized manner taking the assistance of this readily available research proposal PowerPoint slide design. State the title of research proposal along with the objectives. Outline the area of study within which your research falls utilizing this amazingly designed project research proposal PowerPoint template. This slide will help you in formulating a detailed plan of the project that also includes methods and its techniques. Talk about the quantitative and qualitative approaches used in research proposal. This project research proposal will let you describe what is to be investigated and how investigation will take place. Talk about the data collection and sampling techniques that should be followed while preparing the project proposal. Showcase the milestones achieved and time duration for completing the research proposal. You can also talk about the costing of this entire project proposal utilizing this creative PowerPoint slide show. This template can be downloaded and saved in JPG, PNG, JPEG and PDF file format. Prepare a blueprint of the study by incorporating this customizable PowerPoint template. Grab this One Page Research Proposal With Project Description Presentation Report Infographic PPT PDF Document one pager template now.
Presenting our Descriptive Research Ppt Powerpoint Presentation Model Example Topics Cpb PowerPoint template design. This PowerPoint slide showcases four stages. It is useful to share insightful information on Descriptive Research This PPT slide can be easily accessed in standard screen and widescreen aspect ratios. It is also available in various formats like PDF, PNG, and JPG. Not only this, the PowerPoint slideshow is completely editable and you can effortlessly modify the font size, font type, and shapes according to your wish. Our PPT layout is compatible with Google Slides as well, so download and edit it as per your knowledge.
Presenting Descriptive Research Ppt Powerpoint Presentation Inspiration Templates Cpb slide which is completely adaptable. The graphics in this PowerPoint slide showcase five stages that will help you succinctly convey the information. In addition, you can alternate the color, font size, font type, and shapes of this PPT layout according to your content. This PPT presentation can be accessed with Google Slides and is available in both standard screen and widescreen aspect ratios. It is also a useful set to elucidate topics like Descriptive Research. This well-structured design can be downloaded in different formats like PDF, JPG, and PNG. So, without any delay, click on the download button now.
Presenting Descriptive Research Examples Ppt Powerpoint Presentation Gallery Background Cpb slide which is completely adaptable. The graphics in this PowerPoint slide showcase three stages that will help you succinctly convey the information. In addition, you can alternate the color, font size, font type, and shapes of this PPT layout according to your content. This PPT presentation can be accessed with Google Slides and is available in both standard screen and widescreen aspect ratios. It is also a useful set to elucidate topics like Descriptive Research Examples. This well-structured design can be downloaded in different formats like PDF, JPG, and PNG. So, without any delay, click on the download button now.
Presenting Descriptive Vs Causal Research Ppt Powerpoint Presentation Icon Outfit Cpb. slide which is completely adaptable. The graphics in this PowerPoint slide showcase three stages that will help you succinctly convey the information. In addition, you can alternate the color, font size, font type, and shapes of this PPT layout according to your content. This PPT presentation can be accessed with Google Slides and is available in both standard screen and widescreen aspect ratios. It is also a useful set to elucidate topics like descriptive vs causal research. This well structured design can be downloaded in different formats like PDF, JPG, and PNG. So, without any delay, click on the download button now.
Presenting Descriptive Research Methods Ppt Powerpoint Presentation Show Layout Cpb. slide which is completely adaptable. The graphics in this PowerPoint slide showcase four stages that will help you succinctly convey the information. In addition, you can alternate the color, font size, font type, and shapes of this PPT layout according to your content. This PPT presentation can be accessed with Google Slides and is available in both standard screen and widescreen aspect ratios. It is also a useful set to elucidate topics like Descriptive Research Methods. This well structured design can be downloaded in different formats like PDF, JPG, and PNG. So, without any delay, click on the download button now.
This is a One Pager titled Psychology Research Proposal Addressing Brief Description About Our Firm One Pager Sample Example Document featuring A4 size content and graphics. It is designed in PowerPoint by an expert and is 100 percent editable. You can also access it with Google Slides.
Presenting Strengths Weaknesses Descriptive Research Ppt Powerpoint Presentation Outline Layouts Cpb slide which is completely adaptable. The graphics in this PowerPoint slide showcase three stages that will help you succinctly convey the information. In addition, you can alternate the color, font size, font type, and shapes of this PPT layout according to your content. This PPT presentation can be accessed with Google Slides and is available in both standard screen and widescreen aspect ratios. It is also a useful set to elucidate topics like Strengths Weaknesses Descriptive Research. This well structured design can be downloaded in different formats like PDF, JPG, and PNG. So, without any delay, click on the download button now.
Presenting our Descriptive Qualitative Research Analysis Ppt Powerpoint Presentation Inspiration Background Image Cpb PowerPoint template design. This PowerPoint slide showcases four stages. It is useful to share insightful information on Descriptive Qualitative Research Analysis This PPT slide can be easily accessed in standard screen and widescreen aspect ratios. It is also available in various formats like PDF, PNG, and JPG. Not only this, the PowerPoint slideshow is completely editable and you can effortlessly modify the font size, font type, and shapes according to your wish. Our PPT layout is compatible with Google Slides as well, so download and edit it as per your knowledge.
Presenting Descriptive Research Design Types Ppt Powerpoint Presentation Slides Portfolio Cpb slide which is completely adaptable. The graphics in this PowerPoint slide showcase three stages that will help you succinctly convey the information. In addition, you can alternate the color, font size, font type, and shapes of this PPT layout according to your content. This PPT presentation can be accessed with Google Slides and is available in both standard screen and widescreen aspect ratios. It is also a useful set to elucidate topics like Descriptive Research Design Types. This well-structured design can be downloaded in different formats like PDF, JPG, and PNG. So, without any delay, click on the download button now.
Presenting Descriptive Research Problem Ppt Powerpoint Presentation Ideas Icon Cpb slide which is completely adaptable. The graphics in this PowerPoint slide showcase two stages that will help you succinctly convey the information. In addition, you can alternate the color, font size, font type, and shapes of this PPT layout according to your content. This PPT presentation can be accessed with Google Slides and is available in both standard screen and widescreen aspect ratios. It is also a useful set to elucidate topics like Descriptive Research Problem. This well structured design can be downloaded in different formats like PDF, JPG, and PNG. So, without any delay, click on the download button now.
Presenting our Descriptive Study Research Ppt Powerpoint Presentation Pictures Icon Cpb PowerPoint template design. This PowerPoint slide showcases five stages. It is useful to share insightful information on Descriptive Study Research This PPT slide can be easily accessed in standard screen and widescreen aspect ratios. It is also available in various formats like PDF, PNG, and JPG. Not only this, the PowerPoint slideshow is completely editable and you can effortlessly modify the font size, font type, and shapes according to your wish. Our PPT layout is compatible with Google Slides as well, so download and edit it as per your knowledge.
Presenting our Exploratory Descriptive Qualitative Research Ppt Powerpoint Presentation Outline Design Templates Cpb PowerPoint template design. This PowerPoint slide showcases four stages. It is useful to share insightful information on Exploratory Descriptive Qualitative Research This PPT slide can be easily accessed in standard screen and widescreen aspect ratios. It is also available in various formats like PDF, PNG, and JPG. Not only this, the PowerPoint slideshow is completely editable and you can effortlessly modify the font size, font type, and shapes according to your wish. Our PPT layout is compatible with Google Slides as well, so download and edit it as per your knowledge.
Presenting our Descriptive Research Problem Ppt Powerpoint Presentation File Master Slide Cpb PowerPoint template design. This PowerPoint slide showcases three stages. It is useful to share insightful information on Descriptive Research Problem This PPT slide can be easily accessed in standard screen and widescreen aspect ratios. It is also available in various formats like PDF, PNG, and JPG. Not only this, the PowerPoint slideshow is completely editable and you can effortlessly modify the font size, font type, and shapes according to your wish. Our PPT layout is compatible with Google Slides as well, so download and edit it as per your knowledge.
Presenting Descriptive Study Research Ppt Powerpoint Presentation Slides Outfit Cpb slide which is completely adaptable. The graphics in this PowerPoint slide showcase six stages that will help you succinctly convey the information. In addition, you can alternate the color, font size, font type, and shapes of this PPT layout according to your content. This PPT presentation can be accessed with Google Slides and is available in both standard screen and widescreen aspect ratios. It is also a useful set to elucidate topics like Descriptive Study Research. This well structured design can be downloaded in different formats like PDF, JPG, and PNG. So, without any delay, click on the download button now.
Presenting our Descriptive Research Design Ppt Powerpoint Presentation Icon Gridlines Cpb PowerPoint template design. This PowerPoint slide showcases four stages. It is useful to share insightful information on Descriptive Research Design This PPT slide can be easily accessed in standard screen and widescreen aspect ratios. It is also available in various formats like PDF, PNG, and JPG. Not only this, the PowerPoint slideshow is completely editable and you can effortlessly modify the font size, font type, and shapes according to your wish. Our PPT layout is compatible with Google Slides as well, so download and edit it as per your knowledge.
Presenting our Pros Cons Descriptive Research Ppt Powerpoint Presentation Model Icon Cpb PowerPoint template design. This PowerPoint slide showcases four stages. It is useful to share insightful information on Pros Cons Descriptive Research This PPT slide can be easily accessed in standard screen and widescreen aspect ratios. It is also available in various formats like PDF, PNG, and JPG. Not only this, the PowerPoint slideshow is completely editable and you can effortlessly modify the font size, font type, and shapes according to your wish. Our PPT layout is compatible with Google Slides as well, so download and edit it as per your knowledge.
Presenting Goal Descriptive Research Ppt Powerpoint Presentation Infographic Template Designs Download Cpb slide which is completely adaptable. The graphics in this PowerPoint slide showcase six stages that will help you succinctly convey the information. In addition, you can alternate the color, font size, font type, and shapes of this PPT layout according to your content. This PPT presentation can be accessed with Google Slides and is available in both standard screen and widescreen aspect ratios. It is also a useful set to elucidate topics like Goal Descriptive Research. This well-structured design can be downloaded in different formats like PDF, JPG, and PNG. So, without any delay, click on the download button now.
Presenting our Descriptive Research Design Ppt Powerpoint Presentation Icon Designs Cpb PowerPoint template design. This PowerPoint slide showcases four stages. It is useful to share insightful information on Descriptive Research Design This PPT slide can be easily accessed in standard screen and widescreen aspect ratios. It is also available in various formats like PDF, PNG, and JPG. Not only this, the PowerPoint slideshow is completely editable and you can effortlessly modify the font size, font type, and shapes according to your wish. Our PPT layout is compatible with Google Slides as well, so download and edit it as per your knowledge.
Presenting Descriptive Exploratory Research Ppt Powerpoint Presentation Summary Infographics Cpb slide which is completely adaptable. The graphics in this PowerPoint slide showcase four stages that will help you succinctly convey the information. In addition, you can alternate the color, font size, font type, and shapes of this PPT layout according to your content. This PPT presentation can be accessed with Google Slides and is available in both standard screen and widescreen aspect ratios. It is also a useful set to elucidate topics like Descriptive Exploratory Research. This well-structured design can be downloaded in different formats like PDF, JPG, and PNG. So, without any delay, click on the download button now.
Presenting Descriptive Research Case Study Ppt Powerpoint Presentation Professional Sample Cpb slide which is completely adaptable. The graphics in this PowerPoint slide showcase four stages that will help you succinctly convey the information. In addition, you can alternate the color, font size, font type, and shapes of this PPT layout according to your content. This PPT presentation can be accessed with Google Slides and is available in both standard screen and widescreen aspect ratios. It is also a useful set to elucidate topics like Descriptive Research Case Study. This well-structured design can be downloaded in different formats like PDF, JPG, and PNG. So, without any delay, click on the download button now.
Presenting our Types Qualitative Descriptive Research Ppt Powerpoint Presentation Show Example Cpb PowerPoint template design. This PowerPoint slide showcases four stages. It is useful to share insightful information on Types Qualitative Descriptive Research This PPT slide can be easily accessed in standard screen and widescreen aspect ratios. It is also available in various formats like PDF, PNG, and JPG. Not only this, the PowerPoint slideshow is completely editable and you can effortlessly modify the font size, font type, and shapes according to your wish. Our PPT layout is compatible with Google Slides as well, so download and edit it as per your knowledge.
Presenting Examples Descriptive Research Ppt Powerpoint Presentation Model Guidelines Cpb slide which is completely adaptable. The graphics in this PowerPoint slide showcase three stages that will help you succinctly convey the information. In addition, you can alternate the color, font size, font type, and shapes of this PPT layout according to your content. This PPT presentation can be accessed with Google Slides and is available in both standard screen and widescreen aspect ratios. It is also a useful set to elucidate topics like Examples Descriptive Research. This well-structured design can be downloaded in different formats like PDF, JPG, and PNG. So, without any delay, click on the download button now.
Presenting our Exploratory Research Descriptive Research Ppt Powerpoint Presentation Infographic Template Summary Cpb PowerPoint template design. This PowerPoint slide showcases four stages. It is useful to share insightful information on Exploratory Research Descriptive Research. This PPT slide can be easily accessed in standard screen and widescreen aspect ratios. It is also available in various formats like PDF, PNG, and JPG. Not only this, the PowerPoint slideshow is completely editable and you can effortlessly modify the font size, font type, and shapes according to your wish. Our PPT layout is compatible with Google Slides as well, so download and edit it as per your knowledge.
Presenting Causal Research Vs Descriptive Research Ppt Powerpoint Presentation Summary Infographic Template Cpb slide which is completely adaptable. The graphics in this PowerPoint slide showcase three stages that will help you succinctly convey the information. In addition, you can alternate the color, font size, font type, and shapes of this PPT layout according to your content. This PPT presentation can be accessed with Google Slides and is available in both standard screen and widescreen aspect ratios. It is also a useful set to elucidate topics like Causal Research Vs Descriptive Research. This well-structured design can be downloaded in different formats like PDF, JPG, and PNG. So, without any delay, click on the download button now.
Presenting our Techniques Descriptive Research Ppt Powerpoint Presentation Portfolio Graphics Design Cpb PowerPoint template design. This PowerPoint slide showcases three stages. It is useful to share insightful information on Techniques Descriptive Research This PPT slide can be easily accessed in standard screen and widescreen aspect ratios. It is also available in various formats like PDF, PNG, and JPG. Not only this, the PowerPoint slideshow is completely editable and you can effortlessly modify the font size, font type, and shapes according to your wish. Our PPT layout is compatible with Google Slides as well, so download and edit it as per your knowledge.
Presenting Exploratory Descriptive Causal Research Ppt Powerpoint Presentation Infographics Portrait Cpb slide which is completely adaptable. The graphics in this PowerPoint slide showcase four stages that will help you succinctly convey the information. In addition, you can alternate the color, font size, font type, and shapes of this PPT layout according to your content. This PPT presentation can be accessed with Google Slides and is available in both standard screen and widescreen aspect ratios. It is also a useful set to elucidate topics like Exploratory Descriptive Causal Research. This well-structured design can be downloaded in different formats like PDF, JPG, and PNG. So, without any delay, click on the download button now.

DESCRIPTIVE RESEARCH
Apr 26, 2012
1.06k likes | 2.28k Views
DESCRIPTIVE RESEARCH. To behold is to look beyond the fact; to observe, to go beyond the observation Look at the world of people, and you will be overwhelmed by what you see
Share Presentation
- qualitative studies
- high school
- exciting information
- same measurement instrument
- descriptive research designs

Presentation Transcript
DESCRIPTIVE RESEARCH • To behold is to look beyond the fact; to observe, to go beyond the observation • Look at the world of people, and you will be overwhelmed by what you see • But select from that mass of humanity a well-chosen few, and observe them with insight, and they will tell you more than all the multitudes together
Descriptive Quantitative Research • Involves either identifying the characteristics of an observed phenomenon or exploring possible correlations among two or more phenomena • In every case, descriptive research examines a situation AS IT IS • It does not involve changing or modifying the situation under investigation, nor is it intended to determine cause-and-effect relationships • Strategies include sampling, making observations, interviewing – take on a very different form when we want them to yield quantitative data
Descriptive Research Designs • Include observation studies, correlational research, developmental designs, and survey research • All of these approaches yield quantitative information that can be summarized through statistical analyses • Survey research is the most frequently used in all disciplines
Observation Studies • In qualitative studies, observations are usually recorded in great detail, perhaps with fieldnotes or videotapes that capture the wide variety of ways in which people act and interact • From these data, the researcher constructs a complex yet integrated picture of how people spend their time • In quantitative research, an observation study is quite different • Typically, the focus is on a particular aspect of behaviour • Furthermore, the behaviour is quantified in some way • In some situations, each occurrence of the behaviour is counted to determine its overall frequency • In other situations, the behaviour is rated for accuracy, intensity, maturity, or some other dimension • But regardless of approach, the researcher strives to be as objective as possible in assessing the behaviour being studied
Observation Studies • To maintain such objectivity, he or she is likely to use strategies such as the following: 1) Define the behaviour being studied in a precise, concrete manner so that the behaviour is easily recognised when it occurs 2) Divide the observation period into small segments and then record whether the behaviour does or does not occur during each segment 3) Use a rating scale to evaluate the behaviour in terms of specific dimensions 4) Have two or three people rate the same behaviour independently, without knowledge of one another’s ratings 5) Train the rater(s) to follow specific criteria when counting or evaluating the behaviour, and continue training until consistent ratings are obtained for any single occurrence of the behaviour
Observation Studies • Despite the extensive investment (time and energy), an observational study can yield data that portray much of the richness and complexity of human behaviour • In some situations, then, it provides a quantitative alternative to such approaches as ethnographies and grounded theory studies
Correlational Research • A correlational studyexamines the extent to which differences in one characteristic or variable are related to differences in one or more other characteristics or variables • A correlation exists if, when one variable increases, another variable either increases or decreases in a somewhat predictable fashion
Correlational Research • Simple correlation – researchers gather data about two or more characteristics; numbers that reflect specific measurements of the characteristics in question – test scores, CGPAs, ratings, … • Each has two numbers, used to calculate correlation coefficient (r) • If perfectly correlated r = +1.00 or r = -1.00 • If unrelated or remotely related, r is close to 0 • Moderate correlations are common
Correlational Research • Examining only two variables – helpful to plot on scatterplot (also known as scattergram) to allow a visual inspection of the relationship between the two variables • Refer to page 181 of the textbook for the scatterplot • The diagonal line running through the middle of the dots is called the line of regression reflects a hypothetical perfect correlation • If all the dots fell exactly on this line, r would be +1.00, dots below the line show children whose reading level is advanced for their age, and dots above the line show children who are lagging a bit in reading
Correlational Research Can make 3 statements from the scatterplot. 1) Can describe the homogeneity or heterogeneity of the two variables (the extent to which the children are similar to or different from one another with respect to age and reading level. Eg. group of only age 6 and 7 has greater homogeneity than group of age 6 - 13) 2) Can describe the degree to which the two variables are intercorrelated by computing the correlation coefficientr 3) The most important, we can interpret the data and give them meaning – children’s reading level improves as they grow older, without hesitation as shown by the upward trend of the dots from left to right
A Caution About Interpreting Correlational Results • In all correlational studies, be alert for faulty logic • Correlation does not, in and of itself, indicate causation • Although in some cases, influence may indeed be present, for example, chronological age influences mental development, including their reading ability • But ultimately we can never infer a cause-and-effect relationship on the basis of correlation alone
A Caution About Interpreting Correlational Results • One variable correlates meaningfully with another only when a common causal bond links the phenomena of both variables in a logical relationship • Increase in the population of birds in Tasik Serdang has no meaningful relationship with the increase of the population of elephants in Thailand – the correlation is simply a fluke and meaningless
A Caution About Interpreting Correlational Results • In the example, the faulty logic is readily apparent, yet we often see similarly faulty reasoning proposed in correlational research reports • Imagine that a researcher finds a correlation between socioeconomic level and academic performance - it would be all too easy to draw the conclusion that socioeconomic status directly affects academic achievement – also if we could improve the family’s economic status, then the learning ability of the family’s children would also improve
A Caution About Interpreting Correlational Results • No, no, no! We cannot make an inference about causation on the basis of correlated data alone • It is possible that salary does have an impact on children’s grades, BUT it is equally possible that it does not • May be an undetermined third variable influences BOTH the salary and the children’s school performance • If we were to infer that socioeconomic status directly affects academic achievement, not only would we be going far beyond the data we have, but we would also have trouble accounting for all of the world’s geniuses and intellectual giants, some of whom have been born of indigent parents and grown up in poverty
A Caution About Interpreting Correlational Results • The data may not lie, but the causal conclusions we draw from the data may, at times, be extremely suspect • Nevertheless, a good researcher must not be content to stop at the point of finding a correlational relationship, because beneath the correlation lie some potentially quite interesting data whose interpretation may conceivably lead to the discovery of new and exciting information • r is just a signpost pointing to further findings
A Caution About Interpreting Correlational Results • The forces of the correlated data will determine the ultimate meaning of the correlation
How Validity and Reliability Affect Correlation • We will not find correlation if the measurement instruments have poor validity and reliability • For example, if the reading test used is neither a valid (accurate) nor reliable (consistent) measure of reading achievement, therefore we will not find correlation
Developmental Designs • To study how a particular characteristic changes, use either 1) a cross-sectional (X-S) study or 2) a longitudinal (LG) study • In a cross-sectional study, a developmental psychologist might study the nature of friendships for children at ages 4, 8, 12, and 16. A gerontologist might consider how retired people in their 70s, 80s, and 90s, are most likely to spend their leisure time
Developmental Designs • In a longitudinal study, a single group of people is followed over the course of several months or years, and data related to the characteristic(s) under investigation are collected at various times • For example, an educational psychologist might get measures of academic achievement and social adjustment for a group of Year Four students and then, 10 years later, find out which students had completed high school and which ones had not
Developmental Designs • Obviously, cross-sectional studies are easier to conduct than longitudinal studies, because the researcher can collect all the needed data at a single time, and don’t have to worry tracking down people • An additional disadvantage of a longitudinal design is that when people respond repeatedly to the same measurement instrument, they are likely to improve simply because of their practice with the instrument, even if the characteristic being measured hasn’t changed at all
Developmental Designs • A disadvantage of cross-sectional designs is that the different age groups sampled may have been raised under different environmental conditions • Groups of 20-year-olds and 70-year-olds – different education standards • A second disadvantage of a cross-sectional design is that we cannot compute correlations between characteristics at different age levels
Survey Research • Survey means “to look or see over or beyond” • “Looking” or “seeing” is not restricted to perception through the physical eye only • Survey research involves acquiring information about one or more groups of people – perhaps about their characteristics, opinions, attitudes, or previous experiences – by asking them questions and tabulating their answers • The ultimate goal is to learn about a large population by surveying a sample of that population
Survey Research • This approach is called a descriptive survey or normative survey • Reduced to its basic elements, a survey is quite simple in design: The researcher poses a series of questions to willing participants; summarises their responses with percentages, frequency counts, or more sophisticated statistical indexes; and then draws inferences about a particular population from the responses of the sample • It is a common approach, used with more or less sophistication in many areas of human activity
Survey Research • This is not to suggest, however, that because of its frequent use, a survey is any less demanding in its design requirements or any easier for the researcher to conduct than any other type of research • Quite the contrary, the survey design makes critical demands on the researcher that, if not carefully respected, may place the entire research effort in jeopardy
Survey Research • Survey research captures a fleeting moment in time • By drawing conclusions from one transitory collection of data, we may extrapolate about the state of affairs over a longer time period • At best, the extrapolation is a conjecture, and sometimes a hazardous one at that, but it is our only way to generalise from what we see • So often, survey reports that we read seem to suggest that what the researcher found in one sample population at one particular time can be accepted for all time as a constant
Survey Research • An additional consideration in survey research is that we are relying on self-report data • People are telling us what they believe to be true or, perhaps, what they think we want to hear • People’s memories for events are often distortions of reality: What they think happened isn’t always what did happen • Furthermore, people’s descriptions of their attitudes and opinions are often constructed on the spot – often times, they haven’t really thought about certain issues until a researcher poses a question about them – and so may be coloured by recent events or the current context
Survey Research • An additional problem is that some people may intentionally misrepresent the facts (at least, the “facts” as they know them) in order to present a favourable impression to the researcher • Survey research typically employs a face-to-face interview, a telephone interview, or a written questionnaire
Face-to-Face and Telephone Interviews • In survey research, interviews are fairly structured • In a structured interview, the researcher asks a standard set of questions and nothing more • In a semi-structured interview, the research may follow the standard questions with one or more individually tailored questions to get clarification or probe a person’s reasoning • The interview tends to be informal and friendly in a qualitative study but more formal and emotionally neutral in a quantitative one • Participants in a qualitative interview may feel as if they’re simply engaging in a friendly chat with the researcher, who is typically someone they’ve come to know and trust
Face-to-Face and Telephone Interviews • In contrast, participants in survey research are continually aware that, yes, this is an interview, and that the temporary relationship they’ve formed with the researcher will end once the interview is complete • This is not to say, however, that a survey researcher shouldn’t strive to establish rapport with participants • Quite the contrary, the researcher is more likely to gain participants’ cooperation and encourage them to respond honestly if he or she is likable and friendly and shows a genuine interest in what they have to say
Face-to-Face and Telephone Interviews • Face-to-face interviews have the distinct advantage of enabling the researcher to establish rapport with potential participants and therefore gain their cooperation; thus, such interviews yield the highest response rates – the percentages of people agreeing to participate – in survey research • However, the time and expense involved may be prohibitive if the needed interviewees reside in a variety of states and countries
Face-to-Face and Telephone Interviews • Telephone interviews are less time-consuming and less expensive (they involve only the cost of long-distance calls), and the researcher has ready access to virtually anyone on the planet who has a telephone • Although the response rate is not as high as for a face-to-face interview (many people are apt to be busy, annoyed at being bothered, or otherwise not interested in participating), it is considerably higher than for a mailed questionnaire • The researcher cannot establish the same kind of rapport that is possible in a face-to-face situation, and the sample will be biased to the extent that people without phones are part of the population about whom the researcher wants to draw inferences • Personal interviews, whether they be face-to-face or over the telephone, allow the researcher to clarify ambiguous answers and, when appropriate, seek follow-up information • Because such interviews take time, however, they may not be practical when large sample sizes are important
Questionnaires • Data lie deep within the minds or attitudes, feelings, or reaction of men/women • Instrument for observing the data beyond the physical reach is the questionnaires since paper-pencil questionnaires can be sent to a large number of people, including those who live thousands of miles away • Thus, they may save the researcher travel expenses, and postage is typically cheaper than a lengthy long-distance telephone call • The social scientist who collects data with a questionnaire and the physicist who determines the presence of radioactivity with a Geiger counter are at just about the same degree of remoteness from their respective sources of data: Neither sees the source from which the data originate • The Geiger counter and questionnaires are impersonal probe • They are governed by practical guidelines
Questionnaires • From the perspective of survey participants, this distance becomes an additional advantage: Participants can respond to questions with assurance that their responses will be anonymous, and so they may be more truthful than they would be in a personal interview, particularly when they are talking about sensitive or controversial issues • Yet questionnaires have their drawbacks as well • Typically, the majority of people who receive questionnaires don’t return them – in other words, there may be a low return rate – and the people who do return them are not necessarily representative of the originally selected sample • Even when people are willing participants in a questionnaire study, their responses will reflect their reading and writing skills and, perhaps, their misinterpretation of one or more questions • Furthermore, by specifying in advance all of the questions that will be asked – and thereby eliminating other questions that could be asked about the issue or phenomenon in question – the researcher is apt to gain only limited, and possibly distorted, information
Using Checklists and Rating Scales • Observation studies look at people’s behaviours, and developmental studies, correlational studies, and survey research frequently use questionnaires to learn about people’s behaviours, characteristics, attitudes, and opinions • Behaviours and attitudes are often quite complex and so not, at least on the surface, easily evaluated or quantified • Two techniques that facilitate both evaluation and quantification in such circumstances are the checklist and the rating scale • A checklist is a list of behaviours, characteristics, or other entities that a researcher is investigating. Either the researcher or participants (depending on the study) simply check(s) whether each item on the list is observed, present, or true; or else not observed, present, or true
Using Checklists and Rating Scales • A rating scale is more useful when a behaviour, attitude, or other phenomenon of interest needs to be evaluated on a continuum of, say, “inadequate” to “excellent”, “never” to “always”, or “strongly disapprove” to “strongly approve” • Rating scales were developed by Rensis Likert in the 1930s to assess people’s attitudes; accordingly, they are sometimes called Likert scales • Experts have mixed views about letting respondents remain neutral in interviews and questionnaires • If you use rating scales in your own research, you should consider the implications of letting your respondents”straddle the fence” by including a “no opinion” or other neutral response, and design your scales accordingly
Using Checklists and Rating Scales • Whenever you use checklists or rating scales, you simplify and more easily quantify people’s behaviours and attitudes • In the process, however, you may lose valuable information • Ultimately you will have to determine whether the trade-offs is worth it for the particular research problem you are investigating
Planning and Conducting Interviews • Interviewing involves much more than just asking questions • The questions for the interview should be carefully planned and precisely worded to yield the kinds of data the researcher needs to answer his or her research question
Guidelines for Conducting Interviews in a Quantitative Study • Make sure your interviewees are representative of the group • Find a suitable location • Get written permission • Establish and maintain rapport • Focus on the actual rather than on the abstract or hypothetical • Don’t put words in people’s mouths • Record responses verbatim • Keep your reactions to yourself • Remember that you are not necessarily getting the facts But interviews are typically more structured in quantitative studies than they are in qualitative studies. The following are additional guidelines for conducting interviews in quantitative research
Guidelines for Conducting Interviews in a Quantitative Study 10. As you write the questions, consider how you can quantify the responses, and modify the questions accordingly. Remember, you are conducting a quantitative study. Thus, you will, to some extent, be coding people’s responses as numbers and, quite possibly, conducting statistical analyses on those numbers. You will be able to assign numerical codes to responses more easily if you identify an appropriate coding scheme ahead of time 11. Consider asking questions that will elicit qualitative information as well. You do not necessarily have to quantify everything. People’s responses to a few open-ended questions may support or provide additional insights into the numerical data you obtain from more structured questions
Guidelines for Conducting Interviews in a Quantitative Study 12. Pilot-test the questions. When you plan your interview, you will, of course, be trying hard to develop clear and concise questions. Despite your best intentions, however, you may write questions that are ambiguous or misleading or that yield uninterpretable or otherwise useless responses. You can save yourself a great deal of time over the long run if you fine-tune your questions before you begin data collection. You can easily find the weak spots in your questions by asking a few volunteers to answer them in a pilot study 13. Restrict each question to a single idea. Don’t try to get too much information in any single question; in doing so, you may get multiple kinds of data – “mixed messages”, so to speak – that are difficult to interpret
Guidelines for Conducting Interviews in a Quantitative Study 14. Save controversial questions for the latter part of the interview. If you will be touching on sensitive topics (e.g., attitudes about AIDS, opinions about gun control), put them near the end of the interview, after you have established rapport and gained the person’s trust 15. Seek clarifying information when necessary. Be alert for responses that are vague or otherwise difficult to interpret. Simple probes such as “Can you tell me more about that?” may produce the additional information you need
Constructing and Administering a Questionnaire • Questionnaires seem so simple, yet in our experience they can be tricky to construct and administer • One false step can lead to uninterpretable data or an abysmally low return rate
Guidelines for Constructing a Questionnaire 1. Keep it short. Your questionnaire should be as brief as possible and solicit only that information essential to the research project. You should test every item by two criteria: (a) What do I intend to do with the information I am requesting? and (b) Is it absolutely essential to have this information to solve part of the research problem? 2. Use simple, clear, unambiguous language. Write questions that communicate exactly what you want to know. Avoid terms that your respondents may not understand, such as obscure words or technical jargon. Also avoid words that do not have precise meanings, such as several and usually
Guidelines for Constructing a Questionnaire 3. Check for unwarranted assumptions implicit in your questions. Consider a very simple question: “How many cigarettes do you smoke each day?” It seems to be a clear and unambiguous question, especially if we accompany it with certain choices so that all the respondent has to do is to check one of them: How many cigarettes do you smoke each day? (Check one of the following.) More than 25 25-16 15-11 10-6 5-1 None • One obvious assumption here is that the person is a smoker, which probably is not the case for all participants • A second assumption is that a person smokes the same number of cigarettes each day, but for many smokers, this assumption is not true • At work, if under pressure, they may be chain smokers and may smoke more
Guidelines for Constructing a Questionnaire • But at home on weekends and holidays, they may relax and smoke only one or two cigarettes a day or go without smoking at all • How are the people in this group supposed to answer the above question? • What box does this type of smoker check? • First, you have to inspect the assumption underlying the question: Does it fit the reality? • Had the author of the question considered the assumptions on which the question was predicated, he or she might first have asked questions as these: “Do you smoke cigarettes? Yes No (If you mark “no”, skip the next two questions.) “Are your daily smoking habits reasonably consistent; that is, do you smoke about the same number of cigarettes each day?” Yes No (If you mark “no”, skip the next question.)
Guidelines for Constructing a Questionnaire 4. Word your questions in ways that do not give clues about preferred or more desirable responses. Take another question: “What strategies have you used to try to quit smoking?” By implying that the respondent has, in fact, tried to quit, it may lead him or her to describe strategies that have never been seriously tried at all 5. Check for consistency. When an issue about which you are asking is such that some respondents may give answers that are socially acceptable rather than true, you may wish to incorporate a “countercheck” question into your list at some distance from the first question. This strategy helps verify the consistency with which a respondent has answered questions. For instance, take the following two items appearing in a questionnaire as items 2 and 30. (Their distance from each other increases the likelihood that a person will answer the second without recalling how he or she answered the first.)
Guidelines for Constructing a Questionnaire Notice how one individual has answered them: 2. Check one of the following choices: In my thinking, I am a socialist. __ In my thinking, I am a capitalist. 30. Check one of the following choices: __ I believe that major economic activities must be owned by the state. I believe that major economic activities must be owned by private owners. The two responses are inconsistent. In the first, the respondent claims to be a socialist but later, when given the socialist and the capitalist positions in another form, indicates a position generally thought to be more capitalist than socialist. Such an inconsistency might lead you to question whether the respondent is truly the socialist thinker that he or she claims to be
Guidelines for Constructing a Questionnaire 6. Determine in advance how you will code the responses. As you write your questions, perhaps even before you write them, develop a plan for recoding participants’ responses into numerical data that you can statistically analyse. Data processing procedures may also dictate the form a questionnaire should take. If, for example, people’s response sheets will be fed into a computer scanner, the questionnaire must be structured differently than if the responses will be tabulated using paper and pencil
Guidelines for Constructing a Questionnaire 7. Keep the respondent’s task simple. Make the instrument as simple to read and respond to as possible. Remember, you are asking for people’s time, a precious commodity for many people these days • Discussion items – those that present open-ended questions and ask people to respond with lengthy answers – are time-consuming and mentally exhausting for both the participants and the researcher. Don’t forget that you will have to wrestle with the participants’ words to try to determine exactly what their answers mean. Those who write in the “Yes/no, and I’ll tell you why” style are few and far between. The usefulness of responses to discussion items rests entirely on participants’ skill to express in words the thoughts they wish to convey. Respondents may ramble, engaging in discussion that doesn’t answer the question or is beside the point • Save your respondents and yourself from this ordeal. After answering 15 to 20 discussion questions, your respondents will think you are demanding a book! Such a major compositional exercise is unfair to those from whom you are requesting a favour
Guidelines for Constructing a Questionnaire 8. Provide clear instructions. Communicate exactly how you want people to respond. For instance, don’t assume that they are familiar with Likert scales. Some of them may never have seen such scales before 9. Give a rationale for any items whose purpose may be unclear. We can’t say this enough: You are asking people to do you a favour by responding to your questionnaire. Give them a reason to want to do the favour. At a minimum, each question should have a purpose, and in one way or another, you should make that purpose clear 10. Make the questionnaire attractive and professional looking. Your instrument should have clean lines, crystal-clear typing (and certainly no typos!), and, perhaps, two or more colours
- More by User

Descriptive Research Techniques
Descriptive Research Techniques Survey Techniques Week 6 Study Materials for Module 6 Study Book Module 6 Cavana – Ch 10: pp. 225-6; 239-46. Ch 14: pp 351-60 Selected Reading 6.1 & 6.2 (only business students) Jennings – Ch 8: pp. 227-44; 254-62. Ch 10: pp.328-38
2.64k views • 30 slides

Educational Research: Descriptive Research
Educational Research: Descriptive Research. EDU 8603 Educational Research Richard M. Jacobs, OSA, Ph.D. Research. The systematic application of a family of methods employed to provide trustworthy information about problems.
1.35k views • 88 slides

Descriptive Research Methodologies
What is Descriptive Research?. Can involve collecting quantitative informationCan describe categories of qualitative information such as patterns of interaction when using technology in the classroom.Does not fit neatly into either category. What is Descriptive Research?. Involves gathering data that describe events and then organizes, tabulates, depicts, and describes the data.Uses description as a tool to organize data into patterns that emerge during analysis. Often uses visual aids suc1141
1.07k views • 28 slides

Descriptive Research
Descriptive Research. A Study of Status. Types of Descriptive Research. Developmental studies - Longitudinal - Cross-sectional Case study Correlational Normative Observational Action Ex post facto Survey. Developmental Research.
1.11k views • 22 slides

Descriptive Research (I)
Descriptive Research (I). Week 8 Lecture 1. Agenda. Quantitative Design issues Correlation Research Survey Research. Quantitative design issues. The language of variables and hypotheses Quantitative researchers redefine concepts of interest into the language of variables
680 views • 24 slides

Agenda. Descriptive Research DesignsUsing Checklists and Rating ScalesPractical ApplicationInterpreting Data in Descriptive ResearchSome Final Suggestions. Descriptive Research Designs. Approaches that yield quantitative informationthat can be summarized through statisticalanalyses. . Observat
890 views • 28 slides

Descriptive Research. The Work of Clinical Nurse Specialists in the Acute Care Setting Julie Darmody MSN, RN, ACNS-BC Doctoral Candidate, UW-Madison School of Nursing Clinical Assistant Professor, UW-Milwaukee College of Nursing. Acknowledgements. This research was partially supported by:
541 views • 35 slides

Descriptive Research. Marketing Research – MKTG 446. Angela D’Auria Stanton, Ph.D. Descriptive Research. Descriptive research (often referred to as survey research) is aimed at characterizing phenomena and identifying association among selected variables. Descriptive research can be used to:
5.04k views • 18 slides

Descriptive Research. Week 8 Lecture 2. Agenda. Basic sampling concepts Probability sampling Non-probability sampling. Sampling in everyday life. Eating at one of a chain of restaurant => All the restaurant in the chain serve poor food Decision on taking some course
628 views • 17 slides
Multivariate Descriptive Research
Multivariate Descriptive Research. In the previous lecture, we discussed ways to quantify the relationship between two variables when those variables are continuous. What do we do when one or more of the variables is categorical?. Categorical Variables.
300 views • 12 slides

Descriptive Research. This lecture ties into chapter 17 of Terre Blanche How do we create hypotheses ? Start with a rough idea of how the world is The more accurate the idea, the better the hypothesis Ideas are based on data Who is doing what, how often, how much
633 views • 16 slides

Descriptive Research. Observation: Can you see the behavior? Is it a sensitive topic? Do you have a lot of time? Do you know what you are looking for?. Natural Observation No intervention - behavior as it normally occurs
401 views • 22 slides

Descriptive Research. Survey research Developmental studies Follow-up studies Sociometric Studies. Surveys. Researcher samples a portion of a large population Allows to infer the current status of an issue Nutritional practices Exercise patterns. Developmental Studies.
402 views • 13 slides
Types of Descriptive Research
Types of Descriptive Research. The Case Study The Survey Naturalistic Observation. The Case Study. Where one person (or situation) is observed in depth. What are the strengths and weaknesses of using a tragedy like the Columbine School Shootings as a case study?. The Survey Method.
2.22k views • 26 slides

DESCRIPTIVE RESEARCH. ADVANCED RESEARCH METHODS. I. The methodology of survey research .
463 views • 17 slides

The Descriptive Research Strategy
The idea that skirt lengths are a predictor of the stock market direction. According to the theory, if skirts are short, it means the markets are going up. And if skirt are long, it means the markets are heading down. Also called the Hemline Theory. The Descriptive Research Strategy. Chapter 13
436 views • 27 slides

Educational Research: Descriptive Research. Shannelle Gay P. Paracha Master of English in Applied Linguistics. Research. The systematic application of a family of methods employed to provide trustworthy information about problems. "recherche".
1.26k views • 77 slides

Descriptive Research methods
Descriptive Research methods. Dr. Surej P John. Main Topics . C onceptual Framework Hypothesis development Descriptive research methods Survey Observation. The Theoretical/Conceptual Framework.
962 views • 38 slides

Descriptive Research Design
Descriptive Research Design. Ch 6. Survey Methods. The survey method involves a structured questionnaire given to respondents and designed to elicit specific information This method of obtaining information is based on questioning respondents
724 views • 48 slides

Descriptive Research. Survey Research Methods Public opinion polls Census surveys Developmental Surveys. Public opinion polls. Gallup polls Political elections network news pre-election polls exit polls. U.S. Census survey. Conducted every 10 years in the U.S. since 1790.
473 views • 18 slides

Descriptive Research. Descriptive Research Purpose Documents/Describes Behaviors/conditions/effects In individuals / in groups It is often tied to exploratory research (which finds relationships) Descriptive Research often foundational for: Classification Identifying relevant variables
8.99k views • 17 slides

Descriptive Research. determines and describes “ the way things are ” is the basis for all other forms of research is predominant in the social sciences and education does not always have independent variables. Descriptive Research Methods. Behavior Observation Research Survey Research.
968 views • 16 slides

IMAGES
VIDEO
COMMENTS
Descriptive research can be defined as a method used to describe something, usually in great detail. This type of research is often used in the sciences, such as in biology or psychology. It can also be used in other fields, such as marketing or sociology. There are many different ways to collect data for descriptive research, lets take a look ...
Revised on June 22, 2023. Descriptive research aims to accurately and systematically describe a population, situation or phenomenon. It can answer what, where, when and how questions, but not why questions. A descriptive research design can use a wide variety of research methods to investigate one or more variables.
As discussed earlier, common research methods for descriptive research include surveys, case studies, observational studies, cross-sectional studies, and longitudinal studies. Design your study: Plan the details of your study, including the sampling strategy, data collection methods, and data analysis plan.
Descriptive and Causal Research. Descriptive Research. Marketing Research - MKTG 446. Angela D'Auria Stanton, Ph.D. Descriptive Research Descriptive research (often referred to as survey research) is aimed at characterizing phenomena and identifying association among selected variables. Descriptive research can be used to: describe the ...
* Outline Introduction 1 a 2 DR design & Analysis 3 Discussions 4 Descriptive Research * DR design & Analysis 1. Descriptive Research Designs Observation Studies Correlational Research Developmental Designs Survey Research 2. ... PowerPoint Template Author: Sung Ha, Park Last modified by: yli52 Created Date: 8/26/2004 6:30:40 AM Document ...
INTRODUCTION. In our previous article in this series, [ 1] we introduced the concept of "study designs"- as "the set of methods and procedures used to collect and analyze data on variables specified in a particular research question.". Study designs are primarily of two types - observational and interventional, with the former being ...
Descriptive Research vs. Exploratory Research. Descriptive research is a research method that focuses on providing a detailed and accurate account of a specific situation, group, or phenomenon. This type of research describes the characteristics, behaviors, or relationships within the given context without looking for an underlying cause.
DESCRIPTIVE-RESEARCH-DESIGN.pptx - Free download as Powerpoint Presentation (.ppt / .pptx), PDF File (.pdf), Text File (.txt) or view presentation slides online. Descriptive research is a quantitative research method that describes the characteristics of a population or phenomenon without determining why something occurs. It focuses on describing what is happening rather than explaining why.
Leverage our Descriptive Research presentation template for MS PowerPoint and Google Slides to describe the methodology used in a scientific research/inquiry to observe and document the important behaviors, phenomena, events, etc., within a specific context.
A research design is a strategy for answering your research question using empirical data. Creating a research design means making decisions about: Your overall research objectives and approach. Whether you'll rely on primary research or secondary research. Your sampling methods or criteria for selecting subjects. Your data collection methods.
Title: DESCRIPTIVE RESEARCH. 1. DESCRIPTIVE RESEARCH. To behold is to look beyond the fact to observe, to go beyond the observation. Look at the world of people, and you will be. overwhelmed by what you see. But select from that mass of humanity a. well-chosen few, and observe them with insight,
A descriptive study design is a research method that observes and describes the behaviour of subjects from a scientific viewpoint with regard to variables of a situation (Sharma, 2019). Here, the ...
Descriptive Research. Descriptive Research. determines and describes " the way things are " is the basis for all other forms of research is predominant in the social sciences and education does not always have independent variables. Descriptive Research Methods. Behavior Observation Research Survey Research. 964 views • 16 slides
Presentation Transcript. Descriptive Research Design Ch 6. Survey Methods • The survey method involves a structured questionnaire given to respondents and designed to elicit specific information • This method of obtaining information is based on questioning respondents • Respondents are asked a variety of questions regarding their ...
Presenting Descriptive Research Design Types Ppt Powerpoint Presentation Slides Portfolio Cpb slide which is completely adaptable. The graphics in this PowerPoint slide showcase three stages that will help you succinctly convey the information. In addition, you can alternate the color, font size, font type, and shapes of this PPT layout ...
During download, if you can't get a presentation, the file might be deleted by the publisher. ... Descriptive Research Design. Descriptive Research Design. Ch 6. Survey Methods. The survey method involves a structured questionnaire given to respondents and designed to elicit specific information This method of obtaining information is based on ...